Contenu connexe
Similaire à 140908_rapid_urban_planning_tools_for_city_extensions._tool_4_-_urban_types._building_plot_public_space_and_the_road_draft.pdf (20)
140908_rapid_urban_planning_tools_for_city_extensions._tool_4_-_urban_types._building_plot_public_space_and_the_road_draft.pdf
- 1. 1
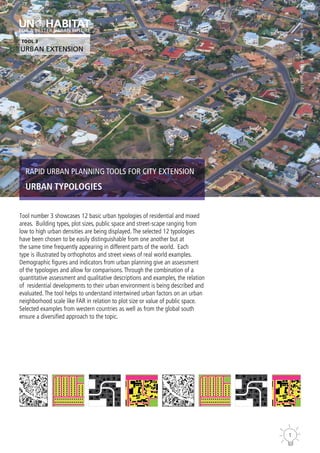
RAPID URBAN PLANNING TOOLS FOR CITY EXTENSION
URBAN TYPOLOGIES
Tool number 3 showcases 12 basic urban typologies of residential and mixed
areas. Building types, plot sizes, public space and street-scape ranging from
low to high urban densities are being displayed.The selected 12 typologies
have been chosen to be easily distinguishable from one another but at
the same time frequently appearing in different parts of the world. Each
type is illustrated by orthophotos and street views of real world examples.
Demographic figures and indicators from urban planning give an assessment
of the typologies and allow for comparisons.Through the combination of a
quantitative assessment and qualitative descriptions and examples, the relation
of residential developments to their urban environment is being described and
evaluated.The tool helps to understand intertwined urban factors on an urban
neighborhood scale like FAR in relation to plot size or value of public space.
Selected examples from western countries as well as from the global south
ensure a diversified approach to the topic.
Cape
Town,
South
Africa
©
Flickr/Prasad
Pillai
TOOL 3
URBAN EXTENSION
- 2. Rapid Urban Planning Tools for City Extension. Tool 3: Urban Typologies
2 3
Building Footprint buildings & Plots Public Space
1. Informal Settlement
Kibera, Nairobi, Kenya
Dharavi, Mumbai, India
Kibera © khym54
Dharavi © Ting Chen
further examples:
Karail Bosti, Dhaka, Bangladesh
Soweto, Johannesburg, South Africa
• difficulty of defining private space and street space
• highest gross coverage with over half of the area covered with buildings
• not the highest population density (bit lower than block)
average number of stories 1
dwelling size 20
dwellings/ha 274
coverage 55 % (gross)
65 % (net)
FAR 0.5 (gross)
0.7 (net)
inhabitants/ha 55,000 (household size=2)
135,000 (household size=5)
13% 3% 84%
buildings
plots
streets
public (no steets)
0 50 100 200m
0 50 100 200m
- 3. Rapid Urban Planning Tools for City Extension. Tool 3: Urban Typologies
4 5
Building Footprint buildings & Plots Public Space
2. Rural Houses
• not urban but still included (hardly comparable to urban areas)
• by for the highest number of public space (if not agricultural land)
• lowest percentage of streets
Cagayan de Oro © Thomas Stellmach
Nyagatare © Joost Möhlman
near Cagayan de Oro Philippines
Near Nyagartare, Rwanda
average number of stories 2
dwelling size 150
dwellings/ha 1
coverage 0% (gross)
6% (net)
FAR 0.0 (gross)
0.1 (net)
inhabitants/ha 100 (household size=2)
250 (household size=5)
13% 3% 84%
buildings
plots
streets
public (no steets)
0 50 100 200m
0 50 100 200m
- 4. Rapid Urban Planning Tools for City Extension. Tool 3: Urban Typologies
6 7
Building Footprint buildings & Plots Public Space
3. Semi-Urban Area
• mainly suburban areas and rural urban fringe
• largest plot sizes, relatively low percentage of street-space
• lowest population density and coverage after rural area
• has to be seen in comparison to connectivity and accessibility
• low FAR
Belvedere Park, Atlanta, USA
Rubavu, Rwanda
Atlanta, USA © Google Earth
Rubavu © Joost Möhlman
further examples:
Haaltert, Belgium
average number of stories 1
dwelling size 120
dwellings/ha 6
coverage 7% (gross)
10% (net)
FAR 0.1 (gross)
0.1 (net)
inhabitants/ha 1,000 (household size=2)
3,000 (household size=5)
9% 20% 71%
buildings
plots
streets
public (no steets)
0 50 100 200m
0 50 100 200m
- 5. Rapid Urban Planning Tools for City Extension. Tool 3: Urban Typologies
8 9
Building Footprint buildings & Plots Public Space
4. Developer Community
• often gated communities (especially in African and Latin American countries)
• lowest population density and coverage inside the urban boundary
Rondevallei, Cape Town, South Africa
MHazienda Santa Fe, Guadalajara,
Mexico
Cape Town, South Africa © Google Earth
Guadalajara, Mexico © Google Earth
further examples:
Tambore 5 Villagio, Sao Paulo, Brazil
Dhahran, Saudi Arabia (Expat Villages)
average number of stories 1.5
dwelling size 112.5
dwellings/ha 28
coverage 16% (gross)
25% (net)
FAR 0.3 (gross)
0.5 (net)
inhabitants/ha 5,500 (household size=2)
14,000 (household size=5)
23% 14% 63%
buildings
plots
streets
public (no steets)
0 50 100 200m
0 50 100 200m
- 6. Rapid Urban Planning Tools for City Extension. Tool 3: Urban Typologies
10 11
Building Footprint buildings & Plots Public Space
5. Mixed/Redeveloped
• grown area
• mixed use
• inner-city
• urban centres of many African cities
• space for densification, dynamic
Iloilo, Philippines
Maputo, Mozambique
Iloilo © Constantine Augustin
Maputo © F Mira
further examples:
Lome,Togo
Dar es Salaam,Tanzania
average number of stories 3
dwelling size 120
dwellings/ha 75
coverage 30% (gross)
46% (net)
FAR 0.9 (gross)
1.4 (net)
inhabitants/ha 15,000 (household size=2)
35,000 (household size=5)
26% 9% 65%
buildings
plots
streets
public (no steets)
0 50 100 200m
0 50 100 200m
- 7. Rapid Urban Planning Tools for City Extension. Tool 3: Urban Typologies
12 13
Building Footprint buildings & Plots Public Space
6. Multifamily Complex
• high diversity in number of stories and size (as seen on the picture)
• relatively high percentage of public space
• large plots of one owner Quartiere XXVII Monte SACRO Alto,
Rome, Italy
Sid Barakat, Alexandria, Egypt
Rome, Italy © Google Earth
Alexandria © Lyn Gateley
further examples:
Kirchheim, Heidelberg, Germany
Les Portes de Marrakesh, Marrakesh,
Morocco
average number of stories 5
dwelling size 60
dwellings/ha 66
coverage 13% (gross)
22% (net)
FAR 0.4 (gross)
0.7
inhabitants/ha 13,000 (household size=2)
30,000 (household size=5)
18% 22% 60%
buildings
plots
streets
public (no steets)
0 50 100 200m
0 50 100 200m
- 8. Rapid Urban Planning Tools for City Extension. Tool 3: Urban Typologies
14 15
Building Footprint Public Space
buildings & Plots
7. Row House
• 3rd largest percentage of plots
• mostly older neighborhoods
• street grid MERTON PARK, London, UK
VILLERAY, Montreal, Canada
London, UK © Google Earth
Montreal, Canada © Google Earth
further examples:
University Quarter, Belfast, Northen
Ireland
Taman Megah Ria, Johor Bahru,
Malaysia
average number of stories 2
dwelling size 90
dwellings/ha 65
coverage 29% (gross)
47% (net)
FAR 0.6 (gross)
0.9 (net)
inhabitants/ha 13,000 (household size=2)
30,000 (household size=5)
28% 9% 63%
buildings
plots
streets
public (no steets)
0 50 100 200m
0 50 100 200m
- 9. Rapid Urban Planning Tools for City Extension. Tool 3: Urban Typologies
16 17
Building Footprint buildings & Plots Public Space
8. Block
• few public space
• inner-city
• highest FAR after residential towers and CBD
• high population density
• mixed use
• well connected
• diverse plot and dwelling size
Lyon, France
Madrid, Spain
Lyon, France © Google Earth
Madrid, Spain © Google Earth
further examples:
Žižkov, Prague, Check Republic
Mollevangen, Malmö, Sveden
average number of stories 5
dwelling size 60
dwellings/ha 330
coverage 40% (gross)
73% (net)
FAR 2.0 (gross)
3.7 (net)
inhabitants/ha 65,000 (household size=2)
165,000 (household size=5)
38% 8% 54%
buildings
plots
streets
public (no steets)
0 50 100 200m
0 50 100 200m
- 10. Rapid Urban Planning Tools for City Extension. Tool 3: Urban Typologies
18 19
Building Footprint buildings & Plots Public Space
9. Densified Block
• city centres of many European cities
• population density very high (comparable to residential tower)
• very little public area except for street-space
• grown area
• often large street width
• mixed use
Paris, France
Munich, Germany
Paris, France © Google Earth
Munich, Germany © Google Earth
further examples:
Vienna,Austria
Milano, Italy
average number of stories 5
dwelling size 60
dwellings/ha 360
coverage 44% (gross)
68% (net)
FAR 2.2 (gross)
3.4 (net)
inhabitants/ha 70,000 (household size=2)
180,000 (household size=5)
buildings
plots
streets
public (no steets)
34% 2% 64%
0 50 100 200m
0 50 100 200m
- 11. Rapid Urban Planning Tools for City Extension. Tool 3: Urban Typologies
20 21
Building Footprint buildings & Plots Public Space
10. Slab
• high population density combined with a low coverage
• former soviet union and east Asia
• large access roads
• very strong in size and building depth (appr. 12 - 25m)
Xiu Mamcun, Shanghai, China
RAYON CHERTANOVO TSENTRALNOYE,
Moscow, Russia
Moscow, Russia © Google Earth
Shanghai © Sarah Worthy
further examples:
Nacheng Zhuagcun, Beijing, China
Petrzalka, Bratislava, Slovakia
average number of stories 8
dwelling size 60
dwellings/ha 240
coverage 18% (gross)
38% (net)
FAR 1.5 (gross)
3.1 (net)
inhabitants/ha 50,000 (household size=2)
120,000 (household size=5)
34% 18% 47%
buildings
plots
streets
public (no steets)
0 50 100 200m
0 50 100 200m
- 12. Rapid Urban Planning Tools for City Extension. Tool 3: Urban Typologies
22 23
Building Footprint buildings & Plots Public Space
11. Tower
• high percentage of public space
• highest population density
• East Asia
• large streets
• buildings not directly accessible from main road
• highest average number of stories
Wicity Seoul, South Korea
Hai Hu New Village, Beijing, China
Beijing, China © 陈常嘉_北京
Seoul, South Korea © Google Earth
further examples:
Navi, Mumbai, India
Huangjiagou, Chongqing, China
average number of stories 15
dwelling size 60
dwellings/ha 370
coverage 15% (gross)
28% (net)
FAR 2.2 (gross)
4.2 (net)
inhabitants/ha 70,000 (household size=2)
180,000 (household size=5)
34% 9% 57%
buildings
plots
streets
public (no steets)
0 50 100 200m
0 50 100 200m
- 13. Rapid Urban Planning Tools for City Extension. Tool 3: Urban Typologies
24 25
Building Footprint buildings & Plots Public Space
12. CBD
• mixed use, commercial use
• difficult to estimate residential density, varies strongly from city to city
• low amount of public green
• often rigid street grid Chicago, USA
Johannesburg, South Africa
Chicago, USA © Google Earth
Johannesburg, South Africa
© Google Earth
further examples:
Santiago de Chile, Chile
Hongkong
average number of stories 10
dwelling size
dwellings/ha
coverage 48% (gross)
83% (net)
FAR 4.8 (gross)
8.3 (net)
inhabitants/ha
34% 9% 57%
buildings
plots
streets
public (no steets)
0 50 100 200m
0 50 100 200m
- 14. Rapid Urban Planning Tools for City Extension. Tool 3: Urban Typologies
26 27
0 100,000 200,000 300,000 400,000 500,000 600,000 700,000 800,000
12. CBD
11. tower
10. slab
9. densified block
8. block
7. row house
6. multifamily complex
5. mixed/redeveloped
4. developer community
3. semi-urban area
2.rural house
1 informal settlement
Population Desity
householdsize=5 householdsize=2
0 10 20 30 40 50 60 70 80 90 100
12. CBD
11. tower
10. slab
9. densified block
8. block
7. row house
6. multifamily complex
5. mixed/redeveloped
4. developer community
3. semi-urban area
2. rural house
1. informal settlement
Coverage in %
net coverage % (buildings/plots) gross coverage % (buildings/total area)
0 1 2 3 4 5 6 7 8 9 10
12. CBD
11. tower
10. slab
9. densified block
8. block
7. row house
6. multifamily complex
5. mixed/redeveloped
4. developer community
3. semi-urban area
2. rural house
1. informal settlement
Floor Area Ratio (FAR)
net FAR (plots) gross FAR (all area)
Evaluation of Indicators
TEXT TEXT
TEXT TEXT
34
26
34
34
38
28
18
26
23
9
4
13
9
22
18
2
8
9
22
9
14
20
90
3
57
52
47
64
54
63
60
65
63
71
6
84
0 50 100
12. CBD
11. tower
10. slab
9. densified block
8. block
7. row house
6. multifamily complex
5. mixed/redeveloped
4. developer community
3. semi-urban area
2. rural house
1. informal settlement
% streets % public (no streets) % plots
- 15. UN-Habitat (United Nations Human Settlements Programme)
Urban Planning and Design Branch
P.O.BOX30030 Nairobi 00100 Kenya
Tel: +254 20 7623706
urban.planning@unhabitat.org
www.unhabitat.org
September
2014
Johor
Bahru,
Malaysia
©
Alessandro
Scotti