This document summarizes a student's final year bioengineering project report. The project aimed to streamline access to biological part characterization data from the SynBIS database. It developed a program to fetch data from SynBIS and generate datasheets in PDF and other machine-readable formats. It also generated SBML files to integrate the data with modeling tools. The program allows automatic updating of datasheets when experimental data changes, improving workflow efficiency. It demonstrates flexibility by customizing datasheets for different experimental studies.
1. Gan Chong Yee BEng Bioengineering Final Year Report, 2015
CID: 00701519
1 | P a g e
Streamlining the Dissemination of
Standardised Characterisation of Biological
Parts: Developing Programmatic Access to
SynBIS Environment
Department of Bioengineering,
Imperial College London
(B.Eng Final Year Project Report, 2015)
Submitted by: Gan Chong Yee
Supervised by: Professor Richard Ian Kitney
2. Gan Chong Yee BEng Bioengineering Final Year Report, 2015
CID: 00701519
2 | P a g e
Abstract
Synthetic biology aims to employ engineering methods towards the understanding and
design of biological systems. Such approach necessitates a better understanding of each
smaller component that make up a larger biological product. These fundamental elements,
the biological parts, requires an accurate characterisation in a standardised manner in order
to better predict, measure and reproduce an intended biological function in a product. Such
efforts are championed by the Centre for Synthetic Biology and Innovation (CSynBI), which
employs standardised experimental protocols, measurements and analyses to characterise
these biological parts, and to upload them in an online database known as SynBIS. As a
datasheet acts as a medium of information exchange for such characterisation data, this
project aims to fetch the SynBIS data and to generate a subsequent datasheet in a human
readable format. In addition, other machine readable formats were created as well in order
to integrate the SynBIS database to prevalent modelling and simulation tools. This
optimization effort in disseminating the SynBIS characterisation data to the wider scientific
community aims to support a concerted effort between researchers and designers to
characterise and model these biological parts for an overall understanding in the wider
context of biological systems.
3. Gan Chong Yee BEng Bioengineering Final Year Report, 2015
CID: 00701519
3 | P a g e
Acknowledgements
First and formost, I would like to express my utmost gratitude to Professor Richard Ian
Kitney for supervising me throughout this project. Other invaluable members of CSynBI have
guided me significantly throughout the developmental process of the final product. Special
thanks is directed to Dr. Inaki Sainz De Murieta and Dr. Matthieu Bultell who have provided
great assistance and guidance to me both professionally and personally throughout the year.
I would also like to thank Chris Hirst for taking his time out to elucidate the various key
aspects of the synthetic biology field, and the lab work involved in contriving the data for
SynBIS. Thank you to Ms. Catherine Ainsworth for her great advice in the creation of our
final report.
Finally, I would like to thank my parents, without which this magnificient experience would
never be had.
4. Gan Chong Yee BEng Bioengineering Final Year Report, 2015
CID: 00701519
4 | P a g e
Table of Contents
Topics Page Number
1 List of Abbreviations 5
3 Chapter 1: Introduction 6
4 Chapter 2: Technical Development 11
5 Chapter 3: User Guide 31
6 Chapter 4: Results and Evaluation 36
7 Chapter 5: Future Work 47
8 Chapter 6: Conclusions 48
9 Bibliography 49
10 Appendix 51
5. Gan Chong Yee BEng Bioengineering Final Year Report, 2015
CID: 00701519
5 | P a g e
List of Abbreviations
1. SBPkb : Knowledgebase of Standard Biological Parts
2. SBOL : Synthetic Biology Open Language
3. JBEIr : Joint BioEnergy Institure Registry
4. SynBIOSS : Synthetic Biology Software Suite
5. CAD : Computer Aided Design
6. CSynBI : Centre for Synthetic Biology and Innovation
7. PDF : Portable Document Format
8. XML : Extensible Markup Language
9. API : Application Program Interface
10. SBML : Systems Biology Markup Language
11. IDE : Integrated Development Environment
12. JDK : Java Platform Standard Edition Development Kit
13. SDK : Software Development Kit
14. URL : Uniform Resource Locator
15. GFP : Green Fluorescent Protein
6. Gan Chong Yee BEng Bioengineering Final Year Report, 2015
CID: 00701519
6 | P a g e
Chapter 1: Introduction
Despite the many advances in synthetic biology in the agricultural, medicine and
pharmaceutical applications, such applications are mostly devised through an exhaustive
process of repetitive experimentation done on an individual basis (Gan, 2014). This is due in
part to the heterogeneity and stochastic nature of each component that make up a
biological product - contrary to that other engineering fields (Gan, 2014). Regardless,
through methods in network motifs and modules, these variations and complex functions
can be derived from a finite number of simpler basis sets (Wolf et. al, 2003). This means that
whilst noisy, biological devices are modular and can be broken down into smaller biological
parts.
Consequently, a better understanding of these parts via characterisation has been an
essential aspect of synthetic biology to recreate, improve and predict the behaviour of such
products efficiently, especially due to the unpredictable nature of biology (Csete & Doyle)
and the growing sophistication of its genetic circuitsv (Gan, 2014). As in conventional
engineering methods, utilising a datasheet as a mode of exchanging characterisation data of
biological parts will ensure a concerted effort amongst researchers. Thus, a proper method
of characterisation is crucial as a better understanding of the functional information,
transfer function and contextual data of biological parts which form the basis of complex
organisms and functionalities will prevent overlap of prior work done by other researchers,
and allow further control of subsequent future designs (Gan, 2014).
1.1 Prior Work
As such, the Registry of Standard Biological Parts hosted in the Massachusetts Institute of
Technology was initiated as one of the earliest and largest open source database for the
characterisation of biological parts (Gan, 2014). With it, a Knowledgebase of Standard
Biological Parts (SBPkb) has been established as an accessible platform to export, share and
import such information in the Registry and all future libraries using a universal Synthetic
Biology Open Language (SBOL). However, the extensive repository present in the SBPkb
comes at the price of lack of integrity between the information and its management (Gan,
2014). Such inadequacy was due to the fact that anyone could upload the biological part
information on the database, some of which lacked the standardisation of the protocols
involved in these characterizations. The latter is especially important in enabling
reproducible work among researchers through principles of engineering.
These issues are addressed through various software and researches in recent years. For
instance, the Joint BioEnergy Institure Registry (JBEIr) aims to aid SBPkb in managing the
database, SynBIOSS, whilst the Repository of Standard Virtual Parts augment them with
quantitative information (Gan, 2014). The likes of Clotho, TinkerCell, BioNetCADD, GenoCAD,
Device Editor and BioJADE allow users to model, design and predict behaviours of biological
parts using a Computer Aided Design (CAD) (Gan, 2014). Similarly, Canton et. al. (2008) have
devised a sample datasheet using BioBrick standard biological parts to act as a reference for
future characterisation efforts. However, their results fail to portray sufficient supplemental
information on the corresponding biological part and to provide necessary quantitative
analysis on these parts when implemented in other hosts (Arkin, 2008). On the other hand,
7. Gan Chong Yee BEng Bioengineering Final Year Report, 2015
CID: 00701519
7 | P a g e
Lee et. al. (2011) manage to fill in the gaps by utilising BglBrick parts to devise vectors and
datasheets relevant to parallel and multiple combination of parts.
However, the vast variability, complexity and stochastic nature of each biological systems
call for further studies to determine which relevant information should be included in each
standard datasheet (Arkin, 2008). There is also much uncertainty in the many factors
affecting the behaviour of overall biological systems, which is highly dependent on external
environment and experimental protocols such as the medium and chassis used,
measurement methods and cellular resources (Arkin, 2008). As a relatively new scientific
field, more collaborative efforts must be carried out amongst researcher to further
characterise the increasing amount and heterogeneity of these parts with relevant protocols
and quantitative results.
1.2 Centre for Synthetic Biology and Innovation
Standardisations are pivotal in characterisation to improve their quality, robustness and
integrity. As a relatively novel field, standardisation in biological part characterisation faces
challenges in establishing the minimal and most relevant information to be shared in a
datasheet. This is due in part to a need for such standards to adapt to the rapid advances in
synthetic biology and changes in terms of the language, software and protocols involved.
The Centre for Synthetic Biology and Innovation (CSynBI) aims to push standardisation
studies forward by focusing on the characterisation of biological parts professionally and
efficiently in a standardized manner. Using an Aviso Theonyx liquid handling system based
on Sias Xantus hardware, an optimized and automated workflow has been devised to run
experiments in unified and controlled conditions. In addition, the experiments can be run
manually or with other platforms with comparable specifications, so that the information
can be reproduced and shared amongst partners and researchers without said hardware.
The results of these experiments are then analysed and uploaded to an online information
system known as SynBIS in a well-defined and validated manner.
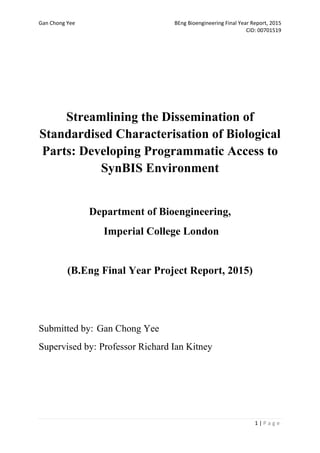
The figure below shows a simplified representation of the work done at CSynBI:
Figure 1: Workflow of Bio Part Characterisation
8. Gan Chong Yee BEng Bioengineering Final Year Report, 2015
CID: 00701519
8 | P a g e
1.3 Project Specification
This project will focus on streamlining the process between the final curation of data to the
design phase, as outlined by the blue arrows in Figure 1, by developing a program to fetch
the required biological parts data from SynBIS and exporting them in human readable
formats such as Portable Document Format (PDF), Extensible Markup Language (XML) or
SBOL locally. This will significantly improve the user experience of clients and designers,
enabling them to perform designs and simulations using the desired SynBIS biological parts
without having to access and search the restricted online platform. This project will also
improve the current Application Program Interface (API) by creating a Java web service to
enable accessibility globally. By reducing the friction in data acquisition, the usability and
overall collaboration of researchers to use a more standardised method in their respective
studies will be encouraged.
The base system introduced by CSynBI to generate PDF datasheet from SynBIS requires
further modification to generate a PDF more efficiently. The datasheet generation code
currently requires experimental data to be updated manually when changes were made in
the lab. However, due to the variability of algorithms, components and experimental
protocols, a greater extent of flexibility is needed to update and distribute this information
efficiently. Thus, this project will also generate an updated version of the datasheet
automatically whenever changes are made to the data obtained from the lab. This program
will effectively optimise the workflow of research done within CSynBI, ensure that the data
accessed by end users are always up to date and reduce the human errors present in
manual datasheet generation.
Beyond creating human readable formats, a huge factor in the dissemination of biological
part data lies in its integration with prevalent software tools. In that respect, the project
aims to generate Systems Biology Markup Language (SBML) files from the SynBIS database, as
SBML functions as de facto standard for exchanging models between various synthetic
biology modelling tools. (Keating et. al, 2013). In order to compound its integration to the
wider community, the program to generate the relevant SBML was developed in Matlab as
it remains one of the most widely used applications for commercial and educational
purposes. (Sharma & Gobbert, 2010).
The SBML files will be appended with information on the experimental protocols and
chemical reactions involved in the biological part. SBML’s integration with many modelling
tools will be useful when evaluating the data analysis and simulations on the respective
biological parts in SynBIS, and such accessibility amongst researchers will further improve
the characterisation efforts done by CSynBI via testing, information exchange and feedback.
In turn, this annotation will also be compatible with SBOL, thus enabling effective
dissemination of these characterisation data to the wider synthetic biology community.
In the preliminary stage, this project will also display the flexibility of the software by editing
the datasheet according to the requirements of different experimental studies conducted in
CsynBI (Kong, 2015). Such requirements are essential as standardisation processes in
9. Gan Chong Yee BEng Bioengineering Final Year Report, 2015
CID: 00701519
9 | P a g e
synthetic biology are rapidly changing; subsequently, adaptability in the corresponding
software will prove invaluable for future works done by CSynBI.
In Chapter 2, we shall dive into the technical details regarding the internal operations of the
software. The developmental process of the software will also be elucidated with instances
of the obstacles faced, corresponding approaches employed to overcome them and the
overall solutions to contrive the end product that will be shown in Chapter 3.
10. Gan Chong Yee BEng Bioengineering Final Year Report, 2015
CID: 00701519
10 | P a g e
Chapter 2: Technical Development
Chapter 2 will be divided into four subsections, each portraying the technical specifications
and developmental process of each subsequent task – the Datasheet Generation (Chapter
2.1), Web Service for Datasheet Generation (Chapter 2.2), SBML Generation (Chapter 2.3)
and Custom Datasheet Generation (Chapter 2.4). In each tasks, further subsections are
madeto better illustrate the steps taken to contrive the final working product.
2.1 Datasheet Generation
2.1.1 Fetching the SynBIS Data
In order to produce a dynamic datasheet - one that updates the parameters and results
whenever they are changed in the lab - we will have to first access the SynBIS data
separately and populate them in the required datasheet layout.
Figure 2: UML diagram of the data structure in SynBIS
As SynBIS utilises a RESTful web service, the parameters were fetched using a JAX-RS Client
API. Thereafter, the parameters will be constructed into a Datasheet structure (Appendix A),
which is defined in another source package within the restClient project.
11. Gan Chong Yee BEng Bioengineering Final Year Report, 2015
CID: 00701519
11 | P a g e
Figure 3: Code to fetch SynBIS data and pass them into a Datasheet structure.
A full tutorial on the API can be found in the official Oracle documentation
(http://docs.oracle.com/javaee/7/tutorial/jaxrs-client.htm). The input argument for target is
the URL for the SynBIS web service.
2.1.2 Creating JRXML and Passing Parameters
Challenges arose when arranging these parameters in the appropriate layout, as static texts
cannot be coded into a conventional XML due to the dynamic nature of the parameters.
Further requirements include dynamic graphs based on these parameters and various image
files to be incorporated into the PDF.
Thus, an open source report designer, TIBCO Jaspersoft Studio ver 6.0.3, was utilised to
implement these sophisticated features in an intuitive manner. Jaspersoft Studio enabled
different elements to be arranged in the desired format, as shown in Figure 4. A JRXML file –
a type of XML file format – was generated accordingly, which was utilised by the NetBeans
IDE to generate the appropriate PDF in a Java program.
Figure 4: Jaspersoft Studio Interface - elements such as borders, images, parameters and
static texts can be added and moved in a user – friendly way.
12. Gan Chong Yee BEng Bioengineering Final Year Report, 2015
CID: 00701519
12 | P a g e
Whilst image files could be generated by simply specifying the file path in the resulting
JRXML, the parameters had to be passed from Netbeans using an embedded Jaspersoft
method. Firstly, a HashMap of parameters was produced, with the element key matching
the parameter name specified in Jaspersoft Studio and the element value being the
parameter value in the datasheet class.
Figure 5: HashMap of parameters – the HashMap was passed in later methods in order to
fill the JRXML with appropriate values during the PDF generation
By specifying reportSource as the file path to the JRXML, and reportDest as the desired file
path of the datasheet was generated using the methods highlighted in Figure 6.
Figure 6: Method to compile, fill parameters and export a PDF file to the file path defined
by reportDest
Further details of the methods can be found from the official Jaspersoft User Guide (Section
8.3.5), and the Oracle Technology Network. However, certain text parameters were not
found, with only their Boolean value defined in SynBIS. For instance, the Boolean value was
assigned to determine if whether the assay was aerobic, without a string value assigned to it.
In keeping with the format of the original datasheet from SynBIS, a conditional statement
was defined in the Java program to create a parameter with the string “O2” should the
assay be aerobic.
13. Gan Chong Yee BEng Bioengineering Final Year Report, 2015
CID: 00701519
13 | P a g e
Figure 7: Custom parameters for alternative SynBIS value types –the highlighted code was
used for the “aerobic” example given in the previous passage.
2.1.3 Calculating the Statistical Measures
After the parameters were passed, the next step was to create the dynamic graphs. Before
this could be done, however, various statistical analyses should be carried out to plot the
values of interest on the graph, such as mean and standard deviation. However, the
extraction and calculation of various statistical measures for the graph encountered several
challenges, and required some unconventional methods to be overcome. These problems,
and their corresponding solutions, will be outlined in throughout this section.
Figure 8: Matlab representation of plateReaderPlot structure – each plateReaderPlot
structure consists of a separate plot point for each experimental trial.
14. Gan Chong Yee BEng Bioengineering Final Year Report, 2015
CID: 00701519
14 | P a g e
Figure 9: Matlab representation of plotPoiunt structure – each plotPoint structure consists
of a list of x and y values, representing fluorescence/absorbance vs. time.
The first issue was due to the fact the plateReaderPlot structure contained certain elements
with an empty structure for its plotPoint, as shown in Figure 8. Therefore, a null pointer
exception error occurred as the iterator was unable to access an empty structure. Thus, the
plateReaderPlot structure was modified in the SynBIS web API to include a Boolean value,
which indicates whether that iteration of the plateReaderPlot had an plotPont structure.
The same modification was done on the flowCytometerCurve structure.
Figure 10: Alterations to plateReaderPlot structure – a Boolean variable was created to
check if plotPoint was set in the SynBIS web API.
Also, since each plotPoint structures within plateReaderPlot contained the same repeated x-
value (from 0 to 360), a conditional statement was defined to create an initial array of x –
values, and to stop adding values if repetitions did occur:
15. Gan Chong Yee BEng Bioengineering Final Year Report, 2015
CID: 00701519
15 | P a g e
Figure 11: Creating the x – value ArrayList – conditional statement was employed in the loop to
prevent repeated x-values.
As for the y – values, an initial array of y – values was also created, but any additional
plotPoint y – values was added to the array in an piecewise manner. This sum, termed as
meanFluoro in the example below, was divided later on by the total number of y – values
(frequency) to calculate the final mean. The same was done on sdFluoro, which will be used
for the calculation of the standard deviations of fluorescence in later parts of the code.
Figure 12: Calculating the sum of y – values and sum of y-values2
In both cases, the conditional loop was defined by checking if an initial array was already
defined (whether or not it is empty), and if a repeat has occurred (the plateLoop was
incremented when another 0 x-value was called by the iterator). The same approach was
employed on flow cytometer results, but with slight alterations due to the slight variation of
the data structure used in registering them.
As seen in Figure 9, another problem was caused by the fact that the NA variable inside the
plotPoint structure indicated that the particular result was not valid, and should not be
accounted when performing the corresponding statistical analyses. When that occurred, the
number of y - values for that particular x – value should be deducted by one, as to not affect
the mean and standard deviation.
16. Gan Chong Yee BEng Bioengineering Final Year Report, 2015
CID: 00701519
16 | P a g e
As different biological part data had different instances of NA values throughout the
experiments, a dynamic method of registering the number of y – values should be employed.
Thus, an ArrayList of y-value frequency was created for both fluorescence and absorbance.
The y – value was then adjusted in an element wise fashion via a conditional statement.
Figure 13: Calibration of y frequency – number of y – values for a specific x – value was
deducted by one to disregard NA y – values.
2.1.4 Creating Custom Fields and Dynamic Graphs
The next agenda was to create custom fields for Jaspersoft Studio. This step was necessary
in the creation of dynamic graphs, as Jaspersoft Studio does not custom arrays as input
arguments for its chart wizard. This task was one of the biggest challenges faced throughout
the Datasheet Generation development process due to the limited documentation on
alternative methods to create fields, as most existing tutorials and documentations focused
on utilising the in-built Sample DB and SampleJRDataSourceFactory data sources (Jaspersoft
Community, 2015).
Initially, an XML Data Adapter was attempted by passing the URL for the datasheet web API
into Jaspersoft Studio to import a remote XML document (Jaspersoft Community, 2015).
However, this method proved inadequate due to the inability to fetch datasheets of other
biological parts, as it would be unfeasible to create a new data adapter and pass a different
URL for each biological part.
More importantly, this method would not enable the creation of the dynamic graphs, as the
graphs’ data points were not arranged as a simple array in the SynBIS web service. As
highlighted in Figure 14, the x and y values of each experiment trial was stored in a separate
data structure known as “plotPoint”. In addition, the XML Data Adapter had a fixed
arrangement of raw data, and did not enable them to be altered as a new array for chart
creation. Also, statistical analyses and arithmetic operations could not be carried out on the
raw data before being defined as fields. Such analyses were crucial in later parts of the
17. Gan Chong Yee BEng Bioengineering Final Year Report, 2015
CID: 00701519
17 | P a g e
project, which required mean values and standard deviations of the raw data to be
calculated before being used to create the respective dynamic graphs.
Figure 14: XML Data Adapter – fields can be passed directly from this structure, but
rearrangement and mathematical operations could not be performed on the data.
The second approach was to use a JRDataSource adapter and a JRDataSourceProvider
adapter (Keating and Le Novere, 2013). This was done by calling the previous JAX-RS Client
API inside a new class defined in Jaspersoft Studio, known as MyImplementation. After
performing the necessary statistical analysis, this class was then used as a Custom
Implementation of a JRDataSource. However, preliminary trials proved unfruitful, as the
fields return were empty.
The same results were obtained in an alternative method. This time, the restClient source
packages were imported into Jaspersoft Studios to fetch SynBIS data and perform the
necessary statistical analysis. Thereafter, MyImplementation would call the results of such
analysis from restClient.
After several trials, it became evident that a more efficient method would be to create a
common data source between Jaspersoft Studio and Netbeans, rather than defining this
data source purely from an JRXML created by Jaspersoft Studio. Thus, a JavaBeans Data
Source was created (Jaspersoft Community, 2015).
18. Gan Chong Yee BEng Bioengineering Final Year Report, 2015
CID: 00701519
18 | P a g e
In order to utilise JavaBeans as data for the fields, a new data structure would have to be
created. Thus, an object named ChartData,was created in the restClient project. This object
consisted of multiple float variables that store the necessary statistical measures of each
graph. A separate class, named CalculateChart, was created to perform the necessary
statistical analysis for the plate reader and flow cytometer graphs. Using the static
synbisData method inside the CalculateChart class, an array was created for each statistical
measure in order to determine the changes across the x –axis, i.e. the change in mean
fluorescence level over time.
Thereafter, synbisData creates a List of ChartData, with each ChartData element
representing the different statistical measures at a specific time. For instance, the first
element of the ChartData List will contain the mean, standard deviation and 2*standard
deviation for the various y-values at time 0.
Figure 15: ChartData class – Each element of the ChartData class represents statistical
measures for various y-components at a specific x-component (time).
Figure 16: Creation of ChartData List – Each nth
element of the list represents a ChartData
structure that contains the nth
element of a statistical measure array.
19. Gan Chong Yee BEng Bioengineering Final Year Report, 2015
CID: 00701519
19 | P a g e
By creating a jar file of the restClient project, a new data adapter known as
testSynbisChartData was created in Jaspersoft Studio by specifying the appropriate jar file
path, classes and methods which produced the fields.
Thereafter, the fields were added and passed to the Jaspersoft Studio chart wizard to
produce the appropriate graphs.
Within Netbeans, the appropriate data source was specified when creating the appropriate
JasperPrint. This was made possible as the classes and method for the data source was
shared by both Netbeans and Jaspersoft Studio.
Figure 17: JasperPrint Creation with an updated JavaBean Data Source
2.1.5 Creating Custom Fields and Dynamic Graphs
Further complications occurred when generating the PDF datasheet. The JavaBean data
source created a new page for each ChartData passed into the compiler. Thus, the original 5
– paged datasheet was duplicated 512 times, thereby generating a 2561- paged PDF:
Figure 18: Duplicate pages formed in the generated datasheet.
Initially, a subreport was created in Jaspersoft Studio to overcome the problem.
(http://community.jaspersoft.com/wiki/creating-charts-and-subreports-jaspersoft-studio)
20. Gan Chong Yee BEng Bioengineering Final Year Report, 2015
CID: 00701519
20 | P a g e
The method, however, proved ineffective as the fields could not be passed into the
subreport via a sub dataset. Taking advantage of the non-repeating property of the
Summary Band in Jaspersoft Studio, the dynamic graph was built there, instead of the Detail
Band to exclude duplicate pages when using the testSynbisDataSource.
As the Summary Band would be displayed at the end of a report, a new method to create a
multi-page report was employed. This was done by creating multiple JasperPrint variables,
each for specific page in the report. A List of JasperPrint variables was then created, and was
then exported into a byte array via the JRPdfExporter. The resulting byte array was then
compiled and exported into a PDF via the FileOutputStream class.
Figure 19: Methods to create a JasperPrint List
Figure 20: Methods to export a byte array from JasperPrint List, and to generate PDF from
the resulting byte array.
21. Gan Chong Yee BEng Bioengineering Final Year Report, 2015
CID: 00701519
21 | P a g e
2.2 Web Service for Datasheet Generation
After the desired PDF was generated locally using a Java program, the next step was to
enable access to this functionality online via a web service. The development of this RESTful
web service underwent a few successive steps, all of which would be outlined in the next
few subsections.
2.2.1 Getting A PDF via Web Service
Firstly, a method was tested to enable users to download a PDF file online. This PDF file has
been uploaded locally from the host computer via a specified file path. This web service can
be called by adding the path “/pdf” to the existing web service URL. Thus, the service URL
will be http://localhost:13614/HelloWorldApplication/rest/myservice/pdf.
Figure 21: Web Service to get a PDF file that was uploaded locally.
Figure 22: Web Service to get a PDF file proved successful, as seen by the boxed diagram.
22. Gan Chong Yee BEng Bioengineering Final Year Report, 2015
CID: 00701519
22 | P a g e
2.2.2 Generating SynBIS Data Sheet via Web Service
This method was then adopted to generate a SynBIS Datasheet. The previous restClient
codes for generating PDF locally was copied into the web service as a separate function,
known as runSynbis. The input variable, id, was specified in the URL for calling the web
service.
Figure 23: Web service to get SynBIS datasheet - The id variable was provided by the user in
the URL. The square box illustrate the fact that a reportDest string was returned by the
runSynbis function. The highlighted region shows the response classed being returned.
Figure 24: RunSynbis function inside the web service – full details of the restClient code,
which was copied into the runSynbis function, can be found in Appendix XXX.
As shown in the boxed area of Figure 23, the runSynbis function returns a string variable.
This string variable represented the file path of the PDF that would be generated by this
web service due to the runSynBis function (which contained the PDF generating restClient
codes). This PDF would then be downloaded again on the user’s browser after the response
class was built and returned, as seen in the highlighted region of Figure 23.
23. Gan Chong Yee BEng Bioengineering Final Year Report, 2015
CID: 00701519
23 | P a g e
2.2.3 Improved Method of Generating SynBIS Data Sheet
Despite the successful attempt to get a PDF file online via the web service, clear
modifications had to be made to streamline the process. This was because the method
shown in Section 4.2.2 required the web service to generate a PDF file prematurely in the
system first. This file was then uploaded from the user’s computer, only to get downloaded
again from the web service. This method not only created 2 separate datasheets, but would
also cause errors if the specified file path does not exist in the user’s computer.
Thus, a slight modification was made to the runSynbis function. Instead of the file path, the
function returns a byte array that was produced by the JRDFExporter method.
Figure 25: Modification to runSynbis function.
Modifications were also made to the web service, in terms of the file type produced and the
URL path of the web service. By specifying a filename in the URL, the user would also be
able to name the downloaded file directly from the browser.
Figure 26: Modified web service to generate SynBIS datasheet.
24. Gan Chong Yee BEng Bioengineering Final Year Report, 2015
CID: 00701519
24 | P a g e
2.3. SBML Generation
The following section outlines both the developmental process of a Matlab program which
generates an SBML file, and the simulation of said file in an appropriate synthetic biology
software tools. In addition, each task would be further divided into smaller subsections
based on the different steps taken and challenges faced to develop the final results outlined
in Chapter 4 (Results and Evaluation).
2.3.1 Fetching SynBIS data
As with the PDF generation, the first step to to create an SBML file with the appropriate
parameters lies in fetching the appropriate data from SynBIS. The in-build webread function
was utilised to read content from a RESTful web service and output them in the
corresponding format.
Figure 27: Webread function to fetch RESTful web service content
2.3.2 Creating SBML structure
In order to create the appropriate SBML file using Matlab, the libSBML API was utilised.
Further details on the installation process for libSBML would be outlined in Chapter 7 (User
Guide).
The functions specified in the SBML Toolbox 4.1 API manual were mainly used to construct
the corresponding structure for the SBML files. This included an Object_create function to
create an empty SBML structure within Matlab. Various functions were also utilised to
assign the appropriate values and sub data structures to the SBML structure’s elements,
such as units, species and compartments. Full details of the Matlab script file can be found
in Apendix C.1.
25. Gan Chong Yee BEng Bioengineering Final Year Report, 2015
CID: 00701519
25 | P a g e
2.3.3 Mathematical Derivation of Model Behaviour and Reactions
The main challenge of the task lied in the derivation of assignment rules for maximum
growth rate and the rate rule for plasmid concentration respectively.
The following logistical model (Ainsworth, 2014) was used in determining the dynamics of
cells expressing SynBIS biological parts:
𝑂𝐷(𝑡) =
𝐴
1 + 𝑒
4𝜇(𝜆−𝑡)
𝐴
+2
Where OD represented the Optical Density or plasmid concentration, A represented the
carrying capacity, µ represented the maximum growth rate and 𝝀 represented the lag time.
The values of these parameters were fetched from the SynBIS database, and were then
assigned as into the SBML structure via the Parameter_setValue function.
Figure 28: Fetching values from SynBIS to be set as parameters in SBML structure.
Most parameters, such as A and 𝝀, could be found in the SynBIS’ characterisation results.
µ, however, had to be derived from other parameters within the biological part
characterisation data (Appendix C.2). The results of this derivation was shown below:
µ =
𝐴 log 2
2 𝑡1/2
Where 𝑡1/2 represents the doubling time of the bacteria’s exponential growth. This formula
was then defined as an assignment rule in the SBML structure.
26. Gan Chong Yee BEng Bioengineering Final Year Report, 2015
CID: 00701519
26 | P a g e
Figure 29: Assignment rule to determine the value of µ from existing SynBIS parameters
With that, the logistical model can be converted into an ordinary differential equation
(Appendix C.3), with its result shown below:
𝑑𝑂𝐷
𝑑𝑡
=
4µ
𝐴
𝑂𝐷 (1 −
𝑂𝐷
𝐴
), with 𝑂𝐷(0) =
𝐴
1+𝑒
4µ
𝐴
𝜆+2
The initial plasmid concentration was calculated and set in the plasmid species structure as
shown in Figure 30. On the other hand, the rate of change of plasmid concentration was
defined as a rate rule in the SBML structure, as shown in Figure 31.
Figure 30: Setting the initial plasmid concentration in the SBML structure
27. Gan Chong Yee BEng Bioengineering Final Year Report, 2015
CID: 00701519
27 | P a g e
Figure 31: Setting the rate rule for rate of change of plasmid concentration in the SBML
structure
The kinetic law which governs the chemical reaction within this model was also found
(Ainsworth, 2014):
𝑑𝐹
𝑑𝑡
= 𝛽𝑂𝐷 − 𝐷𝐹
Where F represented the fluorescence or the concentration of Green Fluorescent Protein
(GFP), β represented the synthesis rate, and D represented the degradation rate of GFP. In
this case, the synthesis rate at 3 hours, which represented the mid exponential phase of the
reaction, was chosen as it was regarded as the model’s region of interest. The degradation,
on the other hand, was neglected for this particular model. This leads to a simplified
equation of:
𝑑𝐹
𝑑𝑡
= 𝛽𝑂𝐷
The dynamics of this reaction was defined as a Kinetic Law in the SBML structure.
Figure 32: Setting the kinetic law of the reaction into the SBML structure.
28. Gan Chong Yee BEng Bioengineering Final Year Report, 2015
CID: 00701519
28 | P a g e
2.3.4 Mathematical Derivation of Model Behaviour and Reactions
Finally, as the required mathematical model, units and species were defined appropriately,
the SBML structure was exported as an SBML file using the OutputSBML function within
libSBML.
Figure 33: Exporting the SBML structure as an SBML file.
29. Gan Chong Yee BEng Bioengineering Final Year Report, 2015
CID: 00701519
29 | P a g e
2.4 Custom Datasheet Generation
As a proof of concept, a custom datasheet was modified and generated to suit other
experimental studies conducted in CSynBI (Kong, 2015). The PDF was generated using
similar methods as those used in Section 3.1. However, the parameters and graphs were
imported locally, and not from an online web service. Similarly, these values were passed as
static elements instead of dynamic ones.
Figure 34: Generating the Custom Datasheet for the J23101 biological part using Jaspersoft
Studio.
The datasheet was also modified for J23106, J23108, J23111 and J23119 biological parts
respectively, each consisting of different values but keeping the same XML layout as those
defined in the J23101 biological part.
The next short section will be a User Guide to illustrate the general steps taken to access the
various functions of the software contrived throughout this project. These instructions will
be explained in a non – technical standpoint.
30. Gan Chong Yee BEng Bioengineering Final Year Report, 2015
CID: 00701519
30 | P a g e
Chapter 3: User Guide
The User Guide will be broken down into four parts, each of which describes the method of
using a particular feature of the project’s end product. These include Datasheet Generation
(Section 3.1), Web Service for Datasheet Generation (Section 3.2), SBML Generation and
Simulation (Section 3.3) and Custom Datasheet Generation (Section 3.4).
In each section, we will go through the installation process, software specifications, and
ways to use the program and run simulations using custom inputs provided by the end user.
3.1 Datasheet Generation
As the software was built in Java, you will have to install the corresponding Integrated
Development Environment (IDE) to run it.
As an example, we will be using NetBeans IDE 8.0.2 in this report. You will require the Java
Platform Standard Edition Development Kit (JDK) 8 Update 20 or above, Java EE7 Software
Development Kit (SDK) Update 1 and GlassFish Server. Further details on the installation
process can be found in the official Oracle Documentation online
(http://docs.oracle.com/javaee/7/tutorial/usingexamples001.htm#GEXAJ), from Sections
2.1.1 to Section 2.1.4.
From there, the user should open the necessary project file, “restClient”, into NetBeans.
Alternatively, a new project can be created, whilst adding the restClient.jar file as a library in
the project. However, if the user chooses to employ the latter method, additional libraries
would have to be added into the project, including those packaged in the “Synbis.zip” file. In
addition, the “EclipseLink (JPA 2.1)”, “Hersey 2.5.1 (JAX – RS RI)”, “Java EE7 API Library”,
“JAX – RS 2.0”, “Java DB Driver” libraries, which can be found in NetBeans’ Global Libraries,
will also need to be added into NetBeans.
The required datasheet for a particular biological part in SynBIS can be generated and
downloaded locally in the user’s computer by changing the input variable of the
runSynbisDatasheet() function, as shown in Figure 35. This variable corresponds to the ID of
a particular biological part that you want to be generated the PDF from.
31. Gan Chong Yee BEng Bioengineering Final Year Report, 2015
CID: 00701519
31 | P a g e
Figure 35: Method of generating datasheet using biological parts of a particular ID.
Figure 36: 1st
page of PDF datasheet of ID 1
Figure 36 shows a segment of the datasheet produced by calling the SynBIS biological part
of ID 1.The resulting datasheet will be automatically generated as a PDF file in the restClient folder.
32. Gan Chong Yee BEng Bioengineering Final Year Report, 2015
CID: 00701519
32 | P a g e
3.2 Web Service for Datasheet Generation
The datasheet can also be generated via a web service without having to change the input
variable inside code manually each time a different biological part data is desired. In this
case, the web service will have to be run on NetBeans again after opening the
“restClientWeb” project.
Once the project is run, your default web browser will be directed to the default link that
corresponds to the “restClientWeb” web service. The Uniform Resource Locator (URL) will
be displayed as http://localhost:13614/restClientWeb/rest/myservice.
In order to retrieve a particular biological part datasheet, you will have to extend the url
with the string “/{id}/file/{filename}”, where {id} represents the ID of the biological part data
you wish to extract, and {filename} will determine the name of the PDF that you will be
downloading to your computer.
For instance, should you wish to retrieve the biological part with an ID of 27, and to name
the file as Datasheet 27, you will need to input in your browser the following url:
http://localhost:13614/restClientWeb/rest/myservice/27/file/Datasheet 27.
33. Gan Chong Yee BEng Bioengineering Final Year Report, 2015
CID: 00701519
33 | P a g e
3.3 SBML Generation and Simulation
The matlab script file, “synbis.m” can be run to generate the appropriate SBML file for
modelling purposes.
In order to run this file, you will need to install the libSBML ver 5.11.4 package accordingly. A
more detailed walkthrough to integrate libSBML into Matlab can be found under the
software section of SBML.org, the official website for SBML
resources.(http://sbml.org/Software/libSBML/5.11.4/docs/formatted/cpp-api/libsbml-
downloading.html ).
Much like the PDF Datasheet generation, the SBML file of different biological parts can be
produced by altering the ID number in the webread() function in the script file.
Once the corresponding SBML file is generated, it can be used in various synthetic biology
modelling tools to conducts analyses and simulations. In the following example, we shall use
iBiosim ver 2.8.4 to verify the behaviour of the model in response to the experiments
conducted in CSynBI. Methods of installing the iBiosim software can be found in its official
website (http://www.async.ece.utah.edu/iBioSim/).
You should first create a new project in iBiosim. Thereafter, the SBML model can be
imported locally in iBiosim. By launching the Analysis Tool for the SBML file, you can
perform various analyses on the model by adjusting the parameters accordingly. As an
example, we have chosen the Embedded Runge – Kutta Fehlberg (4,5) method (rkf45)
simulator, with a time limit of 360 minutes.
The result of simulating the plasmid concentration over time is shown in Figure 37, and
corresponds clearly to the results obtained by CSynBI in the labs.
34. Gan Chong Yee BEng Bioengineering Final Year Report, 2015
CID: 00701519
34 | P a g e
Figure 37: Simulation results for the SBML model created via the synbis.m script.
Chapter 4 will consist of the results obtained using these end products, and an evaluation of
the strengths, weaknesses and possible improvements towards their performances.
35. Gan Chong Yee BEng Bioengineering Final Year Report, 2015
CID: 00701519
35 | P a g e
Chapter 4: Results and Evaluation
This chapter will be divided into three sections, Chapter 5.1 covers the Datasheet
Generation, Chapter 5.2 covers the Web Service for Datasheet Generation, Chapter 5.2
covers the SBML Generation, whilst Chapter 5.3 covers the Custom Datasheet Generation.
4.1 Datasheet Generation
The resulting PDF datasheet generated was outlined below, and was compared with the
data obtained from the SynBIS database:
Figure 38: 1st
page of datasheet – summary of main results
36. Gan Chong Yee BEng Bioengineering Final Year Report, 2015
CID: 00701519
36 | P a g e
F
Figure 39: Comparison of 2nd
page of datasheet with SynBIS plate reader results
Figure 40: Comparison of 3rd
page of datasheet with SynBIS flow cytometry results
37. Gan Chong Yee BEng Bioengineering Final Year Report, 2015
CID: 00701519
37 | P a g e
Figure 41: Comparison of 4th
page of datasheet with SynBIS Metadata 1.
Figure 42: Comparison of 5th
page of datasheet with SynBIS Metadata 2
38. Gan Chong Yee BEng Bioengineering Final Year Report, 2015
CID: 00701519
38 | P a g e
As can be seen from Figures 38 – 42, the generated PDF matched the data obtained from
SynBIS. However, special attention must be brought to the flow cytometry curves in Figure
40.
Despite sharing the same trend line, the x- axis of each curve was vastly different from the
other. The generated datasheet had x- values from 0 to 10, whilst those of SynBIS database
were from 0 to 10,000.
This was due to the fact that the x-axis of the SynBIS data employed a “logicle” scale to
display its values, as this scale proved to better display the region of interest in a flow
cytometry test (Parks et. al, 2006).
Whilst the x – values were integrated into logicle scale in the restClient code for PDF
generation, as shown in Figure 43, challenges were faced when creating a suitable chart to
accommodate these changes. This was due to the fact that Jaspersoft Studio charts divided
their axes into fixed intervals, thus creating a graph that was distorted in shape. This can be
seen in Figure 44.
Figure 43: RestClient code to implement logicle scale for datasheet generation
39. Gan Chong Yee BEng Bioengineering Final Year Report, 2015
CID: 00701519
39 | P a g e
Figure 44: Flow cytometer curve using logicle scale.
Using Jaspersoft Studio, a new chart theme was created in an attempt to convert the x axis
into the appropriate logicle scale as well. However, due to software limitations, this specific
customization could not be implemented as this function was only available in the
professional edition of Jaspersoft Studio. The chart theme allowed the user to change a
40. Gan Chong Yee BEng Bioengineering Final Year Report, 2015
CID: 00701519
40 | P a g e
graph’s axis interval and range, but only under the condition that the axis interval remains
constant throughout each iteration. Thus, an incremental axis interval, as in the logicle scale,
could not be implemented. The usage of Chart Customizer classes to customize JFreeCharts
was promising, but could not be completed in the scope of this project due to time
constraints and certain technical difficulties.
Figure 45: Utilising chart themes to change the properties of Jaspersoft Studio graphs
41. Gan Chong Yee BEng Bioengineering Final Year Report, 2015
CID: 00701519
41 | P a g e
4.2 Web Service for Datasheet Generation
The web service was called with the following URL
http://localhost:13614/HelloWorldApplication/rest/myservice/1/file/datasheet
The service managed to fetch data from a SynBIS biological part of ID 1 and to
generate a corresponding datasheet with the file name “datasheet”.
Figure 46: Datasheet file was downloaded when the web service was called
The generated datasheet looked the same as those produced in Chapter 5.1.
42. Gan Chong Yee BEng Bioengineering Final Year Report, 2015
CID: 00701519
42 | P a g e
4.3 SBML Generation
The resulting SBML file was imported by iBiosim, a CAD tool for genetic circuits,
in order to run simulations and analysis on the models.
Figure 48: Lab results obtained from SynBIS database
As seen in Figure 37 and Figure 48, the simulation results generated by the SBML file
matched those obtained from SynBIS.
Whilst converting a biological reaction into a mathematical model, certain considerations
were taken to adjust the SBML models according to the needs of the synthetic biology
community. For instance, a lag time was introduced into the logistic model as the starting
point of exponential growth is of special interests for researchers when analysing a model.
Without the lag time, the graph would display higher value at time zero, and thus valuable
information about the start of exponential cell growth would be lost.
Other considerations include modelling the reaction at the region of interest during mid
exponential growth. The plateau of a particular graph would be less significant in biological
circuit analysis, thus the time scale and parameters of the reaction was chosen ( as shown in
Chapter3.3.2) to display these regions of interest.
43. Gan Chong Yee BEng Bioengineering Final Year Report, 2015
CID: 00701519
43 | P a g e
4.4 Custom Datasheet Generation
The resulting datasheet for the biological part, J23101 was shown in the figures below. The
same results were produced for each subsequent biological parts, J23106, J23108, J23111
and J23119. However, slight variations in their DNA sequence and plate reader results were
made accordingly, as seen in Appendix D.
The customizability of the PDF generation software displays its versatility in accommodating
the rapidly changing needs of synthetic biology, in terms of measurement methods,
standardisation and protocols. (Wolf & Arkin, 2003). Such functions were made possible by
the modularity of each elements used in designing the PDF generation software.
Figure 49: 1st
page of custom datasheet for J23101
44. Gan Chong Yee BEng Bioengineering Final Year Report, 2015
CID: 00701519
44 | P a g e
Figure 50: 2nd
page of custom datasheet for J23101
45. Gan Chong Yee BEng Bioengineering Final Year Report, 2015
CID: 00701519
45 | P a g e
Figure 51: 3rd
page of custom datasheet for J23101
46. Gan Chong Yee BEng Bioengineering Final Year Report, 2015
CID: 00701519
46 | P a g e
Chapter 5: Future Work
This short section will illustrate further improvements that can be covered for each of the
tasks performed throughout this project. These include Datasheet Generation and Web
Services (Chapter 6.1), SBML Generation (Chapter 6.2) and Custom Datasheet Generation
(Chapter 6.3)
5.1 Datasheet Generation and Web Services
Apart from debugging issues with the graphs, the datasheet generation software poses a
potential to be better integrated into the end user as a plug in for synthetic biology software
tools. These will include Java extensions on prevalent synthetic biology CAD tools such as
iBiosim, GenoCAD and Clotho (Gan, 2014). These additional features would, improve the
user experience of designers and researchers, thus further encouraging the synthetic
community to utilise the SynBIS database. This would not only compound the dissemination
efforts of the studies done by CSynBI to promote collaboration in standardisation efforts,
but also enable CSynBI to gain refine and improve their biological part data and
standardisation protocolsbased on the user feedback provided by the end users.
5.2 SBML Generation
Using libSBML or other SBML toolboxes, the synbis.m (Appendix C.1) file produced
throughout the course of this project can be adapted into other prevalent tools in the
market. This can be done by altering the code to different languages, such as R, Python and
C++. Such efforts would greatly benefit the standardisation and dissemination efforts done
by CSynBI, for the reasons mentioned in Chapter 6.1.
5.3 Custom Datasheet Generation
With further effort, this functionality could be improved by introducing dynamic parameters
and graphs as in the PDF Generation (Chapter 3.1). Also, a similar web service utilised by
SynBIS web API, which exports and store the datasheet information as an xml online, could
also be adopted for other experimental studies, such as those performed by (DORY). Such
features would enable better analysis and curation of data, and would be especially useful
during the dissemination process. With this web service, the formulation of a PDF
generation web service and SBML production, as were done in Chapter 3.2 and 3.3, can be
carried out for a variety of experimental studies.
47. Gan Chong Yee BEng Bioengineering Final Year Report, 2015
CID: 00701519
47 | P a g e
Chapter 6: Conclusions
As shown in Chapter 4, the software developed throughout this project has displayed
reproducible and positive results in terms of exporting the biological part characterisation
data into various human and machine readable formats. In turn, the modular nature of the
end product enables these data to be altered and displayed in different structures according
to the context and needs of a particular experimental study. This feature holds significant
value in the context of synthetic biology, as the relatively new field is subject to rapid
changes in experimental measurements, software tools and characterisation standards.
In the wider context of synthetic biology, the project will aid CSynBI in its efforts to
disseminate standardised characterisation information from SynBIS to the wider scientific
community. In contrast to other biological part databases, such as the SBPkb, CSynBI aims to
push the study of standardisation forward by employing set methods of experimental
protocol, curation, measurement and overall display of the results in a datasheet. This
particular initiative is crucial in synthetic biology as there is limited theory on the minimal
amount of information that should be displayed in a datasheet, unlike other conventional
engineering components.
Employing engineering methods to better predict, measure and reproduce biological
innovations calls for a better understanding of the smaller components which make up the
final product. These building blocks, the biological parts, should be characterised in a
standardised manner to encourage a concerted effort within the scientific community to
define and model each biological part, so that the wider biological system can be
understood. As the datasheet acts as a medium for such information exchange, the
streamlined dissemination of data supported by this project will compound the
standardisation effort employed by CSynBI.
However, despite these achievements, there is still space for much improvement in the
context of dissemination of SynBIS data, as outlined in Chapter 5. Further refinements and
enhancements are necessary in the final product contrived throughout the timeline of this
project, and more integrative and strategic developments should be made to bridge the gap
amongst researchers and designers alike, and to reduce the friction between the SynBIS
database and the end users. It is with hope that continual efforts be made to better
characterise and standardise biological parts, such that a deeper understanding in biological
processes and engineering science can be obtained.
48. Gan Chong Yee BEng Bioengineering Final Year Report, 2015
CID: 00701519
48 | P a g e
Bibliography
1. Wolf, D.M. & Arkin, A.P. Curr. Opin. Microbiol. 6, 125–134 (2003).
2. Galdzicki, M., Rodriguez, C., Chandran, D., Sauro, H. M., & Gennari, J. H. (2011).
Standard biological parts knowledgebase. PloS one, 6(2), e17005.
3. Arkin, A. (2008). Setting the standard in synthetic biology. Nature biotechnology,
26(7), 771-773.
4. Canton, B., Labno, A., & Endy, D. (2008). Refinement and standardization of synthetic
biological parts and devices. Nature biotechnology, 26(7), 787-793.
5. Lee, T. S., Krupa, R. A., Zhang, F., Hajimorad, M., Holtz, W. J., Prasad, N., ... & Keasling,
J. D. (2011). BglBrick vectors and datasheets: a synthetic biology platform for gene
expression. Journal of biological engineering, 5(1), 1-14.
6. Kong, Deze (2015). In vitro characterisation of constitutive promoters in E.
coli extract through a combination of modelling and experimental approaches
7. Oracles Java Documentation. (2014). Building RESTful Web Services with JAX-RS.
[Online] Available from: (http://docs.oracle.com/javaee/7/tutorial/jaxrs.htm#GIEPU)
[Accessed 3rd
June 2015]
8. JasperReports Library. [Online]. Available from:
http://community.jaspersoft.com/project/jasperreports-library [Accessed 13th June
2015)
9. Csete, M. E., & Doyle, J. C. (2002). Reverse engineering of biological
complexity. science, 295(5560), 1664-1669.
10. Keating, S. M., & Le Novere, N. (2013). Supporting SBML as a model exchange format
in software applications. In In Silico Systems Biology (pp. 201-225). Humana Press.
11. Sharma, N., & Gobbert, M. K. (2010). A comparative evaluation of Matlab, Octave,
FreeMat, and Scilab for research and teaching. Department of Mathematics and
Statistics.
12. The Systems Biology Markup Language. (2011) SBML Toolbox 4.0 API. [Online].
Available from:
http://sbml.org/Software/SBMLToolbox/SBMLToolbox_4.0_API_Manual [Accessed
13th June 2015]
13. Parks, D. R., Roederer, M., & Moore, W. A. (2006). A new “Logicle” display method
avoids deceptive effects of logarithmic scaling for low signals and compensated
data. Cytometry Part A, 69(6), 541-551.
14. Oracle Java Documentation. (2014) Java Platform, Entreprise Edition: The Java EE
Tutorial- Required Software. [Online] Available from:
http://docs.oracle.com/javaee/7/tutorial/usingexamples001.htm#GEXAJ [Accessed
14th
June 2015]
15. Myres Research Group. iBioSim [Online] Avalaible from:
http://www.async.ece.utah.edu/iBioSim/ [Accessed 13th
June 2015]
16. The Systems Biology Markup Language. (2012) Basic Introduction to SBML. [Online]
Available from: http://sbml.org/Basic_Introduction_to_SBML [Accessed 11th June
2015]
49. Gan Chong Yee BEng Bioengineering Final Year Report, 2015
CID: 00701519
49 | P a g e
17. The Systems Biology Markup Language. (2012) More Detailed Summary of SBML.
[Online] Available from: http://sbml.org/More_Detailed_Summary_of_SBML
[Accessed 11th June 2015]
18. Oracle Java Documentation. (2014) Java Platform, Entreprise Edition: The Java EE
Tutorial- Overview of the Client API. [Online] Available from:
http://docs.oracle.com/javaee/7/tutorial/jaxrs-client.htm [Accessed 14th
June 2015]
19. Jaspersoft Community. (2015) TIBCO Jaspersoft Studio User Guide. [Online] Available
from: http://community.jaspersoft.com/documentation/tibco-jaspersoft-studio-
user-guide/v610/getting-started-jaspersoft-studio [Accessed 3rd June 2015]
20. Conover, Craig and Sum Marina. (2006) Integrating and Using JasperReports in
NetBeans. [Online] Available from:
http://www.oracle.com/technetwork/java/jasper-reports-138777.html [Accessed on
10th June 2015]
21. Jaspersoft Community. (2015) Designing a Report with Jaspersoft Studio. [Online]
Available from: http://community.jaspersoft.com/wiki/designing-report-jaspersoft-
studio [Accessed on 5th June 2015]
22. Jaspersoft Community. (2015) Creating Charts and Datasets with Jaspersoft Studio.
[Online] Available from: http://community.jaspersoft.com/wiki/creating-charts-and-
datasets-jaspersoft-studio [Accessed on 5th June 2015]
23. Jaspersoft Community. (2015) Designing a Report. [Online] Available from:
http://community.jaspersoft.com/wiki/designing-report [Accessed 4th June 2015]
24. Jaspersoft Community.(2015) How to Create and Use JrDatasource Adapter. [Online]
Available from: http://community.jaspersoft.com/wiki/how-create-and-use-
jrdatasource-adapter [Accessed 3rd June 2015]
25. Jaspersoft Community.(2015) How to Create and Use JrDatasourceProvider Adapter
[Online] Available from: http://community.jaspersoft.com/wiki/how-create-and-use-
jrdatasourceprovider-adapter [Accessed 3rd June 2015]
26. Bornstein, B. J., Keating, S. M., Jouraku, A., and Hucka, M. (2008) LibSBML: An API
Library for SBML. Bioinformatics, 24(6): 880-881.
27. Carlisle, D., Ion, P. & Miner, R. (ed.) (2014) Mathematical Markup Language
(MathML) Version 3.0 2nd
Version. [Online] Available from:
http://www.w3.org/TR/MathML3/mathml.pdf. [Accessed 5th June 2015]
28. Gan, C. (2015) Interim Report. Imperial College London, December 2014.
50. Gan Chong Yee BEng Bioengineering Final Year Report, 2015
CID: 00701519
50 | P a g e
Appendices
Appendix A – PDF Generation
1. restClient source code for PDF generation
package restclient;
import java.io.ByteArrayOutputStream;
import java.io.FileNotFoundException;
import java.io.FileOutputStream;
import java.io.IOException;
import java.io.OutputStream;
import java.util.ArrayList;
import java.util.HashMap;
import java.util.Iterator;
import java.util.List;
import java.util.Map;
import javax.ws.rs.client.Client;
import javax.ws.rs.client.ClientBuilder;
import javax.ws.rs.client.Invocation;
import javax.ws.rs.client.WebTarget;
import javax.ws.rs.core.MediaType;
import net.sf.jasperreports.engine.JREmptyDataSource;
import net.sf.jasperreports.engine.JRException;
import net.sf.jasperreports.engine.JRExporterParameter;
import net.sf.jasperreports.engine.JasperCompileManager;
import net.sf.jasperreports.engine.JasperExportManager;
import net.sf.jasperreports.engine.JasperFillManager;
import net.sf.jasperreports.engine.JasperPrint;
import net.sf.jasperreports.engine.JasperReport;
import net.sf.jasperreports.engine.data.JRBeanCollectionDataSource;
import net.sf.jasperreports.engine.export.JRPdfExporter;
import net.sf.jasperreports.engine.export.JRPdfExporterParameter;
import net.sf.jasperreports.view.JasperViewer;
import synbis.external.dbschema.masterdata.Ingredients;
import synbis.external.dbschema.masterdata.Promoter;
import synbis.external.dbschema.processeddata.DataSheet;
import synbis.external.dbschema.processeddata.PlateReaderPlot;
import synbis.external.dbschema.processeddata.PlateReaderResults;
import synbis.external.dbschema.processeddata.PlotPoint;
51. Gan Chong Yee BEng Bioengineering Final Year Report, 2015
CID: 00701519
51 | P a g e
public class RestClient {
public static void main(String[] args) throws JRException, FileNotFoundException,
IOException {
runSynbisDatasheet(1);
}
public static void runSynbisDatasheet(int id) throws FileNotFoundException,
IOException{
//Fetching synBIS data and passing into datasheet structure
Client client = ClientBuilder.newClient();
WebTarget target =
client.target("http://synbis.bg.ic.ac.uk/webapi/rest/datasheet/" + id);
Invocation.Builder bu = target.request(MediaType.APPLICATION_XML);
DataSheet ds = bu.get(DataSheet.class);
//Filling in Parameters
String assayAerobic = "Not Aerobic", assayO2 = null, assayShaking = "not
shaking", cultureAerobic = "Not Aerobic", cultureShaking = "not shaking",
outgrowthAerobic = "Not Aerobic", outgrowthShaking = "not shaking",
flowCytometerGated = "Not Gated";
if (ds.getExperimentalProtocol().getAssay().isAerobic() == true){
assayAerobic = "Aerobic";
assayO2 = "O2";
}
if (ds.getExperimentalProtocol().getAssay().isShaking() == true){
assayShaking = "shaking";
}
if (ds.getExperimentalProtocol().getCulture().isAerobic() == true){
cultureAerobic = "Aerobic";
}
if (ds.getExperimentalProtocol().getCulture().isShaking() == true){
cultureShaking = "shaking";
}
if (ds.getExperimentalProtocol().getOutgrowth().isAerobic() == true){
outgrowthAerobic = "Aerobic";
}
if (ds.getExperimentalProtocol().getOutgrowth().isShaking() == true){
52. Gan Chong Yee BEng Bioengineering Final Year Report, 2015
CID: 00701519
52 | P a g e
outgrowthShaking = "shaking";
}
if (ds.getExperimentalProtocol().getPlateReader().isShaking() == false){
ds.getExperimentalProtocol().getPlateReader().setShakingInt("None");
}
if (ds.getExperimentalProtocol().getFlowCytometer().isGated() == true){
flowCytometerGated = "Gated";
}
String [] con = new String[5];
String [] name = new String[5];
String [] unit = new String[5];
int i = 0;
for (Iterator iter =
ds.getExperimentalProtocol().getAssay().getMedium().getIngredients().iterator();
iter.hasNext();) {
Ingredients ingredient = (Ingredients)iter.next();
con [i] = ingredient.getConcentration();
name [i] = ingredient.getName();
unit [i] = ingredient.getUnit();
i++;
}
Map<String, Object> params = new HashMap<String, Object>();
params.put("ingredientNameCarb", name[0]);
params.put("ingredientConcCarb", con[0]);
params.put("ingredientConcCarbUnit", unit[0]);
params.put("ingredientNameNit", name[1]);
params.put("ingredientNameNuc", name[2]);
params.put("ingredientConcNuc", con[2]);
params.put("ingredientConcNucUnit", unit[2]);
params.put("ingredientNameSupp", name[3]);
params.put("ingredientNameBase", name[4]);
params.put("bioPartName", ds.getBiopart().getName());
params.put("bioPartSequence", ds.getBiopart().getSequence());
params.put("chasisSpecies",
ds.getExperimentalProtocol().getChassis().getSpecies());
params.put("chasisStrain",
ds.getExperimentalProtocol().getChassis().getStrain());
params.put("replicationOri",
ds.getExperimentalProtocol().getVector().getReplicationOri());
params.put("reporterName",
ds.getExperimentalProtocol().getReporter().getName());
53. Gan Chong Yee BEng Bioengineering Final Year Report, 2015
CID: 00701519
53 | P a g e
params.put("reporterVariant",
ds.getExperimentalProtocol().getReporter().getVariant());
params.put("chasisOrigin",
ds.getExperimentalProtocol().getChassis().getOrigin());
params.put("rnapSpecies", ((Promoter)ds.getBiopart()).getRnapSpecies());
params.put("rnapSigmaFactor",
((Promoter)ds.getBiopart()).getRnapSigmaFactor());
params.put("cultureSource",
ds.getExperimentalProtocol().getCulture().getSource());
params.put("cultureVolume",
ds.getExperimentalProtocol().getCulture().getVolume());
params.put("cultureVolumeUnits",
ds.getExperimentalProtocol().getCulture().getVolumeUnit());
params.put("cultureVesselType",
ds.getExperimentalProtocol().getCulture().getVesselType());
params.put("cultureVesselBrand",
ds.getExperimentalProtocol().getCulture().getVesselBrand());
params.put("cultureVesselModel",
ds.getExperimentalProtocol().getCulture().getVesselModel());
params.put("cultureDuration",
ds.getExperimentalProtocol().getCulture().getDuration());
params.put("cultureDurationUnits",
ds.getExperimentalProtocol().getCulture().getDurationUnits());
params.put("cultureMediumName",
ds.getExperimentalProtocol().getCulture().getMedium().getName());
params.put("cultureTemperature",
ds.getExperimentalProtocol().getCulture().getTemperature());
params.put("cultureTemperatureUnits",
ds.getExperimentalProtocol().getCulture().getTemperatureUnit());
params.put("cultureShakingSpeed",
ds.getExperimentalProtocol().getCulture().getShakingSpeed());
params.put("cultureShakingUnits",
ds.getExperimentalProtocol().getCulture().getShakingUnit());
params.put("cultureIncubatorBrand",
ds.getExperimentalProtocol().getCulture().getIncubatorBrand());
params.put("cultureIncubatorModel",
ds.getExperimentalProtocol().getCulture().getIncubatorModel());
params.put("outgrowthDilution",
ds.getExperimentalProtocol().getOutgrowth().getDilutionTo());
params.put("outgrowthDilutionUnits",
ds.getExperimentalProtocol().getOutgrowth().getDilutionToUnit());
54. Gan Chong Yee BEng Bioengineering Final Year Report, 2015
CID: 00701519
54 | P a g e
params.put("outgrowthVolume",
ds.getExperimentalProtocol().getOutgrowth().getVolume());
params.put("outgrowthVolumeUnits",
ds.getExperimentalProtocol().getOutgrowth().getVolumeUnit());
params.put("outgrowthVesselType",
ds.getExperimentalProtocol().getOutgrowth().getVesselType());
params.put("outgrowthVesselBrand",
ds.getExperimentalProtocol().getOutgrowth().getVesselBrand());
params.put("outgrowthVesselModel",
ds.getExperimentalProtocol().getOutgrowth().getVesselModel());
params.put("outgrowthDuration",
ds.getExperimentalProtocol().getOutgrowth().getDuration());
params.put("outgrowthDurationUnits",
ds.getExperimentalProtocol().getOutgrowth().getDurationUnit());
params.put("outgrowthMediumName",
ds.getExperimentalProtocol().getOutgrowth().getMedium().getName());
params.put("outgrowthTemperature",
ds.getExperimentalProtocol().getOutgrowth().getTemperature());
params.put("outgrowthTemperatureUnits",
ds.getExperimentalProtocol().getOutgrowth().getTemperatureUnit());
params.put("outgrowthShakingSpeed",
ds.getExperimentalProtocol().getOutgrowth().getShakingSpeed());
params.put("outgrowthShakingUnits",
ds.getExperimentalProtocol().getOutgrowth().getShakingUnit());
params.put("outgrowthIncubatorBrand",
ds.getExperimentalProtocol().getOutgrowth().getIncubatorBrand());
params.put("outgrowthIncubatorModel",
ds.getExperimentalProtocol().getOutgrowth().getIncubatorModel());
params.put("assayDilution",
ds.getExperimentalProtocol().getAssay().getDilutionTo());
params.put("assayDilutionUnits",
ds.getExperimentalProtocol().getAssay().getDilutionToUnit());
params.put("assayVolume",
ds.getExperimentalProtocol().getAssay().getVolume());
params.put("assayVolumeUnits",
ds.getExperimentalProtocol().getAssay().getVolumeUnit());
params.put("assayVesselType",
ds.getExperimentalProtocol().getAssay().getVesselType());
params.put("assayVesselBrand",
ds.getExperimentalProtocol().getAssay().getVesselBrand());
55. Gan Chong Yee BEng Bioengineering Final Year Report, 2015
CID: 00701519
55 | P a g e
params.put("assayVesselModel",
ds.getExperimentalProtocol().getAssay().getVesselModel());
params.put("assayDuration",
ds.getExperimentalProtocol().getAssay().getDuration());
params.put("assayDurationUnits",
ds.getExperimentalProtocol().getAssay().getDurationUnit());
params.put("assayMediumName",
ds.getExperimentalProtocol().getAssay().getMedium().getName());
params.put("assayTemperature",
ds.getExperimentalProtocol().getAssay().getTemperature());
params.put("assayTemperatureUnits",
ds.getExperimentalProtocol().getAssay().getTemperatureUnits());
params.put("assayShakingSpeed",
ds.getExperimentalProtocol().getAssay().getShakingSpeed());
params.put("assayShakingUnits",
ds.getExperimentalProtocol().getAssay().getShakingSpeedUnit());
params.put("assayIncubatorBrand",
ds.getExperimentalProtocol().getAssay().getIncubatorBrand());
params.put("assayIncubatorModel",
ds.getExperimentalProtocol().getAssay().getIncubatorModel());
params.put("assayMeasTimeIntervals",
ds.getExperimentalProtocol().getAssay().getMeasTimeIntervals());
params.put("assayMeasTimeIntervalsUnits",
ds.getExperimentalProtocol().getAssay().getMeasTimeInvervalsUnit());
params.put("assayRepeatsPlate",
ds.getExperimentalProtocol().getAssay().getRepeatsPlate());
params.put("assayDayRepeats",
ds.getExperimentalProtocol().getAssay().getDayRepeats());
params.put("mediumName",
ds.getExperimentalProtocol().getMedium().getName());
params.put("mediumSupplier",
ds.getExperimentalProtocol().getMedium().getSupplier());
params.put("mediumReference",
ds.getExperimentalProtocol().getMedium().getReference());
params.put("outgrowthAntibiotic",
ds.getExperimentalProtocol().getOutgrowth().getAntibiotic());
params.put("outgrowthAntibioticCon",
ds.getExperimentalProtocol().getOutgrowth().getAntibioticCon());
params.put("outgrowthAntibioticConUnits",
ds.getExperimentalProtocol().getOutgrowth().getAntibioticConUnit());
56. Gan Chong Yee BEng Bioengineering Final Year Report, 2015
CID: 00701519
56 | P a g e
params.put("plateReaderBrand",
ds.getExperimentalProtocol().getPlateReader().getBrand());
params.put("plateReaderModel",
ds.getExperimentalProtocol().getPlateReader().getModel());
params.put("plateReaderChannel",
ds.getExperimentalProtocol().getPlateReader().getChannels());
params.put("plateReaderOdWavelength",
ds.getExperimentalProtocol().getPlateReader().getOdWavelength());
params.put("plateReaderOdWavelengthUnits",
ds.getExperimentalProtocol().getPlateReader().getOdWavelengthUnit());
params.put("plateReaderExcitationWavelength",
ds.getExperimentalProtocol().getPlateReader().getExcitationWavelength());
params.put("plateReaderExcitationWavelengthUnits",
ds.getExperimentalProtocol().getPlateReader().getExcitationWavelengthUnit());
params.put("plateReaderEmissionWavelength",
ds.getExperimentalProtocol().getPlateReader().getEmissionWavelength());
params.put("plateReaderEmissionWavelengthUnits",
ds.getExperimentalProtocol().getPlateReader().getEmissionWavelengthUnit());
params.put("plateReaderTemperature",
ds.getExperimentalProtocol().getPlateReader().getTemperature());
params.put("plateReaderTemperatureUnits",
ds.getExperimentalProtocol().getPlateReader().getTemperatureUnit());
params.put("plateReaderShakingInt",
ds.getExperimentalProtocol().getPlateReader().getShakingInt());
params.put("flowCytometerBrand",
ds.getExperimentalProtocol().getFlowCytometer().getBrand());
params.put("flowCytometerModel",
ds.getExperimentalProtocol().getFlowCytometer().getModel());
params.put("flowCytometerExcitationLaser",
ds.getExperimentalProtocol().getFlowCytometer().getExcitationLaser());
params.put("flowCytometerChannels",
ds.getExperimentalProtocol().getFlowCytometer().getChannels());
params.put("flowCytometerEventNrThreshold",
ds.getExperimentalProtocol().getFlowCytometer().getEventNrThreshold());
params.put("flowCytometerCollectionStopTime",
ds.getExperimentalProtocol().getFlowCytometer().getCollectionStopTime());
params.put("flowCytometerCollectionStopTimeUnits",
ds.getExperimentalProtocol().getFlowCytometer().getCollectionStopTimeUnit());
params.put("flowCytometerVesselModel",
ds.getExperimentalProtocol().getFlowCytometer().getVesselModel());
58. Gan Chong Yee BEng Bioengineering Final Year Report, 2015
CID: 00701519
58 | P a g e
JasperPrint jasperPrint3 = JasperFillManager.fillReport(jasperReport3, params,
new JRBeanCollectionDataSource(Charts.CalculateChart.synbisData()));
JasperPrint jasperPrint4 = JasperFillManager.fillReport(jasperReport4, params,
new JREmptyDataSource());
List<JasperPrint> jasperPrintList = new ArrayList<JasperPrint>();
jasperPrintList.add(jasperPrint1);
jasperPrintList.add(jasperPrint2);
jasperPrintList.add(jasperPrint3);
jasperPrintList.add(jasperPrint4);
ByteArrayOutputStream baos = new ByteArrayOutputStream();
JRPdfExporter exporter = new JRPdfExporter();
//Add the list as a Parameter
exporter.setParameter(JRExporterParameter.JASPER_PRINT_LIST,
jasperPrintList);
//this will make a bookmark in the exported PDF for each of the reports
exporter.setParameter(JRPdfExporterParameter.IS_CREATING_BATCH_MODE_BOOK
MARKS, Boolean.TRUE);
exporter.setParameter(JRExporterParameter.OUTPUT_STREAM, baos);
exporter.exportReport();
//return baos.toByteArray();
OutputStream out = new FileOutputStream("Datasheet" + id + ".pdf");
out.write(baos.toByteArray());
out.close();
//generateReport(jasperPrint,plateJasperPrint,flowJasperPrint);
//JasperExportManager.exportReportToPdfFile(jasperPrint, reportDest);
//JasperViewer.viewReport(jasperPrint);
}
catch (JRException ex)
{
ex.printStackTrace();
}
client.close();
}
}
61. Gan Chong Yee BEng Bioengineering Final Year Report, 2015
CID: 00701519
61 | P a g e
}
public void setMeanFluoro(float meanFluoro) {
this.meanFluoro = meanFluoro;
}
public float getSdFluoro() {
return this.sdFluoro;
}
public void setSdFluoro(float sdFluoro) {
this.sdFluoro = sdFluoro;
}
public float getNSdFluoro() {
return this.nSdFluoro;
}
public void setNSdFluoro(float nSdFluoro) {
this.nSdFluoro = nSdFluoro;
}
public float getTsdFluoro() {
return this.tsdFluoro;
}
public void setTsdFluoro(float tsdFluoro) {
this.tsdFluoro = tsdFluoro;
}
public float getNTsdFluoro() {
return this.nTsdFluoro;
}
public void setNTsdFluoro(float nTsdFluoro) {
this.nTsdFluoro = nTsdFluoro;
}
62. Gan Chong Yee BEng Bioengineering Final Year Report, 2015
CID: 00701519
62 | P a g e
public float getXGraphFluoro() {
return this.xGraphFluoro;
}
public void setXGraphFluoro(float xGraphFluoro) {
this.xGraphFluoro = xGraphFluoro;
}
public float getMeanAbs() {
return this.meanAbs;
}
public void setMeanAbs(float meanAbs) {
this.meanAbs = meanAbs;
}
public float getSdAbs() {
return this.sdAbs;
}
public void setSdAbs(float sdAbs) {
this.sdAbs = sdAbs;
}
public float getNSdAbs() {
return this.nSdAbs;
}
public void setNSdAbs(float nSdAbs) {
this.nSdAbs = nSdAbs;
}
public float getTsdAbs() {
return this.tsdAbs;
}
public void setTsdAbs(float tsdAbs) {
this.tsdAbs = tsdAbs;
}
public float getNTsdAbs() {
63. Gan Chong Yee BEng Bioengineering Final Year Report, 2015
CID: 00701519
63 | P a g e
return this.nTsdAbs;
}
public void setNTsdAbs(float nTsdAbs) {
this.nTsdAbs = nTsdAbs;
}
public float getXFlow() {
return this.xFlow;
}
public void setXFlow(float xFlow) {
this.xFlow = xFlow;
}
public float getMeanYFlow3() {
return this.meanYFlow3;
}
public void setMeanYFlow3(float meanYFlow3) {
this.meanYFlow3 = meanYFlow3;
}
public float getSdYFlow3() {
return this.sdYFlow3;
}
public void setSdYFlow3(float sdYFlow3) {
this.sdYFlow3 = sdYFlow3;
}
public float getTsdYFlow3() {
return this.tsdYFlow3;
}
public void setTsdYFlow3(float tsdYFlow3) {
this.tsdYFlow3 = tsdYFlow3;
}
public float getMeanYFlow6() {
return this.meanYFlow6;
}
64. Gan Chong Yee BEng Bioengineering Final Year Report, 2015
CID: 00701519
64 | P a g e
public void setMeanYFlow6(float meanYFlow6) {
this.meanYFlow6 = meanYFlow6;
}
public float getSdYFlow6() {
return this.sdYFlow3;
}
public void setSdYFlow6(float sdYFlow6) {
this.sdYFlow6 = sdYFlow6;
}
public float getTsdYFlow6() {
return this.tsdYFlow6;
}
public void setTsdYFlow6(float tsdYFlow6) {
this.tsdYFlow6 = tsdYFlow6;
}
public float getRMeanYFlow3() {
return this.rMeanYFlow3;
}
public void setRMeanYFlow3(float rMeanYFlow3) {
this.rMeanYFlow3 = rMeanYFlow3;
}
public float getRSdYFlow3() {
return this.rSdYFlow3;
}
public void setRSdYFlow3(float rSdYFlow3) {
this.rSdYFlow3 = rSdYFlow3;
}
public float getRTsdYFlow3() {
return this.rTsdYFlow3;
}
65. Gan Chong Yee BEng Bioengineering Final Year Report, 2015
CID: 00701519
65 | P a g e
public void setRTsdYFlow3(float rTsdYFlow3) {
this.rTsdYFlow3 = rTsdYFlow3;
}
public float getRMeanYFlow6() {
return this.rMeanYFlow6;
}
public void setRMeanYFlow6(float rMeanYFlow6) {
this.rMeanYFlow6 = rMeanYFlow6;
}
public float getRSdYFlow6() {
return this.rSdYFlow3;
}
public void setRSdYFlow6(float rSdYFlow6) {
this.rSdYFlow6 = rSdYFlow6;
}
public float getRTsdYFlow6() {
return this.rTsdYFlow6;
}
public void setRTsdYFlow6(float rTsdYFlow6) {
this.rTsdYFlow6 = rTsdYFlow6;
}
public float getPlateSyn3() {
return this.plateSyn3;
}
public float getPlateSyn6() {
return this.plateSyn6;
}
public float getFlowSyn3() {
return this.flowSyn3;
}
public float getFlowSyn6() {
return this.flowSyn6;
66. Gan Chong Yee BEng Bioengineering Final Year Report, 2015
CID: 00701519
66 | P a g e
}
public String getBiopart() {
return this.biopart;
}
}
3. CalculateChart function to carry out statistical analysis
package Charts;
import java.util.ArrayList;
import java.util.Iterator;
import java.util.List;
import javax.ws.rs.client.Client;
import javax.ws.rs.client.ClientBuilder;
import javax.ws.rs.client.Invocation;
import javax.ws.rs.client.WebTarget;
import javax.ws.rs.core.MediaType;
import synbis.external.dbschema.processeddata.DataSheet;
import synbis.external.dbschema.processeddata.FlowCytometerCurve;
import static synbis.external.dbschema.processeddata.FlowCytometerFileTime.H3;
import static synbis.external.dbschema.processeddata.FlowCytometerFileTime.H6;
import synbis.external.dbschema.processeddata.FlowCytometerResults;
import synbis.external.dbschema.processeddata.PlateReaderResults;
import synbis.external.dbschema.processeddata.PlateReaderPlot;
import synbis.external.dbschema.processeddata.PlotPoint;
import synbis.external.dbschema.processeddata.XPoint;
import synbis.external.dbschema.processeddata.YPoint;
public class CalculateChart {
/*
public static void main(String[] args) {
ArrayList <ChartData> synbisData = synbisData();
for (ChartData chartData : synbisData){
System.out.println("n" + chartData );
67. Gan Chong Yee BEng Bioengineering Final Year Report, 2015
CID: 00701519
67 | P a g e
}
}
*/
public static ArrayList <ChartData> synbisData(){
//Accessing Synbis data
Client client = ClientBuilder.newClient();
WebTarget target =
client.target("http://synbis.bg.ic.ac.uk/webapi/rest/datasheet/1");
Invocation.Builder bu = target.request(MediaType.APPLICATION_XML_TYPE);
DataSheet ds = bu.get(DataSheet.class);
//Creating Plate Reader Curve
ArrayList<Float> meanFluoro = new ArrayList<>();
ArrayList<Float> sdFluoro = new ArrayList<>();
ArrayList<Float> nSdFluoro = new ArrayList<>();
ArrayList<Float> tsdFluoro = new ArrayList<>();
ArrayList<Float> nTsdFluoro = new ArrayList<>();
ArrayList<Float> xGraphFluoro = new ArrayList<>();
ArrayList<Float> meanAbs = new ArrayList<>();
ArrayList<Float> sdAbs = new ArrayList<>();
ArrayList<Float> nSdAbs = new ArrayList<>();
ArrayList<Float> tsdAbs = new ArrayList<>();
ArrayList<Float> nTsdAbs = new ArrayList<>();
ArrayList<Float> sizeFluoro = new ArrayList<>();
ArrayList<Float> sizeAbs = new ArrayList<>();
int plateLoop1 = 0, plateLoop2 = 0;
List<PlateReaderResults> prr = ds.getPlateReaderResults();
for (Iterator iter = prr.get(0).getPlateReaderPlot().iterator(); iter.hasNext();){
int i = 0, j = 0;
PlateReaderPlot plateReaderPlot = (PlateReaderPlot) iter.next();
//Adding Fluorescence values
if (plateReaderPlot.getType().name() == "FL" &&
plateReaderPlot.getHasValue() == true && plateReaderPlot.isLagAdjusted() == true){
68. Gan Chong Yee BEng Bioengineering Final Year Report, 2015
CID: 00701519
68 | P a g e
for (Iterator iter2 = plateReaderPlot.getPlotPoint().iterator();
iter2.hasNext();){
PlotPoint plotPoint = (PlotPoint) iter2.next();
if (meanFluoro.isEmpty() == false && plotPoint.getXValue() == 0){
plateLoop1++;
}else if (plateLoop1 == 0){
meanFluoro.add(plotPoint.getYValue());
sdFluoro.add(plotPoint.getYValue()*plotPoint.getYValue());
sizeFluoro.add((float)1);
}else{
meanFluoro.set(i, meanFluoro.get(i) + plotPoint.getYValue());
sdFluoro.set(i, sdFluoro.get(i) +
plotPoint.getYValue()*plotPoint.getYValue());
sizeFluoro.set(i, sizeFluoro.get(i) + 1);
if (plotPoint.isNA() == true){
sizeFluoro.set(i, sizeFluoro.get(i) - 1);
}
}
i++;
}
}else if(plateReaderPlot.getType().name() == "OD" &&
plateReaderPlot.getHasValue() == true && plateReaderPlot.isLagAdjusted() ==
true){ //Adding absorbance values
for (Iterator iter3 = plateReaderPlot.getPlotPoint().iterator();
iter3.hasNext();){
PlotPoint plotPoint = (PlotPoint) iter3.next();
if (meanAbs.isEmpty() == false && plotPoint.getXValue() == 0){
plateLoop2++;
}else if (plateLoop2 == 0){
meanAbs.add(plotPoint.getYValue());
sdAbs.add(plotPoint.getYValue()*plotPoint.getYValue());
sizeAbs.add((float)1);
}else{
meanAbs.set(j, meanAbs.get(j) + plotPoint.getYValue());
sdAbs.set(j, sdAbs.get(j) + plotPoint.getYValue()*plotPoint.getYValue());
sizeAbs.set(j, sizeAbs.get(j) + 1);
if (plotPoint.isNA() == true){
sizeAbs.set(j, sizeAbs.get(j) - 1);
}
}
69. Gan Chong Yee BEng Bioengineering Final Year Report, 2015
CID: 00701519
69 | P a g e
j++;
}
//Calculating x-value
for (Iterator iter4 = plateReaderPlot.getPlotPoint().iterator();
iter4.hasNext();){
PlotPoint plotPoint = (PlotPoint) iter4.next();
if (xGraphFluoro.isEmpty() == false && plotPoint.getXValue() == 0){
break;
}else{
xGraphFluoro.add(plotPoint.getXValue());
}
}
}
}
int i;
//calculating mean, standard deviation and 2 standard deviation
for (i=0; i< meanFluoro.size(); i++){
meanFluoro.set(i, meanFluoro.get(i)/sizeFluoro.get(i));
sdFluoro.set(i, (float) Math.sqrt((sdFluoro.get(i)/sizeFluoro.get(i) -
meanFluoro.get(i)* meanFluoro.get(i))));
tsdFluoro.add(meanFluoro.get(i) + 2*sdFluoro.get(i));
nSdFluoro.add(meanFluoro.get(i) - sdFluoro.get(i));
nTsdFluoro.add(meanFluoro.get(i) - 2*sdFluoro.get(i));
sdFluoro.set(i, meanFluoro.get(i)+ sdFluoro.get(i));
}
for (i=0; i< meanAbs.size(); i++){
meanAbs.set(i, meanAbs.get(i)/sizeAbs.get(i));
sdAbs.set(i, (float) Math.sqrt((sdAbs.get(i)/sizeAbs.get(i) - meanAbs.get(i)*
meanAbs.get(i))));
tsdAbs.add(meanAbs.get(i) + 2*sdAbs.get(i));
nSdAbs.add(meanAbs.get(i) - sdAbs.get(i));
nTsdAbs.add(meanAbs.get(i) - 2*sdAbs.get(i));
sdAbs.set(i, meanAbs.get(i)+ sdAbs.get(i));
}
//Creating Flow Cytometer Curve
ArrayList<Float> xFlow = new ArrayList<Float>();
70. Gan Chong Yee BEng Bioengineering Final Year Report, 2015
CID: 00701519
70 | P a g e
ArrayList<Float> meanYFlow3 = new ArrayList<Float>();
ArrayList<Float> meanYFlow6 = new ArrayList<Float>();
ArrayList<Float> sdYFlow3 = new ArrayList<Float>();
ArrayList<Float> sdYFlow6 = new ArrayList<Float>();
ArrayList<Float> tsdYFlow3 = new ArrayList<Float>();
ArrayList<Float> tsdYFlow6 = new ArrayList<Float>();
ArrayList<Float> rMeanYFlow3 = new ArrayList<Float>();
ArrayList<Float> rMeanYFlow6 = new ArrayList<Float>();
ArrayList<Float> rSdYFlow3 = new ArrayList<Float>();
ArrayList<Float> rSdYFlow6 = new ArrayList<Float>();
ArrayList<Float> rTsdYFlow3 = new ArrayList<Float>();
ArrayList<Float> rTsdYFlow6 = new ArrayList<Float>();
ArrayList<Float> sizeYFlow3 = new ArrayList<Float>();
ArrayList<Float> sizeYFlow6 = new ArrayList<Float>();
ArrayList<Float> sizeRYFlow3 = new ArrayList<Float>();
ArrayList<Float> sizeRYFlow6 = new ArrayList<Float>();
int loop1 = 0, loop2 = 0, loop3 = 0, loop4 = 0;
List<FlowCytometerResults> fcr = ds.getFlowCytometerResults();
for (Iterator iter = fcr.get(0).getFlowCytometerCurve().iterator();
iter.hasNext();){
int m = 0, n = 0, o = 0, p = 0;
FlowCytometerCurve flowCytometerCurve = (FlowCytometerCurve) iter.next();
//finding x values
if (flowCytometerCurve.getTime() == H3 &&
flowCytometerCurve.getHasValue() == true && flowCytometerCurve.isReference()
== false){
for (Iterator iter2 = flowCytometerCurve.getXScale().getXPoint().iterator();
iter2.hasNext();) {
XPoint xPoint = (XPoint) iter2.next();
if (xFlow.isEmpty() == false && xPoint.getValue() == 0){
break;
}else{
xFlow.add(xPoint.getValue());
}
}
//finding y value for 3 hours
71. Gan Chong Yee BEng Bioengineering Final Year Report, 2015
CID: 00701519
71 | P a g e
for (Iterator iter3 = flowCytometerCurve.getYPoint().iterator();
iter3.hasNext();){
YPoint yPoint = (YPoint) iter3.next();
if (meanYFlow3.isEmpty() == false && yPoint.getPosition() == 0){
loop1 ++;
}else if (loop1 == 0){
meanYFlow3.add(yPoint.getValue()); //creating initial array of y Value
with first instance of flowCytometerCurve
sdYFlow3.add(yPoint.getValue()*yPoint.getValue());
sizeYFlow3.add((float)1);
}else{
meanYFlow3.set(m, meanYFlow3.get(m) + yPoint.getValue()); //adding
subsequent y value to existing y value for subsequent flowCytometerCurves
sdYFlow3.set(m, sdYFlow3.get(m) +
yPoint.getValue()*yPoint.getValue());
sizeYFlow3.set(m, sizeYFlow3.get(m) + 1);
}
m++;
}
}
//calculating y value for 6 hours
else if (flowCytometerCurve.getTime() == H6 &&
flowCytometerCurve.getHasValue() == true && flowCytometerCurve.isReference()
== false){
for (Iterator iter4 = flowCytometerCurve.getYPoint().iterator();
iter4.hasNext();){
YPoint yPoint = (YPoint) iter4.next();
if (meanYFlow6.isEmpty() == false && yPoint.getPosition() == 0){
loop2 ++;
}else if (loop2 == 0){
meanYFlow6.add(yPoint.getValue()); //creating initial array of y Value
with first instance of flowCytometerCurve
sdYFlow6.add(yPoint.getValue()*yPoint.getValue());
sizeYFlow6.add((float)1);
}else if (loop2 >0){
meanYFlow6.set(n, yPoint.getValue() + meanYFlow6.get(n)); //adding
subsequent y value to existing y value for subsequent flowCytometerCurves
sdYFlow6.set(n, sdYFlow3.get(n) + yPoint.getValue()*yPoint.getValue());
sizeYFlow6.set(n, sizeYFlow6.get(n) + 1);
72. Gan Chong Yee BEng Bioengineering Final Year Report, 2015
CID: 00701519
72 | P a g e
}
n++;
}
}
else if (flowCytometerCurve.getTime() == H3 &&
flowCytometerCurve.getHasValue() == true && flowCytometerCurve.isReference()
== true){
for (Iterator iter5 = flowCytometerCurve.getYPoint().iterator();
iter5.hasNext();){
YPoint yPoint = (YPoint) iter5.next();
if (rMeanYFlow3.isEmpty() == false && yPoint.getPosition() == 0){
loop3 ++;
}else if (loop3 == 0){
rMeanYFlow3.add(yPoint.getValue()); //creating initial array of y Value
with first instance of flowCytometerCurve
rSdYFlow3.add(yPoint.getValue()*yPoint.getValue());
sizeRYFlow3.add((float)1);
}else if (loop3 >0){
rMeanYFlow3.set(o, yPoint.getValue() + rMeanYFlow3.get(o)); //adding
subsequent y value to existing y value for subsequent flowCytometerCurves
rSdYFlow3.set(o, sdYFlow3.get(o) +
yPoint.getValue()*yPoint.getValue());
sizeRYFlow3.set(o, sizeRYFlow3.get(o) + 1);
}
o++;
}
}
else if (flowCytometerCurve.getTime() == H6 &&
flowCytometerCurve.getHasValue() == true && flowCytometerCurve.isReference()
== true){
for (Iterator iter6 = flowCytometerCurve.getYPoint().iterator();
iter6.hasNext();){
YPoint yPoint = (YPoint) iter6.next();
if (rMeanYFlow6.isEmpty() == false && yPoint.getPosition() == 0){
loop4 ++;
}else if (loop4 == 0){
rMeanYFlow6.add(yPoint.getValue()); //creating initial array of y Value
with first instance of flowCytometerCurve
rSdYFlow6.add(yPoint.getValue()*yPoint.getValue());
73. Gan Chong Yee BEng Bioengineering Final Year Report, 2015
CID: 00701519
73 | P a g e
sizeRYFlow6.add((float)1);
}else if (loop4 >0){
rMeanYFlow6.set(p, yPoint.getValue() + rMeanYFlow6.get(p)); //adding
subsequent y value to existing y value for subsequent flowCytometerCurves
rSdYFlow6.set(p, sdYFlow6.get(p) +
yPoint.getValue()*yPoint.getValue());
sizeRYFlow6.set(p, sizeRYFlow6.get(p) + 1);
}
p++;
}
}
}
/*
for (i=0; i<xFlow.size(); i++){
xFlow.set(i, (float) (747.358* Math.exp((double) xFlow.get(i) + (double) 1.906)
- 100*Math.exp(((double)1.906-(double)xFlow.get(i)/(double)10) + 100 - 1)));
}*/
//Calculating Logicle scale for x-axis
for(i=0; i<xFlow.size(); i++){
if (xFlow.get(i)>= 0 && xFlow.get(i)<=3.325){
xFlow.set(i, (xFlow.get(i)- (float) 0.841)* (float) 4.025);
}else if (xFlow.get(i)>= 3.325 && xFlow.get(i)<=5.738){
xFlow.set(i, (xFlow.get(i)- (float) 0.841)* (float) 20.42);
}else if (xFlow.get(i)>= 5.738 && xFlow.get(i)<=8.056){
xFlow.set(i, (xFlow.get(i)- (float) 0.841)* (float) 138.6);
}else if (xFlow.get(i)>= 3.325 && xFlow.get(i)<=10.36){
xFlow.set(i, (xFlow.get(i)- (float) 0.841)* (float) 1050.53);
}
}
xFlow.set(0, (float) 1);
//calculating mean, standard deviation and 2 standard deviation
for (i=0; i< meanYFlow3.size(); i++){
meanYFlow3.set(i, meanYFlow3.get(i)/sizeYFlow3.get(i));
sdYFlow3.set(i, (float) Math.sqrt((sdYFlow3.get(i)/sizeYFlow3.get(i) -
meanYFlow3.get(i)* meanYFlow3.get(i))));
74. Gan Chong Yee BEng Bioengineering Final Year Report, 2015
CID: 00701519
74 | P a g e
tsdYFlow3.add(meanYFlow3.get(i) + 2*sdYFlow3.get(i));
sdYFlow3.set(i, meanYFlow3.get(i)+ sdYFlow3.get(i));
}
for (i=0; i< meanYFlow6.size(); i++){
meanYFlow6.set(i, meanYFlow6.get(i)/sizeYFlow6.get(i));
sdYFlow6.set(i, (float) Math.sqrt((sdYFlow6.get(i)/sizeYFlow6.get(i) -
meanYFlow6.get(i)* meanYFlow6.get(i))));
tsdYFlow6.add(meanYFlow6.get(i) + 2*sdYFlow6.get(i));
sdYFlow6.set(i, meanYFlow6.get(i)+ sdYFlow6.get(i));
}
for (i=0; i< rMeanYFlow3.size(); i++){
rMeanYFlow3.set(i, rMeanYFlow3.get(i)/sizeRYFlow3.get(i));
rSdYFlow3.set(i, (float) Math.sqrt((rSdYFlow3.get(i)/sizeRYFlow3.get(i) -
rMeanYFlow3.get(i)* rMeanYFlow3.get(i))));
rTsdYFlow3.add(rMeanYFlow3.get(i) + 2*rSdYFlow3.get(i));
rSdYFlow3.set(i, rMeanYFlow3.get(i)+ rSdYFlow3.get(i));
}
for (i=0; i< rMeanYFlow6.size(); i++){
rMeanYFlow6.set(i, rMeanYFlow6.get(i)/sizeRYFlow6.get(i));
rSdYFlow6.set(i, (float) Math.sqrt((rSdYFlow6.get(i)/sizeRYFlow6.get(i) -
rMeanYFlow6.get(i)* rMeanYFlow6.get(i))));
rTsdYFlow6.add(rMeanYFlow6.get(i) + 2*rSdYFlow6.get(i));
rSdYFlow6.set(i, rMeanYFlow6.get(i)+ rSdYFlow6.get(i));
}
//Creating RPUs
ArrayList<Float> plateSyn3 = new ArrayList<Float>();
ArrayList<Float> plateSyn6 = new ArrayList<Float>();
ArrayList<Float> flowSyn3 = new ArrayList<Float>();
ArrayList<Float> flowSyn6 = new ArrayList<Float>();
ArrayList<String> biopart = new ArrayList<String>();
ArrayList<ChartData> chartdata = new ArrayList<ChartData>();
biopart.add(ds.getExperimentalProtocol().getRefPromoter());
biopart.add(ds.getBiopart().getName());
plateSyn3.add((float)ds.getPlateReaderResults().get(0).getRefSynRate3());
plateSyn3.add((float)ds.getPlateReaderResults().get(0).getSynRate3());
plateSyn6.add((float)ds.getPlateReaderResults().get(0).getRefSynRate6());