SlideShare une entreprise Scribd logo
1  sur  13
-3.0%
-2.0%
-1.0%
0.0%
1.0%
2.0%
3.0%
4.0%
5.0%
2008 2009 2010 2011 2012 2013 2014 2015E 2016E 2017E
“Overall, global growth
is expected to rise
moderately, to 3.0 percent
in 2015, and average
about 3.3 percent through
2017 … on the back of
gradually recovering labor
markets, ebbing fiscal
consolidation, and still
low financing costs”
-The World Bank
December 20, 2015
Chris Kearns
Strategist
Key global themes and insights:
 Diverging economic policies leading to a
strong dollar and continued deflation
 Declining growth in China as they wane from
an old economic system comprised of
manufacturing to a service based economy
 Short term economic tailwinds fueling US
economic growth
 The end of the commodity super cycle
Global GDP (annual)
2008 2009 2010 2011 2012 2013 2014 2015E 2016E 2017E
1.5% -2.1% 4.1% 2.8% 2.2% 2.4% 2.5% 2.5% 3.3% 3.2%
Divergingbusiness cycles telegraph volatility to come in the next fiscal year for equity markets. Domestically,the United
States steadily moves towards and expandingeconomy as cyclical businesspick up and economic growth accelerates.Other
developed nations (i.e. Eurozone, Japan, etc.) struggleto find footing in the global business cycleand continueto see sub-
par growth indicators.Emergingmarkets are also experiencing lowgrowth in an unforgivingcommodity downturn. The
World Bank estimates suggest the opposite and support a healthy and expanding global economy going forward for 2016
with an increasein global GDP by 3.3% YoY. Figure 1 below shows the actual global GDP figures from 2008-2014 and
estimated for 2015-2017 (World Bank).In my opinion The World Bank is overestimatingthe global economy given China’s
slowdown and the end of the commodity super cycle.There is littlereason to believe that the global economy with
continue on its slowbut steady track back to healthy 3.0% growth in the near future. Overly bullish estimates likeThe
World Bank’s can lead to falseconfidenceand have a detrimental effect in the equity markets when sentiment shifts.
To further understand the causes of slowingglobal growth a further analysisof the current economic indicators is
necessary.The economic backdrop will becrucial in determiningequity valuations and industry growth trends for 2016.
Global Strategy Outlook 2016
Equity Strategy Report
Figure 1:Global GDPGrowthYoY (%)
Source: World Bank Database
Quantitative Easing
Quantitativeeasinghas created cheap borrowing costs keeping rates at all -timelows and draggingbond yields down with
it. This process has been implemented across developed countries since2009 and even earlier in Japan in hopes of curbing
the effects economic recession. In Figure2 below you can see the countries that have or are currently implementing
quantitativeeasing.The Eurozone, Sweden, China,and Japan all currently utilizequantitativeeasingwhilethe United States
has discontinued quantitativeeasing.This creates divergingeconomic policies thathavecaused a largeshareof economic
and macro trends globally,namely the rapid appreciation of the dollar againstother currencies,continual declinein yield of
Non-US government bonds (more recently), and suppressed commodity prices (due to dollar denomination).
Figure 3 belowchartsthe Iron Price Index,BrentCrude Oil,CopperPrice Index,andthe DollarIndex.Afterthe
UnitedStates cut itsquantitative easingprogramdue toimprovingjobmarkets,wage growth,andoverall
economicstability,the dollarbegantorapidlyrise againstothercurrencies. FromQ22014 to Q2 2015 the Dollar
Index rose 15.9% accordingto the Federal Reserve. Figure3showsa sharp decline incommodityprices
followingthe appreciationof the dollar.Crude oil priceshave fallenover56% since Q2 2014 fromoversupplyto
the marketbut pricesare sustainednotonlybyoversupplybuta relativelystrongdollar. Thistrendwill greatly
reduce growthof emergingmarketsthatderive alarge share of GDP fromcommodities.
0
2000
4000
6000
8000
10000
12000
0
20
40
60
80
100
120
140
160
180
200
Iron Price Index Brent Crude Oil Price Index Dollar Index Copper Price index
Source: FactSet & FRED
Figure 2:Countries Implementing Quantitative Easing
Figure 3:CommodityPrice Indices Since 2005
We can alsosee the effectof lowcommoditypricesonhighyieldspreadsasthe global energysectorhas
become riskierdue tolowerpriceswhichdirectlyaffectsrevenue andcashflow of commodityandenergybased
companies.ShowninFigure 4below,highyieldspreadsinthe UnitedStateswidenedsignificantlyinresponseto
lowerenergypriceswhile the Eurozone andEmergingmarketsremainedmore orlessthe same.GoingforwardI
expectthistrendtocontinue unlessthe underlyingfundamentalsforcrude oil change.
As expected,lowcommoditypriceshave exasperatedthe global lowinflationenvironment.Despitecentral bank
effortstostimulate inflation,inflationgrowthhasremainedlow atanaverage rate of 0.72%, 0.04%, and1.44%
for the UnitedStates,Eurozone,andChinarespectivelyonaverage forthe past12 months.Figure 5 below
showsthe steadydropin inflationrates.We canexpectthistrendtocontinue goingforwardshouldcommodity
fundamentalsremainunchangedandthe dollarremainsstrong.The UnitedStates’exportationof deflationisa
definingfactorinslowingglobal growth,butthisisdue inpart to the US economygaininggroundoverother
countriessince the GreatRecession. The goodnewsisthatalthoughthe pastyear hasbeenbelow expectations
of 2.0%, we saw an uptickcomparedto YoY (%) inflationfor2014.
0.00
2.00
4.00
6.00
8.00
10.00
12.00
14.00
16.00
18.00
20.00
US High Yield YTW Eurozone High Yield YTW Emerging Markets High Yield YTW
Figure 4:HighYield Spreads of US, Eurozone, and EmergingMarkets
Source: FactSet & Bloomberg
Figure 5:InflationRates for US, Eurozone, & China
Source: Bloomberg &FRED
-6.0
-4.0
-2.0
0.0
2.0
4.0
6.0
8.0
10.0
12.0
14.0
-4.0
-2.0
0.0
2.0
4.0
6.0
8.0
10.0
Eurozone CPI China CPI US CPI
Yieldson US, Canadian,andUK bondshave seena slightuptickatthe endof thisyear aftera generallydown
yearin 2014. GermanyhascontinueditsdownwardtrendalongwithJapan.Overall,the USshouldsee its
upwardtrendcontinue hasthe Federal Reserve hasinitiatedarate hike.Japanhassuccessfullyhitits2.0%
inflationmark,whichisamilestone forthemasJapanhas seensubparinflationfordecadesanditsdeclining
spreadon tax revenue andinterestpaymentshasadded pressure forAbenomics(Japan’squalitative easing
program) to succeed.
Trade globallycontinuestoslide inAsiaandNorthAmericanwhile the Eurozone remainsconsistentlyinthe
greenfortrade growth.Worriesabouta slowingChinahave destabilizedmarketsandworriedinvestorsinQ3 of
2015. The fact of the matteris that we have beenlivingwithaneverslowingChinafor some time nowand
investorshave beenslow toconsiderthe realityof China’sslowinggrowth. Figures 7,8 and 9 below showthe
exportgrowthforChinaand importgrowthfor the Eurozone andthe UnitedStates.Figure 7revealsthatChina’s
exportgrowthhasactuallybeennegative forover13 straightmonthsdroppingbyas muchas 21.0% monthover
month.It shouldbe nosurprise toinvestorsthatChina’sGDPgrowthwas to follow suit.
Anotherkeycomponentindeterminingthe healthof global trade isthe BalticFreightDryIndex.This indexis
oftenusedasan indicatorof future global growthor contractionthat measuresthe trade activityforlarge
merchantships.Figure 10 on the nextpage showsthe BalticIndex withmovingaverage figures.
-40
-30
-20
-10
0
10
20
30
40
-40
-30
-20
-10
0
10
20
30
40
50
60
-40
-30
-20
-10
0
10
20
30
0
1
2
3
4
5
6
7
8
9
UK Bond - 10 Year - Yield Japan Bond - 10 Year - Yield Germany Bond - 10 Year - Yield
Canada Bond - 10 Year - Yield US Bond - 10 Year - Yield
Figure 7:China QuarterlyExports
Figure 6:Government BondSpreads Globally
Source: Bloomberg
Figure 8:Eurozone Imports Figure 9:US Imports
YTD Sector Performance (MSCI World Index) - As of November, 2015
Consumer Discretionary 3.2
Consumer Staples 3.0
Energy -24.1
Financials -6.8
Health Care 3.6
Industrials -5.2
Information Technology 4.1
Materials -19.0
Telecommunication Services -2.5
Utilites -11.7
c
c
c
c
c
c
c
c
c
c
Since Q1 of 2015, the BalticFreightDryIndex hasbeenona significantdownswinghittingthe lowestlevelsin
the past 5 yearsto a level of justover477. For reference inindex wasstartedin1985 witha level of 1000. Going
forwardthisindicatesthatwe will continue tosee slowerglobal growthascontractsfor large merchantships
are longertermandrequire leadtime fornew orders.ThislookscloselytiedtoChina’sslowingexports,which
we have seendecline significantlyoverthe lastfiscal year.
Giventhe bleak macro-economicoutlookitshouldbe nosurprise equiteshave performedpoorlyinthis
environment.Figure 11belowshowsthe YTDreturnsfor the 10 GICS sectorsaccording to the MSCI WorldIndex.
Energyis the clearlaggard here withadrop in24.1% overthe pastyear mainlydue tothe crude oil price decline.
Materialsdroppednearlyasmuchby 19.0% whichisa peripheral sectortoenergythatusesmanycommodities
and inputcostsfor itsproducts.As a result,the inputcostsare cheaperbut that alsoreducesthe sellingprice.
Giventhe rise inthe dollarwhichisthe currency denominationof mostcommodities,we are leftwith
companiespayinglessforinputcostsbutdue to relative currencydeflationagainstthe dollar,material company
productsbringinginrelativelylessrevenue forproductssoldtopforeignmarkets. TechandHealthCare posted
the highestreturnsinthe global marketwithreturnsof 4.1% and 3.6% respectively.Overall,the equitymarkets
have performedpoorlysofarin 2015. Lookingtowards2016, I expectlacklustergrowthtocontinue asthe
economicsshownpreviouslypointtoalongcycle of low growthand economicstagnation.
I alsoanticipate emergingmarketstostruggle hasthe low global trade andproductionwill limitindustrial and
manufacturingindustryrevenue whichisaprimaryexportof emergingmarketeconomies.The strongdollarwill
alsodecrease the value of emergingmarketgoodsleadingtolowerpotential growth.
0
500
1000
1500
2000
2500
3000
3500
4000
4500
Baltic Freight Dry Index Baltic Freight Dry Index - 2 Mo moving avg
Baltic Freight Dry Index - 6 Mo moving avg
Figure 10:Baltic DryIndex
Source: Bloomberg
Source: Bloomberg
0.0
2.0
4.0
6.0
8.0
10.0
12.0
0
500
1000
1500
2000
2500
New Housing Starts (Left) U6 Unemployment Rate (Right)
0
1000
2000
3000
4000
5000
6000
7000
8000
9000
0.0000
200.0000
400.0000
600.0000
800.0000
1000.0000
1200.0000
Consumer Revolving Credit (Right) Net Charge Offs (Left)
2000 2001 2002 2003 2004 2005 2006 2007 2008 2009 2010 2011 2012 2013 2014
OECD 4 1.4 1.6 2.1 3.2 2.6 3.0 2.6 0.2 -3.6 0.9 1.7 1.2 1.4 1.7
UK 3.8 2.7 2.5 4.3 2.5 2.8 3.0 2.6 -0.3 -4.3 1.9 1.6 0.7 1.7 2.6
Japan 2.3 0.4 0.3 1.7 2.4 1.3 1.7 2.2 -1.0 -5.5 4.7 -0.5 1.8 1.6 -0.1
Germany 3 1.7 0 -0.7 1.2 0.7 3.7 3.3 1.1 -5.6 4.1 3.6 0.4 0.1 1.6
US 4.1 1.0 1.8 2.8 3.8 3.3 2.7 1.8 -0.3 -2.8 2.5 1.6 2.3 2.2 2.4
-8
-6
-4
-2
0
2
4
6
Source: World Bank
Figure 1: World GDP (%) Change & Estimates 2015-2017
UnitedStatesMacro Economicsat a Glance
The US has proven to be the most resilientdeveloped country sincethe Great Recession.Key economic statisticspointto
the US havingsignificanttailwinds goingforward for 2016 and it could prove to be a strong pick for equity securities
compared to other countries. Valuations remain high for domestic indices likethe S&P 500,but itmay be supported by
strong economics.
As shown above, the US remains consistently more stableand with better growth figures than other developed nations.
Going into 2016, a lot of the growth will bedependent on consumers’confidence and financial stability. Wewill explore
these growth factors and additional cyclical patterns thatcould lead to further growth down the road.
The economic cyclical patterns takingplacein the United States areencouraging. Overall unemployment is atcycle lows;
new housingstarts suggesta steadily improvinghousingmarket.Figure 14 below shows since2008 consumer debt has
slightly decreased whilebank charge-offs on debt have substantially decreased to pre-recession lows.This points to an
improved consumer balancesheet that has less exposureto defaultrisk and debt burdens.
Source: Bloomberg
Figure 12:GDPFigures for DevelopedCountries
Source: Bloomberg
0.0
1000.0
2000.0
3000.0
4000.0
5000.0
6000.0
7000.0
8000.0
9000.0
0.0
200.0
400.0
600.0
800.0
1000.0
1200.0
Consumer Revolving Credit (Right) Net Charge Offs (Left)
Figure 13:New Housing Starts Vs. Unemployment Figure 14:Consumer Debt Vs. Charge Offs
Source: Bloomberg
New construction projects haveseen considerablegrowth since2011,but when includingimprovements to existing
infrastructure,construction is down for the past5 quarters. Figure 15 below shows the YoY% growth for total new
construction put in placeversus new construction plus improvements. This implies thegrowth in new construction is
slowingand improvements have been negative for some time. The lack of new construction may leak into new housing
starts if consumer demand drops,but I expect the oppositeto take placeas other economic indicators pointto a potential
risein consumer demand, sentiment, and spending.
Increased lendingcosts is another catalystthatwill propel this trend forward (lower growth) assumingborrowingcosts rise
significantly dueto the Federal Reserve rate hike. In the figure below, the 10-yr Treasury Bond yield is plotted againstthe
Consumer PriceIndex on the right. In the latter half of 2015,the CPI hit0.0% inflation growth,which is ala rmingand well
below the desired target of 2.0-2.5%. Given the lowinflation environment and mild rate hikes, I expect rates to remain low
for all of 2016 risingby at most 150 basis points fromDecember of 2015 through December of 2016.The economy will s till
have room to rideeven with higher rates. I do not expect the higher rates to slowdown new housingstarts or construction
if consumers and business’balancesheets remain healthy through 2016.
Lower consumer credit also leaves roomfor additional spendingand will bea catalystfor economic growth going forward.
The economy in the US has been pickingup pace and I expect the CPI to continue to riseas we move into a more inflation
friendly environment. In figure16 below, the 10 Year Treasury Yield is plotted againstthe CPI.In 2015 we are much lower
than we should be, but given the tailwinds for consumers I believedemand will pick up and push the CPI back into a normal
range of 2.0-2.5%.
-30.0%
-20.0%
-10.0%
0.0%
10.0%
20.0%
30.0%
Dec-10
Mar-11
Jun-11
Sep-11
Dec-11
Mar-12
Jun-12
Sep-12
Dec-12
Mar-13
Jun-13
Sep-13
Dec-13
Mar-14
Jun-14
Sep-14
Dec-14
Mar-15
Jun-15
Sep-15
Total Construction Put in Place, SA, Mil USD - YoY%
Total Private Construction Put in Place, Residential (inc. Improvements), SA, Mil USD - YoY%
-3.0%
-2.0%
-1.0%
0.0%
1.0%
2.0%
3.0%
4.0%
5.0%
6.0%
-3.0%
-2.0%
-1.0%
0.0%
1.0%
2.0%
3.0%
4.0%
5.0%
6.0%
Dec-05
May-06
Oct-06
Mar-07
Aug-07
Jan-08
Jun-08
Nov-08
Apr-09
Sep-09
Feb-10
Jul-10
Dec-10
May-11
Oct-11
Mar-12
Aug-12
Jan-13
Jun-13
Nov-13
Apr-14
Sep-14
Feb-15
Jul-15
10-yr Treasury Bond - CPI - Right 10-yr Treasury Bond - Left CPI - Left
Figure 15:Total ConstructionVs Private Construction
Source: Bloomberg
Figure 16:10 Year TreasuryRate Vs. CPI
Source: Bloomberg
94
95
96
97
98
99
100
101
102
0.59
0.6
0.61
0.62
0.63
0.64
0.65
0.66
0.67
0.68
Consumer Free Cash Flow (Left) ConsumerConfidence (Right)
60
61
62
63
64
65
66
67
4
5
6
7
8
9
10
Civillian Unemployment Labor Force Participation
The civilian
unemployment rate
has dropped by
nearly 5% since 2009
while the labor force
participation rate
dropped by 3% over
the same period of
time. Employment
figures are not as
good as they appear.
We have seen the unemployment rate drop significantly since2008,buthas employment really improved enough to
supporta resurgence in the US economy or are consumer justmore confident and comfortabl ewith the state of the
economy? Figure 17 below suggests the decrease in unemployment is largely due to a reduction in labor forceparticipation.
This suggests that the unemployment situation has notreally changed drastically with only a net 2.0% increasein actual
employment, but the improvement we have seen could lead to wage growth and future economic expansion.
The casefor continued growth insidethe US is also supported by expanding consumer confidence that has been on the rise
sincethe 2008/2009 recession. Figure18 below charts consumer confidence and consumer free cash flowfrom 2005 Q3
until 2015 Q3. Consumer confidence is on a normalized scalewhere 100 is the startingpointfor the data set and is an
indicator of overall economic health accordingto consumers.Looking at the chart we see that consumer free cash flow
typically lags consumer confidencedue to the frequency of the data recorded. Consumers will immediately notice
additional cash flowbefore the data can speak for itself.This trend was clearly reversed in 2007 - 2008 when extreme
financial conditionsoccurred.Based on the data we can infer that consumer free cash flowis continuingto rise,which has
the potential to fuel equites with high domestic exposure and potential lead to margin or multipleexpansion in the future.
Consumer free cash flowis a definite indicator for potential future growth going forward. Other economic indicators
suggest we may see a slowingUS economy going forward if not in 2016 than in 2017 potentially,should the trends remain
intact.On the next page Figure19 shows the ISM PMI compositeindex versus the ISM Non-Manufacturingindex.
Consumer Free Cash
Flows = Personal
Disposable Income –
Financial Obligations
– Foot and Energy
Costs
A decline in energy
costs has boosted
CFCF!
Figure 17:Unemployment Vs. Labor Force Participation
Source: FRED
Figure 18:Consumer Free CashFlowVs. Consumer Confidence
Source: FRED
The PMI (PurchasingManagers Index) CompositeIndex is a comprised of five sub categories;production level, new orders
from customers, supplier delivery speed, inventory levels,and employment levels with managers ratingeach category as
“better”, “same” or “worse”. This is converted into a scalebetween 0 and 100 with higher numbers indicatinga better
purchasingindex.The business activity index measures the health of a business in a similar fashion to the PMI Index.
Overall,the PMI index has seen a sharp declinein 2014 and 2015 will the Non-Manufacturingindex has remained strong
through 2015. This indicates manufacturingsectors arestruggling(i.e.industrials/ materials),butnon-manufacturing
companies have seen conditions remain aboutthe same sincethe startof 2015. Going forward I anticipatethat added
consumer free cash flowand growing employment will ignitespendingin non-manufacturingbusiness lines and push the
Non-ManufacturingIndex up in 2016.
Despite the positiveyear for consumers in 2015,retail sales turned negative YoY for 2015.Figure 20 below outlines the
change in retail sales YoY%change from 2005 until the end of Q3 2015. We have not seen negative sales growth in the US
since2009 duringthe Great Recession.Lower automotive sales arepartly responsiblefor the decrease in retail sales
accountingfor a 0.5% drop in November and a similardrop-off in August as well. Given the stronggrowth in consumer free
cash flowand confidence, I expect retail sales to pick up in 2016 which will push consumer discretionary to be a leading
sector for returns
-15.0%
-10.0%
-5.0%
0.0%
5.0%
10.0%
15.0%
Dec-05
May-06
Oct-06
Mar-07
Aug-07
Jan-08
Jun-08
Nov-08
Apr-09
Sep-09
Feb-10
Jul-10
Dec-10
May-11
Oct-11
Mar-12
Aug-12
Jan-13
Jun-13
Nov-13
Apr-14
Sep-14
Feb-15
Jul-15
Retail Sales, Total, SA - 1 yr chg % Retail Sales, NAICS, SA - 1 yr chg %
Despite a stronger
consumer balance
sheet, retail sales
have slide to a -1.0%
growth rate according
to the North
American Industry
Classification System
30.0
35.0
40.0
45.0
50.0
55.0
60.0
65.0
70.0
30.0
35.0
40.0
45.0
50.0
55.0
60.0
65.0
ISM: PMI Composite Index ISM: Non-Manufacturing Business Activity Index
Figure 19:PMI Composite Index Vs. ISMBusiness Activity
Source: Bloomberg
Figure 20:Retail SalesYoY (%) Change
Source: Bloomberg
YTD Sector Performance (MSCI US Index) - As of November, 2015
Growth -1.9
Small Cap -3.7
Mid Cap -2.1
Large Cap 0.0
Value -2.0
Small Cap -4.5
Mid Cap -2.3
Large Cap -0.5
Small Cap -5.2
Large Cap -1.6
c
c
c
c
c
c
c
c
c
c
EquityPerformance forUS Markets
Overall equity performance for the US has been lackluster in 2015 due to the downturn in August which resulted from poor
economic outlook in China.Figure 21 below shows the various market returns for Growth and Valuestocks categorized by
market capitalization.Valuehas slightly underperformed growth with small cap signifiacntly underperforminglargecap
accordingthe MSCI US Indicies.
Since2008 we have seen a significantmultipleexpansion in US stocks. Figure 22 below illustrates thehistorical P/Eeach
quarter for the S&P 500. Current equity valuations for the S&P 500 sitat nearly 2 standard deviations fromthe average over
the past10 years.For the samplethis looks likethe current valuations areoutof line,however; over a longer time-horizon
valuations areactually closer to the long term historical averageof about 16 P/E.
The rapid increasein corporateprofits following2008/2009 alongwith lowinterest rates, and quantatativeeasingare
largely responsiblefor the continous multipleexpansion wehave seen sincethe Great Recession.As the Fed begins to hike
rates we should seea general multiplecontraction as barrowingcosts riseand bond yield become more attractive. We can
see further evidence of fundamental justification for multipleexpansion in Figures 22 and 23 on the next page that show
the steady increasein corporatemargins and consistentper sharefigures.
8.00
9.00
10.00
11.00
12.00
13.00
14.00
15.00
16.00
17.00
18.00
Mean + 1 SD -1 SD +2 SD -2 SD P/E
Source: FactSet & Bloomberg
Figure 21:S&P 500 Historical P/E Ratio
Source: FactSet
EBITDA margins haveremained consistently high comingout of 2009 hittinga high in 2014 and droppingjust4 bps in the
most recent reporting quarter (September Q3). Profitmargins arealso atcyclehighs hittingas high as 10% in 2014.Since
2009 margins havehit record highs with the exception of free cash flowmargin which has largely been reduced by
increasingcapital expenditures.
The per sharefigures show a similar story with EPS growing exponentially since2009 even more that profitmargins due
mainly to increased sharebuy backs funded through lowinterest rate loans and excess cash on the balancesheet. This
trend has waned off in 2015 amidstslowingglobal growth. The S&P 500 is largely exposeto global conditions and the
economic slowdown abroad has already startingto slowearnings growth and EPS. Going forward I expect companies with
high foreign sales to domestic sales ratiosto struggleand miss earnings in 2016.
Therefore, largecap companies with international revenue with be a definite under-performer in 2016 and I recommend
companies with lowexposure to international markets.
Dec '05 Dec '06 Dec '07 Dec '08 Dec '09 Dec '10 Dec '11 Dec '12 Dec '13 Dec '14 Sep '15
EPS (recurrent earnings) 76.28 86.21 94.77 74.35 47.18 84.30 99.56 105.28 110.07 120.59 113.40
Free Cash Flow Per Share 73.54 102.53 45.62 133.90 38.03 107.67 111.32 98.10 110.03 104.59 102.36
Sales Per Share 841.22 937.31 1,017.47 1,079.45 907.07 966.66 1,066.93 1,111.30 1,147.54 1,188.33 1,182.00
0.0
200.0
400.0
600.0
800.0
1000.0
1200.0
1400.0
0.0
20.0
40.0
60.0
80.0
100.0
120.0
140.0
160.0
Dec '05 Dec '06 Dec '07 Dec '08 Dec '09 Dec '10 Dec '11 Dec '12 Dec '13 Dec '14 Sep '15
EBITDA Margin 17.40 18.03 18.00 16.00 15.23 18.22 18.62 18.71 19.16 19.73 19.69
Net Margin 9.01 9.18 9.23 6.89 5.16 8.55 9.19 9.35 9.53 9.99 9.55
Free Cash Flow Margin 8.11 10.87 4.54 11.83 4.48 10.86 10.31 8.71 9.56 8.76 8.63
0.00
5.00
10.00
15.00
20.00
25.00
Figure 23:Historical Margins for the S&P500
Source: Bloomberg
Figure 24:Historical Per Share Figures for the S&P500
Source: Bloomberg
Figures 25 and 26 below show the S&P 500’s Debt to Assets Ratio and EBITDA to Interest Expense ratio sinceAugust 2014
until November 2015.Overall,corporatebalancesheets remain more leveraged than in 2014 with Debt to Assets risingby a
multipleof 1.1 over the data set. Over the same time frame EBITDA to Interest Expense has risen by a multipleof
approximately 0.5.Therefore, and added risk is in play for largecap companies buttheir earnings ability has keptthem
solventwith relatively strongbalancesheets.I do not expect leverage to work to the detriment of these companies in 2016,
and I believe going into 2016 with higher interest rates they will maintain healthy solvency ratios.
Outsidethe US demand has stagnated for US exports and dollar denominated goods due to the relativerisein the dollar.
This was especially detrimental to earnings in 2015.In addition,energy underperformed substantially understandably of
coursedue to the poor commodity fundamentals.In figures XXX and XXX below you can see the difference in the S&P 500’s
earnings / revenue with and without energy. Overall,earnings growth was very positivewith the energy sector removed
from the analysisata respectable6.9% YoY growth rate. Sales growth although in the red with energy is positiveas well
with a 1.9% growth rate so far in 2015.
Looking at Figure 28, the chartshows consensus estimates for earnings growth in 2016 are 8.2%. Analysts are anticipatinga
net economic tailwind fromlow oil prices and high GPD growth north of 3.0%. Also builtinto this estimate is a rebound of
oil prices back into the $60-70-dollarrangeby year end. I find these estimates to high and overly optimistic.Given the poor
growth outlooks globally and high international exposurelargestcap and mid cap companies have abroad,I believe the
market is settingitself up for under performance in 2016. In addition,there has yet to be a catalystfor oil fundamentals to
change and the most likely candidateto reduce production is the United States. Reduced production domestically will
continue to drawdown earnings and giveus similar results as 2015.
8.5
9
9.5
10
10.5
11
7.2
7.4
7.6
7.8
8
8.2
8.4
8.6
Earnings
Earnings:Ex -
Energy
Revenue
Revenue Ex -
Energy
CY 2015 -0.3% 6.9% -3.4% 1.9%
-4.0%
-2.0%
0.0%
2.0%
4.0%
6.0%
8.0%
2009 2010 2011 2012 2013 2014 2015 2016
Earnings -8.0% 38.4% 12.6% 5.3% 5.2% 5.1% -0.3% 8.2%
Sales -7.7% 9.2% 10.6% 1.8% 1.8% 3.4% -3.4% 4.5%
-20.0%
-10.0%
0.0%
10.0%
20.0%
30.0%
40.0%
50.0%
Figure 25:Debt to Assets Ratio for S&P500 Figure 26:EBITDA to Interest Expense Ratiofor S&P500
Source: Bloomberg Source: Bloomberg
Figure 27:S&P500 Earnings andSales in 2015 Figure 28:S&P500 Earnings andSales in 2009-2015
Source: FactSet Source: FactSet
The draw down earlier this year in August was in responseto negative growth prospects and poor economics comingout of
China.As shown in Figure 29 below, the VIX reacted violently when China devalued its currency and when its stock market
corrected resultingin China implementing a form of quantitativeeasingonly with equity markets instead of bonds. This
reinforces my view of reducingforeign exposure especially nowas volatility is heavily dependent on foreign markets.
Conclusions& Recommendations
Going into 2016 I estimate the US economy will see a healthy growth rate of 3.0% or more and as the Fed raises rates I
expect to see the US outpace most other developed economies. This will causethedollar to remain strongor continue to
appreciateagainstother currencies thus increasethe purchasingpower of the dollar,which may provide consumers with
tailwinds for a shortperiod of time. This is under the condition thatthe United States can maintain its growth in spiteof
slowingglobal growth if only for the short term.
A strongdollar will keep commodities in check or at low prices which will resultin a lowPPI for domestic producers.I
expect lower input costs for producers to hurt industrialsand materialsdueto inability to export because of high dollar
strength and low inputcosts. As a result,these companies will havelowsales and earnings growth in 2016 if they are
expose to foreign markets that are forced to buy in dollars.
Additionally,a strongdollar dueto divergingeconomic policies and exportingof deflation from low commodity prices has
led to weak emerging market growth, and goingforward I expect the same in 2016 unless underlyingfundamentals for
commodities change
Whilea low commodity pricedestroys valueabroad,itmay lead to net economic tailwinds domestically.As seen in the
consumer free cash flowchart,consumers should have lower overall economic expense which has the potential to driveup
confidence and spending. Companies highly exposed to domestic US markets will benefitgreatly from growing consumer
sentiment and free cash flow.Strategically itmakes most sense to invest where the money will flowfirst –mainly retail,
staples,and potentially tech.
Therefore, I recommend investingin US based mid cap companies with high domestic exposure in the Consumer
Discretionary,Consumer Staples,and Information Technology.
-1.0
-0.5
0.0
0.5
1.0
1.5
2.0
2.5
-40.0
-30.0
-20.0
-10.0
0.0
10.0
20.0
30.0
40.0
CBOE Volatility Index (VIX) Yuan : Dollar FX Rate
Figure 29:YuanDollar Exchange Rate Vs. CBOE VIX
Source: FactSet

Contenu connexe

Tendances

Economic-Outlook-97-investment-the-way-out-of-the-b-minus-economy
Economic-Outlook-97-investment-the-way-out-of-the-b-minus-economyEconomic-Outlook-97-investment-the-way-out-of-the-b-minus-economy
Economic-Outlook-97-investment-the-way-out-of-the-b-minus-economyOECD, Economics Department
 
Market Outlook- 2019
Market Outlook- 2019Market Outlook- 2019
Market Outlook- 2019Shreya Gulati
 
The US Market Overview - 2Q14 (FINAL)
The US Market Overview - 2Q14 (FINAL)The US Market Overview - 2Q14 (FINAL)
The US Market Overview - 2Q14 (FINAL)Greg Meier
 
Deloitte - Global Economic Outlook 2015
Deloitte - Global Economic Outlook 2015Deloitte - Global Economic Outlook 2015
Deloitte - Global Economic Outlook 2015SYGroup
 
clear channel swap
clear channel swapclear channel swap
clear channel swapDylan Bateh
 
Investment outlook 2022
Investment outlook 2022 Investment outlook 2022
Investment outlook 2022 LaThoa
 
How strong a comeback for inflation?
How strong a comeback for inflation?How strong a comeback for inflation?
How strong a comeback for inflation?Jurgen Vluijmans
 
Private Capital Markets Spring 2018
Private Capital Markets Spring 2018Private Capital Markets Spring 2018
Private Capital Markets Spring 2018Duff & Phelps
 
BPV Capital Market Update June 2016
BPV Capital Market Update June 2016BPV Capital Market Update June 2016
BPV Capital Market Update June 2016Ginger Wallace
 
Update October 2010
Update October 2010Update October 2010
Update October 2010Martin Leduc
 
Global Economic Prospects, January 2014
Global Economic Prospects, January 2014Global Economic Prospects, January 2014
Global Economic Prospects, January 2014WB_Research
 
OECD Global Interim Economic Outlook February 2016 presentation
OECD Global Interim Economic Outlook February 2016 presentationOECD Global Interim Economic Outlook February 2016 presentation
OECD Global Interim Economic Outlook February 2016 presentationOECD, Economics Department
 
Investment Mid year outlook by Linked Investments, Ltd
Investment Mid year outlook by Linked Investments, LtdInvestment Mid year outlook by Linked Investments, Ltd
Investment Mid year outlook by Linked Investments, LtdLinked Investments, Ltd.
 
Oecd bloomberg lse forecasting presentation london 11 february 2014
Oecd bloomberg lse forecasting presentation london 11 february 2014Oecd bloomberg lse forecasting presentation london 11 february 2014
Oecd bloomberg lse forecasting presentation london 11 february 2014OECD, Economics Department
 
Global Economy (2)
Global Economy (2)Global Economy (2)
Global Economy (2)iimsritesh
 

Tendances (19)

Economic-Outlook-97-investment-the-way-out-of-the-b-minus-economy
Economic-Outlook-97-investment-the-way-out-of-the-b-minus-economyEconomic-Outlook-97-investment-the-way-out-of-the-b-minus-economy
Economic-Outlook-97-investment-the-way-out-of-the-b-minus-economy
 
Market Outlook- 2019
Market Outlook- 2019Market Outlook- 2019
Market Outlook- 2019
 
The US Market Overview - 2Q14 (FINAL)
The US Market Overview - 2Q14 (FINAL)The US Market Overview - 2Q14 (FINAL)
The US Market Overview - 2Q14 (FINAL)
 
Interim economic outlook March 2015
Interim economic outlook March 2015Interim economic outlook March 2015
Interim economic outlook March 2015
 
Deloitte - Global Economic Outlook 2015
Deloitte - Global Economic Outlook 2015Deloitte - Global Economic Outlook 2015
Deloitte - Global Economic Outlook 2015
 
clear channel swap
clear channel swapclear channel swap
clear channel swap
 
Investment outlook 2022
Investment outlook 2022 Investment outlook 2022
Investment outlook 2022
 
How strong a comeback for inflation?
How strong a comeback for inflation?How strong a comeback for inflation?
How strong a comeback for inflation?
 
Private Capital Markets Spring 2018
Private Capital Markets Spring 2018Private Capital Markets Spring 2018
Private Capital Markets Spring 2018
 
Corbett Road Market Week: July 25, 2016
Corbett Road Market Week: July 25, 2016Corbett Road Market Week: July 25, 2016
Corbett Road Market Week: July 25, 2016
 
BPV Capital Market Update June 2016
BPV Capital Market Update June 2016BPV Capital Market Update June 2016
BPV Capital Market Update June 2016
 
Update October 2010
Update October 2010Update October 2010
Update October 2010
 
Global Economic Prospects, January 2014
Global Economic Prospects, January 2014Global Economic Prospects, January 2014
Global Economic Prospects, January 2014
 
TAP QuarterlyLetter 201603
TAP QuarterlyLetter 201603TAP QuarterlyLetter 201603
TAP QuarterlyLetter 201603
 
OECD Global Interim Economic Outlook February 2016 presentation
OECD Global Interim Economic Outlook February 2016 presentationOECD Global Interim Economic Outlook February 2016 presentation
OECD Global Interim Economic Outlook February 2016 presentation
 
Mar 10th
Mar 10thMar 10th
Mar 10th
 
Investment Mid year outlook by Linked Investments, Ltd
Investment Mid year outlook by Linked Investments, LtdInvestment Mid year outlook by Linked Investments, Ltd
Investment Mid year outlook by Linked Investments, Ltd
 
Oecd bloomberg lse forecasting presentation london 11 february 2014
Oecd bloomberg lse forecasting presentation london 11 february 2014Oecd bloomberg lse forecasting presentation london 11 february 2014
Oecd bloomberg lse forecasting presentation london 11 february 2014
 
Global Economy (2)
Global Economy (2)Global Economy (2)
Global Economy (2)
 

En vedette

Mutual Fund 1-Pager
Mutual Fund 1-PagerMutual Fund 1-Pager
Mutual Fund 1-PagerChris Kearns
 
BlackRock Mutual Fund - Fixed Income
BlackRock Mutual Fund - Fixed IncomeBlackRock Mutual Fund - Fixed Income
BlackRock Mutual Fund - Fixed IncomeChris Kearns
 
Andrew romans starting up - the challenges - startup village - 2015-06-02
Andrew romans   starting up - the challenges - startup village - 2015-06-02Andrew romans   starting up - the challenges - startup village - 2015-06-02
Andrew romans starting up - the challenges - startup village - 2015-06-02Masters of Corporate Venture Capital
 
VC Angel Investor Workshop - Silicon Valley Innovation Center - 2015-09-15
VC Angel Investor Workshop - Silicon Valley Innovation Center - 2015-09-15 VC Angel Investor Workshop - Silicon Valley Innovation Center - 2015-09-15
VC Angel Investor Workshop - Silicon Valley Innovation Center - 2015-09-15 Masters of Corporate Venture Capital
 
Internet connected ICS/SCADA/PLC
Internet connected ICS/SCADA/PLCInternet connected ICS/SCADA/PLC
Internet connected ICS/SCADA/PLCqqlan
 
Security testing in critical systems
Security testing in critical systemsSecurity testing in critical systems
Security testing in critical systemsPeter Wood
 
Industrial protocols for pentesters
Industrial protocols for pentestersIndustrial protocols for pentesters
Industrial protocols for pentestersPositive Hack Days
 
Critical Infrastructure and Security
Critical Infrastructure and SecurityCritical Infrastructure and Security
Critical Infrastructure and SecurityCan Demirel
 
PT - Siemens WinCC Flexible Security Hardening Guide
PT - Siemens WinCC Flexible Security Hardening GuidePT - Siemens WinCC Flexible Security Hardening Guide
PT - Siemens WinCC Flexible Security Hardening Guideqqlan
 
Scada Security & Penetration Testing
Scada Security & Penetration TestingScada Security & Penetration Testing
Scada Security & Penetration TestingAhmed Sherif
 
Gdz ukr literatura_parashich
Gdz ukr literatura_parashichGdz ukr literatura_parashich
Gdz ukr literatura_parashichLucky Alex
 
Gdz angliskiy pavlichenko_zoshit_2014
Gdz angliskiy pavlichenko_zoshit_2014Gdz angliskiy pavlichenko_zoshit_2014
Gdz angliskiy pavlichenko_zoshit_2014Lucky Alex
 
Gdz angliskiy nesvit_1
Gdz angliskiy nesvit_1Gdz angliskiy nesvit_1
Gdz angliskiy nesvit_1Lucky Alex
 
Gdz informatika morze_2014
Gdz informatika morze_2014Gdz informatika morze_2014
Gdz informatika morze_2014Lucky Alex
 
Introduction to Industrial Control Systems : Pentesting PLCs 101 (BlackHat Eu...
Introduction to Industrial Control Systems : Pentesting PLCs 101 (BlackHat Eu...Introduction to Industrial Control Systems : Pentesting PLCs 101 (BlackHat Eu...
Introduction to Industrial Control Systems : Pentesting PLCs 101 (BlackHat Eu...arnaudsoullie
 

En vedette (20)

Mutual Fund 1-Pager
Mutual Fund 1-PagerMutual Fund 1-Pager
Mutual Fund 1-Pager
 
Chapter 8 by the numbers in color
Chapter 8 by the numbers in colorChapter 8 by the numbers in color
Chapter 8 by the numbers in color
 
BlackRock Mutual Fund - Fixed Income
BlackRock Mutual Fund - Fixed IncomeBlackRock Mutual Fund - Fixed Income
BlackRock Mutual Fund - Fixed Income
 
Andrew Romans The Future of VC Moscow - 2015-06-04
Andrew Romans The Future of VC Moscow - 2015-06-04 Andrew Romans The Future of VC Moscow - 2015-06-04
Andrew Romans The Future of VC Moscow - 2015-06-04
 
Founders floor lifograph cvc - 45 mins
Founders floor lifograph   cvc - 45 minsFounders floor lifograph   cvc - 45 mins
Founders floor lifograph cvc - 45 mins
 
Andrew romans starting up - the challenges - startup village - 2015-06-02
Andrew romans   starting up - the challenges - startup village - 2015-06-02Andrew romans   starting up - the challenges - startup village - 2015-06-02
Andrew romans starting up - the challenges - startup village - 2015-06-02
 
Ufrate chinese accelerators 2016 08-26
Ufrate chinese accelerators 2016 08-26Ufrate chinese accelerators 2016 08-26
Ufrate chinese accelerators 2016 08-26
 
Rubicon vc startup istanbul oct 10 v2
Rubicon vc   startup istanbul oct 10 v2Rubicon vc   startup istanbul oct 10 v2
Rubicon vc startup istanbul oct 10 v2
 
VC Angel Investor Workshop - Silicon Valley Innovation Center - 2015-09-15
VC Angel Investor Workshop - Silicon Valley Innovation Center - 2015-09-15 VC Angel Investor Workshop - Silicon Valley Innovation Center - 2015-09-15
VC Angel Investor Workshop - Silicon Valley Innovation Center - 2015-09-15
 
Internet connected ICS/SCADA/PLC
Internet connected ICS/SCADA/PLCInternet connected ICS/SCADA/PLC
Internet connected ICS/SCADA/PLC
 
Security testing in critical systems
Security testing in critical systemsSecurity testing in critical systems
Security testing in critical systems
 
Industrial protocols for pentesters
Industrial protocols for pentestersIndustrial protocols for pentesters
Industrial protocols for pentesters
 
Critical Infrastructure and Security
Critical Infrastructure and SecurityCritical Infrastructure and Security
Critical Infrastructure and Security
 
PT - Siemens WinCC Flexible Security Hardening Guide
PT - Siemens WinCC Flexible Security Hardening GuidePT - Siemens WinCC Flexible Security Hardening Guide
PT - Siemens WinCC Flexible Security Hardening Guide
 
Scada Security & Penetration Testing
Scada Security & Penetration TestingScada Security & Penetration Testing
Scada Security & Penetration Testing
 
Gdz ukr literatura_parashich
Gdz ukr literatura_parashichGdz ukr literatura_parashich
Gdz ukr literatura_parashich
 
Gdz angliskiy pavlichenko_zoshit_2014
Gdz angliskiy pavlichenko_zoshit_2014Gdz angliskiy pavlichenko_zoshit_2014
Gdz angliskiy pavlichenko_zoshit_2014
 
Gdz angliskiy nesvit_1
Gdz angliskiy nesvit_1Gdz angliskiy nesvit_1
Gdz angliskiy nesvit_1
 
Gdz informatika morze_2014
Gdz informatika morze_2014Gdz informatika morze_2014
Gdz informatika morze_2014
 
Introduction to Industrial Control Systems : Pentesting PLCs 101 (BlackHat Eu...
Introduction to Industrial Control Systems : Pentesting PLCs 101 (BlackHat Eu...Introduction to Industrial Control Systems : Pentesting PLCs 101 (BlackHat Eu...
Introduction to Industrial Control Systems : Pentesting PLCs 101 (BlackHat Eu...
 

Similaire à Global Market Outlook - Equities

Will risks-derail-the-modest-recovery-oecd-interim-economic-outlook-march-2017
Will risks-derail-the-modest-recovery-oecd-interim-economic-outlook-march-2017Will risks-derail-the-modest-recovery-oecd-interim-economic-outlook-march-2017
Will risks-derail-the-modest-recovery-oecd-interim-economic-outlook-march-2017OECD, Economics Department
 
PwC Global Economy watch (mars 2014)
PwC Global Economy watch (mars 2014)PwC Global Economy watch (mars 2014)
PwC Global Economy watch (mars 2014)PwC France
 
PwC Global Economy Watch (oct. 2013)
PwC Global Economy Watch (oct. 2013)PwC Global Economy Watch (oct. 2013)
PwC Global Economy Watch (oct. 2013)PwC France
 
Accenture Spend Trends Report Q1 2015
Accenture Spend Trends Report Q1 2015Accenture Spend Trends Report Q1 2015
Accenture Spend Trends Report Q1 2015Accenture Operations
 
Accenture Spend Trends Report Q1 2015
Accenture Spend Trends Report Q1 2015Accenture Spend Trends Report Q1 2015
Accenture Spend Trends Report Q1 2015accenture
 
Short-term momentum: will it be sustained? OECD Economic Outlook presentation...
Short-term momentum: will it be sustained? OECD Economic Outlook presentation...Short-term momentum: will it be sustained? OECD Economic Outlook presentation...
Short-term momentum: will it be sustained? OECD Economic Outlook presentation...OECD, Economics Department
 
Stanford Endowment Fund - Asset Allocation
Stanford Endowment Fund - Asset AllocationStanford Endowment Fund - Asset Allocation
Stanford Endowment Fund - Asset AllocationKUN YANG
 
Global Macro Shifts_FTI
Global Macro Shifts_FTIGlobal Macro Shifts_FTI
Global Macro Shifts_FTICalvin Ho
 
The Prudent Factsheet | ICICI Prudential Mutual Fund
The Prudent Factsheet | ICICI Prudential Mutual FundThe Prudent Factsheet | ICICI Prudential Mutual Fund
The Prudent Factsheet | ICICI Prudential Mutual Fundiciciprumf
 
Swedbank's Global Economic Outlook, 2010 March 18
Swedbank's Global Economic Outlook, 2010 March 18Swedbank's Global Economic Outlook, 2010 March 18
Swedbank's Global Economic Outlook, 2010 March 18Swedbank
 
Nfais Presentation20080226 F
Nfais Presentation20080226 FNfais Presentation20080226 F
Nfais Presentation20080226 Frotciv
 
BNP PARIBAS - Investment Outlook 2023
BNP PARIBAS - Investment Outlook 2023BNP PARIBAS - Investment Outlook 2023
BNP PARIBAS - Investment Outlook 2023Investoida
 
Global Economic Update & Strategic Investment Outlook Q2 2014
Global Economic Update & Strategic Investment Outlook Q2 2014Global Economic Update & Strategic Investment Outlook Q2 2014
Global Economic Update & Strategic Investment Outlook Q2 2014Cohen and Company
 
Annual equity-outlook new-2019
Annual equity-outlook new-2019Annual equity-outlook new-2019
Annual equity-outlook new-2019abslamc
 
603fafc95abf73a62ea02cf6_e-rossi_global_24nov2015.ppt
603fafc95abf73a62ea02cf6_e-rossi_global_24nov2015.ppt603fafc95abf73a62ea02cf6_e-rossi_global_24nov2015.ppt
603fafc95abf73a62ea02cf6_e-rossi_global_24nov2015.pptdanial287696
 

Similaire à Global Market Outlook - Equities (20)

Will risks-derail-the-modest-recovery-oecd-interim-economic-outlook-march-2017
Will risks-derail-the-modest-recovery-oecd-interim-economic-outlook-march-2017Will risks-derail-the-modest-recovery-oecd-interim-economic-outlook-march-2017
Will risks-derail-the-modest-recovery-oecd-interim-economic-outlook-march-2017
 
PwC Global Economy watch (mars 2014)
PwC Global Economy watch (mars 2014)PwC Global Economy watch (mars 2014)
PwC Global Economy watch (mars 2014)
 
Economic Outlook | LIC Preneed Forum 2012
Economic Outlook  | LIC Preneed Forum 2012Economic Outlook  | LIC Preneed Forum 2012
Economic Outlook | LIC Preneed Forum 2012
 
PwC Global Economy Watch (oct. 2013)
PwC Global Economy Watch (oct. 2013)PwC Global Economy Watch (oct. 2013)
PwC Global Economy Watch (oct. 2013)
 
Accenture Spend Trends Report Q1 2015
Accenture Spend Trends Report Q1 2015Accenture Spend Trends Report Q1 2015
Accenture Spend Trends Report Q1 2015
 
Accenture Spend Trends Report Q1 2015
Accenture Spend Trends Report Q1 2015Accenture Spend Trends Report Q1 2015
Accenture Spend Trends Report Q1 2015
 
Short-term momentum: will it be sustained? OECD Economic Outlook presentation...
Short-term momentum: will it be sustained? OECD Economic Outlook presentation...Short-term momentum: will it be sustained? OECD Economic Outlook presentation...
Short-term momentum: will it be sustained? OECD Economic Outlook presentation...
 
MTBiz Jan-Feb 2019
MTBiz Jan-Feb 2019MTBiz Jan-Feb 2019
MTBiz Jan-Feb 2019
 
Stanford Endowment Fund - Asset Allocation
Stanford Endowment Fund - Asset AllocationStanford Endowment Fund - Asset Allocation
Stanford Endowment Fund - Asset Allocation
 
Global Macro Shifts_FTI
Global Macro Shifts_FTIGlobal Macro Shifts_FTI
Global Macro Shifts_FTI
 
The Prudent Factsheet | ICICI Prudential Mutual Fund
The Prudent Factsheet | ICICI Prudential Mutual FundThe Prudent Factsheet | ICICI Prudential Mutual Fund
The Prudent Factsheet | ICICI Prudential Mutual Fund
 
Company Presentation
Company PresentationCompany Presentation
Company Presentation
 
Swedbank's Global Economic Outlook, 2010 March 18
Swedbank's Global Economic Outlook, 2010 March 18Swedbank's Global Economic Outlook, 2010 March 18
Swedbank's Global Economic Outlook, 2010 March 18
 
Nfais Presentation20080226 F
Nfais Presentation20080226 FNfais Presentation20080226 F
Nfais Presentation20080226 F
 
BNP PARIBAS - Investment Outlook 2023
BNP PARIBAS - Investment Outlook 2023BNP PARIBAS - Investment Outlook 2023
BNP PARIBAS - Investment Outlook 2023
 
2015 Year End Outlook
2015 Year End Outlook2015 Year End Outlook
2015 Year End Outlook
 
Global Economic Update & Strategic Investment Outlook Q2 2014
Global Economic Update & Strategic Investment Outlook Q2 2014Global Economic Update & Strategic Investment Outlook Q2 2014
Global Economic Update & Strategic Investment Outlook Q2 2014
 
Annual equity-outlook new-2019
Annual equity-outlook new-2019Annual equity-outlook new-2019
Annual equity-outlook new-2019
 
603fafc95abf73a62ea02cf6_e-rossi_global_24nov2015.ppt
603fafc95abf73a62ea02cf6_e-rossi_global_24nov2015.ppt603fafc95abf73a62ea02cf6_e-rossi_global_24nov2015.ppt
603fafc95abf73a62ea02cf6_e-rossi_global_24nov2015.ppt
 
MTBiz September 2014
MTBiz September 2014MTBiz September 2014
MTBiz September 2014
 

Global Market Outlook - Equities

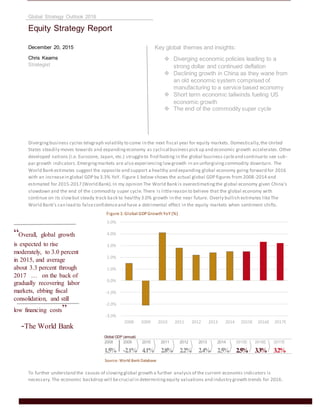
  • 1. -3.0% -2.0% -1.0% 0.0% 1.0% 2.0% 3.0% 4.0% 5.0% 2008 2009 2010 2011 2012 2013 2014 2015E 2016E 2017E “Overall, global growth is expected to rise moderately, to 3.0 percent in 2015, and average about 3.3 percent through 2017 … on the back of gradually recovering labor markets, ebbing fiscal consolidation, and still low financing costs” -The World Bank December 20, 2015 Chris Kearns Strategist Key global themes and insights:  Diverging economic policies leading to a strong dollar and continued deflation  Declining growth in China as they wane from an old economic system comprised of manufacturing to a service based economy  Short term economic tailwinds fueling US economic growth  The end of the commodity super cycle Global GDP (annual) 2008 2009 2010 2011 2012 2013 2014 2015E 2016E 2017E 1.5% -2.1% 4.1% 2.8% 2.2% 2.4% 2.5% 2.5% 3.3% 3.2% Divergingbusiness cycles telegraph volatility to come in the next fiscal year for equity markets. Domestically,the United States steadily moves towards and expandingeconomy as cyclical businesspick up and economic growth accelerates.Other developed nations (i.e. Eurozone, Japan, etc.) struggleto find footing in the global business cycleand continueto see sub- par growth indicators.Emergingmarkets are also experiencing lowgrowth in an unforgivingcommodity downturn. The World Bank estimates suggest the opposite and support a healthy and expanding global economy going forward for 2016 with an increasein global GDP by 3.3% YoY. Figure 1 below shows the actual global GDP figures from 2008-2014 and estimated for 2015-2017 (World Bank).In my opinion The World Bank is overestimatingthe global economy given China’s slowdown and the end of the commodity super cycle.There is littlereason to believe that the global economy with continue on its slowbut steady track back to healthy 3.0% growth in the near future. Overly bullish estimates likeThe World Bank’s can lead to falseconfidenceand have a detrimental effect in the equity markets when sentiment shifts. To further understand the causes of slowingglobal growth a further analysisof the current economic indicators is necessary.The economic backdrop will becrucial in determiningequity valuations and industry growth trends for 2016. Global Strategy Outlook 2016 Equity Strategy Report Figure 1:Global GDPGrowthYoY (%) Source: World Bank Database
  • 2. Quantitative Easing Quantitativeeasinghas created cheap borrowing costs keeping rates at all -timelows and draggingbond yields down with it. This process has been implemented across developed countries since2009 and even earlier in Japan in hopes of curbing the effects economic recession. In Figure2 below you can see the countries that have or are currently implementing quantitativeeasing.The Eurozone, Sweden, China,and Japan all currently utilizequantitativeeasingwhilethe United States has discontinued quantitativeeasing.This creates divergingeconomic policies thathavecaused a largeshareof economic and macro trends globally,namely the rapid appreciation of the dollar againstother currencies,continual declinein yield of Non-US government bonds (more recently), and suppressed commodity prices (due to dollar denomination). Figure 3 belowchartsthe Iron Price Index,BrentCrude Oil,CopperPrice Index,andthe DollarIndex.Afterthe UnitedStates cut itsquantitative easingprogramdue toimprovingjobmarkets,wage growth,andoverall economicstability,the dollarbegantorapidlyrise againstothercurrencies. FromQ22014 to Q2 2015 the Dollar Index rose 15.9% accordingto the Federal Reserve. Figure3showsa sharp decline incommodityprices followingthe appreciationof the dollar.Crude oil priceshave fallenover56% since Q2 2014 fromoversupplyto the marketbut pricesare sustainednotonlybyoversupplybuta relativelystrongdollar. Thistrendwill greatly reduce growthof emergingmarketsthatderive alarge share of GDP fromcommodities. 0 2000 4000 6000 8000 10000 12000 0 20 40 60 80 100 120 140 160 180 200 Iron Price Index Brent Crude Oil Price Index Dollar Index Copper Price index Source: FactSet & FRED Figure 2:Countries Implementing Quantitative Easing Figure 3:CommodityPrice Indices Since 2005
  • 3. We can alsosee the effectof lowcommoditypricesonhighyieldspreadsasthe global energysectorhas become riskierdue tolowerpriceswhichdirectlyaffectsrevenue andcashflow of commodityandenergybased companies.ShowninFigure 4below,highyieldspreadsinthe UnitedStateswidenedsignificantlyinresponseto lowerenergypriceswhile the Eurozone andEmergingmarketsremainedmore orlessthe same.GoingforwardI expectthistrendtocontinue unlessthe underlyingfundamentalsforcrude oil change. As expected,lowcommoditypriceshave exasperatedthe global lowinflationenvironment.Despitecentral bank effortstostimulate inflation,inflationgrowthhasremainedlow atanaverage rate of 0.72%, 0.04%, and1.44% for the UnitedStates,Eurozone,andChinarespectivelyonaverage forthe past12 months.Figure 5 below showsthe steadydropin inflationrates.We canexpectthistrendtocontinue goingforwardshouldcommodity fundamentalsremainunchangedandthe dollarremainsstrong.The UnitedStates’exportationof deflationisa definingfactorinslowingglobal growth,butthisisdue inpart to the US economygaininggroundoverother countriessince the GreatRecession. The goodnewsisthatalthoughthe pastyear hasbeenbelow expectations of 2.0%, we saw an uptickcomparedto YoY (%) inflationfor2014. 0.00 2.00 4.00 6.00 8.00 10.00 12.00 14.00 16.00 18.00 20.00 US High Yield YTW Eurozone High Yield YTW Emerging Markets High Yield YTW Figure 4:HighYield Spreads of US, Eurozone, and EmergingMarkets Source: FactSet & Bloomberg Figure 5:InflationRates for US, Eurozone, & China Source: Bloomberg &FRED -6.0 -4.0 -2.0 0.0 2.0 4.0 6.0 8.0 10.0 12.0 14.0 -4.0 -2.0 0.0 2.0 4.0 6.0 8.0 10.0 Eurozone CPI China CPI US CPI
  • 4. Yieldson US, Canadian,andUK bondshave seena slightuptickatthe endof thisyear aftera generallydown yearin 2014. GermanyhascontinueditsdownwardtrendalongwithJapan.Overall,the USshouldsee its upwardtrendcontinue hasthe Federal Reserve hasinitiatedarate hike.Japanhassuccessfullyhitits2.0% inflationmark,whichisamilestone forthemasJapanhas seensubparinflationfordecadesanditsdeclining spreadon tax revenue andinterestpaymentshasadded pressure forAbenomics(Japan’squalitative easing program) to succeed. Trade globallycontinuestoslide inAsiaandNorthAmericanwhile the Eurozone remainsconsistentlyinthe greenfortrade growth.Worriesabouta slowingChinahave destabilizedmarketsandworriedinvestorsinQ3 of 2015. The fact of the matteris that we have beenlivingwithaneverslowingChinafor some time nowand investorshave beenslow toconsiderthe realityof China’sslowinggrowth. Figures 7,8 and 9 below showthe exportgrowthforChinaand importgrowthfor the Eurozone andthe UnitedStates.Figure 7revealsthatChina’s exportgrowthhasactuallybeennegative forover13 straightmonthsdroppingbyas muchas 21.0% monthover month.It shouldbe nosurprise toinvestorsthatChina’sGDPgrowthwas to follow suit. Anotherkeycomponentindeterminingthe healthof global trade isthe BalticFreightDryIndex.This indexis oftenusedasan indicatorof future global growthor contractionthat measuresthe trade activityforlarge merchantships.Figure 10 on the nextpage showsthe BalticIndex withmovingaverage figures. -40 -30 -20 -10 0 10 20 30 40 -40 -30 -20 -10 0 10 20 30 40 50 60 -40 -30 -20 -10 0 10 20 30 0 1 2 3 4 5 6 7 8 9 UK Bond - 10 Year - Yield Japan Bond - 10 Year - Yield Germany Bond - 10 Year - Yield Canada Bond - 10 Year - Yield US Bond - 10 Year - Yield Figure 7:China QuarterlyExports Figure 6:Government BondSpreads Globally Source: Bloomberg Figure 8:Eurozone Imports Figure 9:US Imports
  • 5. YTD Sector Performance (MSCI World Index) - As of November, 2015 Consumer Discretionary 3.2 Consumer Staples 3.0 Energy -24.1 Financials -6.8 Health Care 3.6 Industrials -5.2 Information Technology 4.1 Materials -19.0 Telecommunication Services -2.5 Utilites -11.7 c c c c c c c c c c Since Q1 of 2015, the BalticFreightDryIndex hasbeenona significantdownswinghittingthe lowestlevelsin the past 5 yearsto a level of justover477. For reference inindex wasstartedin1985 witha level of 1000. Going forwardthisindicatesthatwe will continue tosee slowerglobal growthascontractsfor large merchantships are longertermandrequire leadtime fornew orders.ThislookscloselytiedtoChina’sslowingexports,which we have seendecline significantlyoverthe lastfiscal year. Giventhe bleak macro-economicoutlookitshouldbe nosurprise equiteshave performedpoorlyinthis environment.Figure 11belowshowsthe YTDreturnsfor the 10 GICS sectorsaccording to the MSCI WorldIndex. Energyis the clearlaggard here withadrop in24.1% overthe pastyear mainlydue tothe crude oil price decline. Materialsdroppednearlyasmuchby 19.0% whichisa peripheral sectortoenergythatusesmanycommodities and inputcostsfor itsproducts.As a result,the inputcostsare cheaperbut that alsoreducesthe sellingprice. Giventhe rise inthe dollarwhichisthe currency denominationof mostcommodities,we are leftwith companiespayinglessforinputcostsbutdue to relative currencydeflationagainstthe dollar,material company productsbringinginrelativelylessrevenue forproductssoldtopforeignmarkets. TechandHealthCare posted the highestreturnsinthe global marketwithreturnsof 4.1% and 3.6% respectively.Overall,the equitymarkets have performedpoorlysofarin 2015. Lookingtowards2016, I expectlacklustergrowthtocontinue asthe economicsshownpreviouslypointtoalongcycle of low growthand economicstagnation. I alsoanticipate emergingmarketstostruggle hasthe low global trade andproductionwill limitindustrial and manufacturingindustryrevenue whichisaprimaryexportof emergingmarketeconomies.The strongdollarwill alsodecrease the value of emergingmarketgoodsleadingtolowerpotential growth. 0 500 1000 1500 2000 2500 3000 3500 4000 4500 Baltic Freight Dry Index Baltic Freight Dry Index - 2 Mo moving avg Baltic Freight Dry Index - 6 Mo moving avg Figure 10:Baltic DryIndex Source: Bloomberg Source: Bloomberg
  • 6. 0.0 2.0 4.0 6.0 8.0 10.0 12.0 0 500 1000 1500 2000 2500 New Housing Starts (Left) U6 Unemployment Rate (Right) 0 1000 2000 3000 4000 5000 6000 7000 8000 9000 0.0000 200.0000 400.0000 600.0000 800.0000 1000.0000 1200.0000 Consumer Revolving Credit (Right) Net Charge Offs (Left) 2000 2001 2002 2003 2004 2005 2006 2007 2008 2009 2010 2011 2012 2013 2014 OECD 4 1.4 1.6 2.1 3.2 2.6 3.0 2.6 0.2 -3.6 0.9 1.7 1.2 1.4 1.7 UK 3.8 2.7 2.5 4.3 2.5 2.8 3.0 2.6 -0.3 -4.3 1.9 1.6 0.7 1.7 2.6 Japan 2.3 0.4 0.3 1.7 2.4 1.3 1.7 2.2 -1.0 -5.5 4.7 -0.5 1.8 1.6 -0.1 Germany 3 1.7 0 -0.7 1.2 0.7 3.7 3.3 1.1 -5.6 4.1 3.6 0.4 0.1 1.6 US 4.1 1.0 1.8 2.8 3.8 3.3 2.7 1.8 -0.3 -2.8 2.5 1.6 2.3 2.2 2.4 -8 -6 -4 -2 0 2 4 6 Source: World Bank Figure 1: World GDP (%) Change & Estimates 2015-2017 UnitedStatesMacro Economicsat a Glance The US has proven to be the most resilientdeveloped country sincethe Great Recession.Key economic statisticspointto the US havingsignificanttailwinds goingforward for 2016 and it could prove to be a strong pick for equity securities compared to other countries. Valuations remain high for domestic indices likethe S&P 500,but itmay be supported by strong economics. As shown above, the US remains consistently more stableand with better growth figures than other developed nations. Going into 2016, a lot of the growth will bedependent on consumers’confidence and financial stability. Wewill explore these growth factors and additional cyclical patterns thatcould lead to further growth down the road. The economic cyclical patterns takingplacein the United States areencouraging. Overall unemployment is atcycle lows; new housingstarts suggesta steadily improvinghousingmarket.Figure 14 below shows since2008 consumer debt has slightly decreased whilebank charge-offs on debt have substantially decreased to pre-recession lows.This points to an improved consumer balancesheet that has less exposureto defaultrisk and debt burdens. Source: Bloomberg Figure 12:GDPFigures for DevelopedCountries Source: Bloomberg 0.0 1000.0 2000.0 3000.0 4000.0 5000.0 6000.0 7000.0 8000.0 9000.0 0.0 200.0 400.0 600.0 800.0 1000.0 1200.0 Consumer Revolving Credit (Right) Net Charge Offs (Left) Figure 13:New Housing Starts Vs. Unemployment Figure 14:Consumer Debt Vs. Charge Offs Source: Bloomberg
  • 7. New construction projects haveseen considerablegrowth since2011,but when includingimprovements to existing infrastructure,construction is down for the past5 quarters. Figure 15 below shows the YoY% growth for total new construction put in placeversus new construction plus improvements. This implies thegrowth in new construction is slowingand improvements have been negative for some time. The lack of new construction may leak into new housing starts if consumer demand drops,but I expect the oppositeto take placeas other economic indicators pointto a potential risein consumer demand, sentiment, and spending. Increased lendingcosts is another catalystthatwill propel this trend forward (lower growth) assumingborrowingcosts rise significantly dueto the Federal Reserve rate hike. In the figure below, the 10-yr Treasury Bond yield is plotted againstthe Consumer PriceIndex on the right. In the latter half of 2015,the CPI hit0.0% inflation growth,which is ala rmingand well below the desired target of 2.0-2.5%. Given the lowinflation environment and mild rate hikes, I expect rates to remain low for all of 2016 risingby at most 150 basis points fromDecember of 2015 through December of 2016.The economy will s till have room to rideeven with higher rates. I do not expect the higher rates to slowdown new housingstarts or construction if consumers and business’balancesheets remain healthy through 2016. Lower consumer credit also leaves roomfor additional spendingand will bea catalystfor economic growth going forward. The economy in the US has been pickingup pace and I expect the CPI to continue to riseas we move into a more inflation friendly environment. In figure16 below, the 10 Year Treasury Yield is plotted againstthe CPI.In 2015 we are much lower than we should be, but given the tailwinds for consumers I believedemand will pick up and push the CPI back into a normal range of 2.0-2.5%. -30.0% -20.0% -10.0% 0.0% 10.0% 20.0% 30.0% Dec-10 Mar-11 Jun-11 Sep-11 Dec-11 Mar-12 Jun-12 Sep-12 Dec-12 Mar-13 Jun-13 Sep-13 Dec-13 Mar-14 Jun-14 Sep-14 Dec-14 Mar-15 Jun-15 Sep-15 Total Construction Put in Place, SA, Mil USD - YoY% Total Private Construction Put in Place, Residential (inc. Improvements), SA, Mil USD - YoY% -3.0% -2.0% -1.0% 0.0% 1.0% 2.0% 3.0% 4.0% 5.0% 6.0% -3.0% -2.0% -1.0% 0.0% 1.0% 2.0% 3.0% 4.0% 5.0% 6.0% Dec-05 May-06 Oct-06 Mar-07 Aug-07 Jan-08 Jun-08 Nov-08 Apr-09 Sep-09 Feb-10 Jul-10 Dec-10 May-11 Oct-11 Mar-12 Aug-12 Jan-13 Jun-13 Nov-13 Apr-14 Sep-14 Feb-15 Jul-15 10-yr Treasury Bond - CPI - Right 10-yr Treasury Bond - Left CPI - Left Figure 15:Total ConstructionVs Private Construction Source: Bloomberg Figure 16:10 Year TreasuryRate Vs. CPI Source: Bloomberg
  • 8. 94 95 96 97 98 99 100 101 102 0.59 0.6 0.61 0.62 0.63 0.64 0.65 0.66 0.67 0.68 Consumer Free Cash Flow (Left) ConsumerConfidence (Right) 60 61 62 63 64 65 66 67 4 5 6 7 8 9 10 Civillian Unemployment Labor Force Participation The civilian unemployment rate has dropped by nearly 5% since 2009 while the labor force participation rate dropped by 3% over the same period of time. Employment figures are not as good as they appear. We have seen the unemployment rate drop significantly since2008,buthas employment really improved enough to supporta resurgence in the US economy or are consumer justmore confident and comfortabl ewith the state of the economy? Figure 17 below suggests the decrease in unemployment is largely due to a reduction in labor forceparticipation. This suggests that the unemployment situation has notreally changed drastically with only a net 2.0% increasein actual employment, but the improvement we have seen could lead to wage growth and future economic expansion. The casefor continued growth insidethe US is also supported by expanding consumer confidence that has been on the rise sincethe 2008/2009 recession. Figure18 below charts consumer confidence and consumer free cash flowfrom 2005 Q3 until 2015 Q3. Consumer confidence is on a normalized scalewhere 100 is the startingpointfor the data set and is an indicator of overall economic health accordingto consumers.Looking at the chart we see that consumer free cash flow typically lags consumer confidencedue to the frequency of the data recorded. Consumers will immediately notice additional cash flowbefore the data can speak for itself.This trend was clearly reversed in 2007 - 2008 when extreme financial conditionsoccurred.Based on the data we can infer that consumer free cash flowis continuingto rise,which has the potential to fuel equites with high domestic exposure and potential lead to margin or multipleexpansion in the future. Consumer free cash flowis a definite indicator for potential future growth going forward. Other economic indicators suggest we may see a slowingUS economy going forward if not in 2016 than in 2017 potentially,should the trends remain intact.On the next page Figure19 shows the ISM PMI compositeindex versus the ISM Non-Manufacturingindex. Consumer Free Cash Flows = Personal Disposable Income – Financial Obligations – Foot and Energy Costs A decline in energy costs has boosted CFCF! Figure 17:Unemployment Vs. Labor Force Participation Source: FRED Figure 18:Consumer Free CashFlowVs. Consumer Confidence Source: FRED
  • 9. The PMI (PurchasingManagers Index) CompositeIndex is a comprised of five sub categories;production level, new orders from customers, supplier delivery speed, inventory levels,and employment levels with managers ratingeach category as “better”, “same” or “worse”. This is converted into a scalebetween 0 and 100 with higher numbers indicatinga better purchasingindex.The business activity index measures the health of a business in a similar fashion to the PMI Index. Overall,the PMI index has seen a sharp declinein 2014 and 2015 will the Non-Manufacturingindex has remained strong through 2015. This indicates manufacturingsectors arestruggling(i.e.industrials/ materials),butnon-manufacturing companies have seen conditions remain aboutthe same sincethe startof 2015. Going forward I anticipatethat added consumer free cash flowand growing employment will ignitespendingin non-manufacturingbusiness lines and push the Non-ManufacturingIndex up in 2016. Despite the positiveyear for consumers in 2015,retail sales turned negative YoY for 2015.Figure 20 below outlines the change in retail sales YoY%change from 2005 until the end of Q3 2015. We have not seen negative sales growth in the US since2009 duringthe Great Recession.Lower automotive sales arepartly responsiblefor the decrease in retail sales accountingfor a 0.5% drop in November and a similardrop-off in August as well. Given the stronggrowth in consumer free cash flowand confidence, I expect retail sales to pick up in 2016 which will push consumer discretionary to be a leading sector for returns -15.0% -10.0% -5.0% 0.0% 5.0% 10.0% 15.0% Dec-05 May-06 Oct-06 Mar-07 Aug-07 Jan-08 Jun-08 Nov-08 Apr-09 Sep-09 Feb-10 Jul-10 Dec-10 May-11 Oct-11 Mar-12 Aug-12 Jan-13 Jun-13 Nov-13 Apr-14 Sep-14 Feb-15 Jul-15 Retail Sales, Total, SA - 1 yr chg % Retail Sales, NAICS, SA - 1 yr chg % Despite a stronger consumer balance sheet, retail sales have slide to a -1.0% growth rate according to the North American Industry Classification System 30.0 35.0 40.0 45.0 50.0 55.0 60.0 65.0 70.0 30.0 35.0 40.0 45.0 50.0 55.0 60.0 65.0 ISM: PMI Composite Index ISM: Non-Manufacturing Business Activity Index Figure 19:PMI Composite Index Vs. ISMBusiness Activity Source: Bloomberg Figure 20:Retail SalesYoY (%) Change Source: Bloomberg
  • 10. YTD Sector Performance (MSCI US Index) - As of November, 2015 Growth -1.9 Small Cap -3.7 Mid Cap -2.1 Large Cap 0.0 Value -2.0 Small Cap -4.5 Mid Cap -2.3 Large Cap -0.5 Small Cap -5.2 Large Cap -1.6 c c c c c c c c c c EquityPerformance forUS Markets Overall equity performance for the US has been lackluster in 2015 due to the downturn in August which resulted from poor economic outlook in China.Figure 21 below shows the various market returns for Growth and Valuestocks categorized by market capitalization.Valuehas slightly underperformed growth with small cap signifiacntly underperforminglargecap accordingthe MSCI US Indicies. Since2008 we have seen a significantmultipleexpansion in US stocks. Figure 22 below illustrates thehistorical P/Eeach quarter for the S&P 500. Current equity valuations for the S&P 500 sitat nearly 2 standard deviations fromthe average over the past10 years.For the samplethis looks likethe current valuations areoutof line,however; over a longer time-horizon valuations areactually closer to the long term historical averageof about 16 P/E. The rapid increasein corporateprofits following2008/2009 alongwith lowinterest rates, and quantatativeeasingare largely responsiblefor the continous multipleexpansion wehave seen sincethe Great Recession.As the Fed begins to hike rates we should seea general multiplecontraction as barrowingcosts riseand bond yield become more attractive. We can see further evidence of fundamental justification for multipleexpansion in Figures 22 and 23 on the next page that show the steady increasein corporatemargins and consistentper sharefigures. 8.00 9.00 10.00 11.00 12.00 13.00 14.00 15.00 16.00 17.00 18.00 Mean + 1 SD -1 SD +2 SD -2 SD P/E Source: FactSet & Bloomberg Figure 21:S&P 500 Historical P/E Ratio Source: FactSet
  • 11. EBITDA margins haveremained consistently high comingout of 2009 hittinga high in 2014 and droppingjust4 bps in the most recent reporting quarter (September Q3). Profitmargins arealso atcyclehighs hittingas high as 10% in 2014.Since 2009 margins havehit record highs with the exception of free cash flowmargin which has largely been reduced by increasingcapital expenditures. The per sharefigures show a similar story with EPS growing exponentially since2009 even more that profitmargins due mainly to increased sharebuy backs funded through lowinterest rate loans and excess cash on the balancesheet. This trend has waned off in 2015 amidstslowingglobal growth. The S&P 500 is largely exposeto global conditions and the economic slowdown abroad has already startingto slowearnings growth and EPS. Going forward I expect companies with high foreign sales to domestic sales ratiosto struggleand miss earnings in 2016. Therefore, largecap companies with international revenue with be a definite under-performer in 2016 and I recommend companies with lowexposure to international markets. Dec '05 Dec '06 Dec '07 Dec '08 Dec '09 Dec '10 Dec '11 Dec '12 Dec '13 Dec '14 Sep '15 EPS (recurrent earnings) 76.28 86.21 94.77 74.35 47.18 84.30 99.56 105.28 110.07 120.59 113.40 Free Cash Flow Per Share 73.54 102.53 45.62 133.90 38.03 107.67 111.32 98.10 110.03 104.59 102.36 Sales Per Share 841.22 937.31 1,017.47 1,079.45 907.07 966.66 1,066.93 1,111.30 1,147.54 1,188.33 1,182.00 0.0 200.0 400.0 600.0 800.0 1000.0 1200.0 1400.0 0.0 20.0 40.0 60.0 80.0 100.0 120.0 140.0 160.0 Dec '05 Dec '06 Dec '07 Dec '08 Dec '09 Dec '10 Dec '11 Dec '12 Dec '13 Dec '14 Sep '15 EBITDA Margin 17.40 18.03 18.00 16.00 15.23 18.22 18.62 18.71 19.16 19.73 19.69 Net Margin 9.01 9.18 9.23 6.89 5.16 8.55 9.19 9.35 9.53 9.99 9.55 Free Cash Flow Margin 8.11 10.87 4.54 11.83 4.48 10.86 10.31 8.71 9.56 8.76 8.63 0.00 5.00 10.00 15.00 20.00 25.00 Figure 23:Historical Margins for the S&P500 Source: Bloomberg Figure 24:Historical Per Share Figures for the S&P500 Source: Bloomberg
  • 12. Figures 25 and 26 below show the S&P 500’s Debt to Assets Ratio and EBITDA to Interest Expense ratio sinceAugust 2014 until November 2015.Overall,corporatebalancesheets remain more leveraged than in 2014 with Debt to Assets risingby a multipleof 1.1 over the data set. Over the same time frame EBITDA to Interest Expense has risen by a multipleof approximately 0.5.Therefore, and added risk is in play for largecap companies buttheir earnings ability has keptthem solventwith relatively strongbalancesheets.I do not expect leverage to work to the detriment of these companies in 2016, and I believe going into 2016 with higher interest rates they will maintain healthy solvency ratios. Outsidethe US demand has stagnated for US exports and dollar denominated goods due to the relativerisein the dollar. This was especially detrimental to earnings in 2015.In addition,energy underperformed substantially understandably of coursedue to the poor commodity fundamentals.In figures XXX and XXX below you can see the difference in the S&P 500’s earnings / revenue with and without energy. Overall,earnings growth was very positivewith the energy sector removed from the analysisata respectable6.9% YoY growth rate. Sales growth although in the red with energy is positiveas well with a 1.9% growth rate so far in 2015. Looking at Figure 28, the chartshows consensus estimates for earnings growth in 2016 are 8.2%. Analysts are anticipatinga net economic tailwind fromlow oil prices and high GPD growth north of 3.0%. Also builtinto this estimate is a rebound of oil prices back into the $60-70-dollarrangeby year end. I find these estimates to high and overly optimistic.Given the poor growth outlooks globally and high international exposurelargestcap and mid cap companies have abroad,I believe the market is settingitself up for under performance in 2016. In addition,there has yet to be a catalystfor oil fundamentals to change and the most likely candidateto reduce production is the United States. Reduced production domestically will continue to drawdown earnings and giveus similar results as 2015. 8.5 9 9.5 10 10.5 11 7.2 7.4 7.6 7.8 8 8.2 8.4 8.6 Earnings Earnings:Ex - Energy Revenue Revenue Ex - Energy CY 2015 -0.3% 6.9% -3.4% 1.9% -4.0% -2.0% 0.0% 2.0% 4.0% 6.0% 8.0% 2009 2010 2011 2012 2013 2014 2015 2016 Earnings -8.0% 38.4% 12.6% 5.3% 5.2% 5.1% -0.3% 8.2% Sales -7.7% 9.2% 10.6% 1.8% 1.8% 3.4% -3.4% 4.5% -20.0% -10.0% 0.0% 10.0% 20.0% 30.0% 40.0% 50.0% Figure 25:Debt to Assets Ratio for S&P500 Figure 26:EBITDA to Interest Expense Ratiofor S&P500 Source: Bloomberg Source: Bloomberg Figure 27:S&P500 Earnings andSales in 2015 Figure 28:S&P500 Earnings andSales in 2009-2015 Source: FactSet Source: FactSet
  • 13. The draw down earlier this year in August was in responseto negative growth prospects and poor economics comingout of China.As shown in Figure 29 below, the VIX reacted violently when China devalued its currency and when its stock market corrected resultingin China implementing a form of quantitativeeasingonly with equity markets instead of bonds. This reinforces my view of reducingforeign exposure especially nowas volatility is heavily dependent on foreign markets. Conclusions& Recommendations Going into 2016 I estimate the US economy will see a healthy growth rate of 3.0% or more and as the Fed raises rates I expect to see the US outpace most other developed economies. This will causethedollar to remain strongor continue to appreciateagainstother currencies thus increasethe purchasingpower of the dollar,which may provide consumers with tailwinds for a shortperiod of time. This is under the condition thatthe United States can maintain its growth in spiteof slowingglobal growth if only for the short term. A strongdollar will keep commodities in check or at low prices which will resultin a lowPPI for domestic producers.I expect lower input costs for producers to hurt industrialsand materialsdueto inability to export because of high dollar strength and low inputcosts. As a result,these companies will havelowsales and earnings growth in 2016 if they are expose to foreign markets that are forced to buy in dollars. Additionally,a strongdollar dueto divergingeconomic policies and exportingof deflation from low commodity prices has led to weak emerging market growth, and goingforward I expect the same in 2016 unless underlyingfundamentals for commodities change Whilea low commodity pricedestroys valueabroad,itmay lead to net economic tailwinds domestically.As seen in the consumer free cash flowchart,consumers should have lower overall economic expense which has the potential to driveup confidence and spending. Companies highly exposed to domestic US markets will benefitgreatly from growing consumer sentiment and free cash flow.Strategically itmakes most sense to invest where the money will flowfirst –mainly retail, staples,and potentially tech. Therefore, I recommend investingin US based mid cap companies with high domestic exposure in the Consumer Discretionary,Consumer Staples,and Information Technology. -1.0 -0.5 0.0 0.5 1.0 1.5 2.0 2.5 -40.0 -30.0 -20.0 -10.0 0.0 10.0 20.0 30.0 40.0 CBOE Volatility Index (VIX) Yuan : Dollar FX Rate Figure 29:YuanDollar Exchange Rate Vs. CBOE VIX Source: FactSet