SlideShare une entreprise Scribd logo
1  sur  6
Télécharger pour lire hors ligne
Sales Volume numbers represent all Single Family Homes, Condos, Townhomes and Land sales in the North End of the Gunnison Valley, including Almont, CB South, Rural Crested Butte, Crested Butte, Mt. Crested Butte and Rural Mt. Crested Butte as shown in the Gunnison Country
Association of Realtors MLS. Information contained herein deemed reliable, but not guaranteed.
CHRIS KOPF
PREVIEWS® PROPERTY SPECIALIST
COLDWELL BANKER BIGHORN REALTY
cell: 970.209.5405
chriskopf@bighornrealty.com
www.chriskopf.com
CRESTED BUTTE REAL ESTATE MARKET REPORT
2014 YEAR TO DATE – THROUGH NOVEMBER
PREPARED BY CHRIS KOPF
CRESTED BUTTE REAL ESTATE MARKET REPORT
2014 YEAR TO DATE – THROUGH OCTOBER
PREPARED BY CHRIS KOPF
CHRIS KOPF
PREVIEWS® PROPERTY SPECIALIST
COLDWELL BANKER BIGHORN REALTY
cell: 970.209.5405
chriskopf@bighornrealty.com
www.chriskopf.com
#1 Agent in CB
Kopf Rises to Top Spot
Total Volume $21.3M
Single Family Home!
Median Sales Price
Sales Volume numbers represent all Single Family Homes, Condos, Townhomes and Land sales in the North End of the Gunnison Valley, including Almont, CB South, Rural Crested Butte, Crested Butte, Mt. Crested Butte and Rural Mt. Crested Butte as shown in the Gunnison Country
Association of Realtors MLS. Information contained herein deemed reliable, but not guaranteed.
CHRIS KOPF
PREVIEWS® PROPERTY SPECIALIST
COLDWELL BANKER BIGHORN REALTY
cell: 970.209.5405
chriskopf@bighornrealty.com
www.chriskopf.com
CRESTED BUTTE REAL ESTATE MARKET REPORT
2014 YEAR TO DATE – THROUGH NOVEMBER
PREPARED BY CHRIS KOPF
Crested Butte Real Estate Market Report –
Year to Date through November, 2014 - All Good
2014 Totals Look Similar to 2013 Results
The Crested Butte Real Estate Market started off with a whimper, but
is ending similar to 2013 as a result of a very strong Summer and Fall.
We see that the 2014 YTD Volume of $141M is a slight increase (3%)
over the 2013 total of $137M, and the number of total properties sold
YTD in 2014 is 302 vs. 310 in 2013. While the length of the “off-season”
shrunk a bit this Fall thanks to a number of Fall events, beautiful
autumn colors, and continued visitors. We are in a holding pattern
now until the beginning of the year – the ski resort is open and lifts are
spinning – but primarily servicing local skiers until the Holidays.
There is typically light activity through Christmas – and things start to
pick-up around New Years eve.
Comparing the monthly totals from 2014 to 2013 we see that while we
have arrived at about the same destination, the strong Fall results in
2014 made up for the slower start at the beginning of the Year.
Looking at the properties currently Under Contract (33 properties
YTD Total $ Volume
of Properties Sold
YTD Number of
Properties Sold
Comparing 2013 & 2014 $ Volume of Properties Sold By Month
MO. 2013 2014
JAN $8,751,700 $5,773,686
FEB $8,671,475 $7,026,450
MAR $10,261,486 $3,803,000
APR $17,126,400 $8,412,800
MAY $8,539,400 $14,169,200
JUNE $11,327,749 $7,800,189
JULY $13,731,000 $10,012,300
AUG $10,323,420 $24,785,750
SEPT $17,127,511 $22,739,400
OCT $18,102,107 $27,347,015
NOV $13,044,100 $9,369,425
DEC $7,091,625
TOTAL $144,097,973 $141,239,215 JAN FEB MAR APR MAY JUNE JULY AUG SEPT OCT NOV
$5,773,686
$7,026,450
$3,803,000
$8,412,800
$14,169,200
$7,800,189
$10,012,300
$24,785,750 $22,739,400
$27,347,015
$9,369,425
2014 YTD
$ Volume
representing $9.9M) the month of December results will
likely be around $6M – and the overall 2014 totals will
barely exceed the annual totals from 2013.
Interesting stat – The Inventory of the number of
Properties for Sale has been dropping over the past few
years – looking at the snapshot from November of the
previous years we we see:
2012 = 743, 2013 = 648, 2014 = 614
Sales Volume numbers represent all Single Family Homes, Condos, Townhomes and Land sales in the North End of the Gunnison Valley, including Almont, CB South, Rural Crested Butte, Crested Butte, Mt. Crested Butte and Rural Mt. Crested Butte as shown in the Gunnison Country
Association of Realtors MLS. Information contained herein deemed reliable, but not guaranteed.
CHRIS KOPF
PREVIEWS® PROPERTY SPECIALIST
COLDWELL BANKER BIGHORN REALTY
cell: 970.209.5405
chriskopf@bighornrealty.com
www.chriskopf.com
CRESTED BUTTE REAL ESTATE MARKET REPORT
2014 YEAR TO DATE – THROUGH NOVEMBER
PREPARED BY CHRIS KOPF
Crested Butte Luxury Real Estate Market - Properties Sold for $1 Million + Year to Date
Luxury Properties For Sale in the Crested Butte Area
There are a total of 106 properties Listed for over $1M for a total Volume of $217M, including 68 Single Family Homes for sale with
Asking Prices over $1M representing $134M in total volume. In historic downtown Crested Butte there are 12 luxury homes for sale
with prices ranging from $1.1M to $2.7M and median Asking Price of $1.25M, and Average Price per Sq. Ft. of $570. There are 21
Single Family Homes for sale on Mt. Crested Butte – and a handful representing ski-in/ski-out including 2 in the Prospect
Subdivision. There are 2 high-end luxury condos and town homes for sale in Mt. Crested Butte – one at the ski-in/out West Wall
(Penthouse unit A-403 Listed for $2.095M), and two across the street at The Villas, there is also 1 luxury condo for sale in downtown
Crested Butte at the corner of Gothic & 7th for sale for over $1.1M.
There have been 27 properties sold for over $1M YTD – 20 of them have been
Single Family Homes, 2 ski-in/out condos (West Wall and Silver Ridge) and
5 riverfront home sites at Wilder on the Taylor. The most expensive single
family home sold in the past 16 months has been the $3.9M luxury home sold
in Trappers Crossing at CB (5 bedrooms, 5.5 baths, fully furnished). The
Luxury volume of $47.2M sold YTD represents 33% of the total volume, and
the the 20 Luxury Single Family Homes Sold total of $36.4M comes short of
the 27 sales and $46.3M for the same period in 2013. The average sold price
for the high-end homes sold is $1.82M; median price $1.48M, and Average
Price per sq. ft. was $476.
2014 YTD Luxury
Properties $1M+ Sold
Total Sold by
Category
Average
Sold Price
Total Asking
Price by
Category
Average
Asking
Price
Total Original
Price by
Category
Average
Original
Price
%
Difference
Original
Price vs.
Sold Price
%
Difference
Asking Price
vs. Sold
Price
Average
Price
Per Sq.
Foot
Count of #
Properties
Sold
Total All Sales $47,705,545 $1,766,872 $54,770,950 $2,028,554 55,573,000 $2,058,259 -14.16% -12.90% 27
Condos & Townhomes $3,282,500 $1,641,250 $3,495,000 $1,747,500 3,445,000 $1,722,500 -4.72% -6.08% $572 2
Single Family Homes $36,423,045 $1,821,152 $41,225,950 $2,061,298 42,028,000 $2,101,400 -13.34% -11.65% $476 20
Mt. Crested Butte $6,008,500 $1,502,125 $6,640,000 $1,660,000 6,740,000 $1,685,000 -10.85% -9.51% $423 4
Mt. CB Single Family Homes $2,726,000 $1,363,000 $3,145,000 $1,572,500 3,045,000 $1,522,500 -10.48% -13.32% $322 2
Crested Butte Single Family Homes $15,427,045 $1,542,705 $16,212,950 $1,621,295 16,561,000 $1,656,100 -6.85% -4.85% $533 10
Skyland Single Family Homes $1,925,000 $1,925,000 $1,950,000 $1,950,000 1,950,000 $1,950,000 -1.28% -1.28% $403 1
Land/Lots $8,000,000 $1,600,000 $10,050,000 $2,010,000 $9,031,000 $1,806,200 -11.42% -20.40% 5
Year
Total #
Luxury
Homes Sold
$ Volume
Luxury
Homes Sold
Avg. Price Per
Sq. Ft
2009 13 $21,260,000 $396
2010 14 $23,919,100 $411
2011 23 $40,179,500 $427
2012 12 $21,197,500 $379
2013 27 $46,313,130 $425
2014 20 $36,423,045 $476
Sales Volume numbers represent all Single Family Homes, Condos, Townhomes and Land sales in the North End of the Gunnison Valley, including Almont, CB South, Rural Crested Butte, Crested Butte, Mt. Crested Butte and Rural Mt. Crested Butte as shown in the Gunnison Country
Association of Realtors MLS. Information contained herein deemed reliable, but not guaranteed.
CHRIS KOPF
PREVIEWS® PROPERTY SPECIALIST
COLDWELL BANKER BIGHORN REALTY
cell: 970.209.5405
chriskopf@bighornrealty.com
www.chriskopf.com
CRESTED BUTTE REAL ESTATE MARKET REPORT
2014 YEAR TO DATE – THROUGH NOVEMBER
PREPARED BY CHRIS KOPF
Median and Average Prices for Condos &
Townhomes shows an increase in price points --
given the YTD data we see Median Condo Sales
Price at $192,000 and Average at $233,000. Avg.
Price per sq. ft. for Condos & Town homes are up
15% year over year from $214 in 2013 to $247 year
to date 2014.
We see a greater price increase in the Single
Family (SF) homes category – Comparing Year to
Date (YTD) results from 2014 to prior years we see
that the Median Price for Single Family homes has
risen from $530,000 to $667,500 and Average SF
Home price has risen from $780,000 to $854,000.
Given the mix of homes sold this may be a result
of the sample set. Avg. Price per sq. ft. for SF
Homes are up 12% from $295 (2013) to $330 year
to date.
Condo Median 
Sales Price
Single Family Home!
Median Sales Price
Condo Average
Sales Price
Single Family Home!
Average Sales Price
What Real Estate is Selling in the Crested Butte
area? Condos and Townhomes represents the
most transactions (155) and 51% of all transaction,
with Single Family homes making up the second
largest count (93). Land /Lots Sold (54) represent
18% of the count but only 12% of the total dollar
volume sold YTD. There have been 20 single
family homes sold for over $1M, and this
represents 26% of the overall Volume, but only 7%
of the total number of transactions.
2014 YTD TOTALS - CATEGORY
$ Volume of
Properties Sold
% of Total
Count of #
Properties
Sold
% of Total
Total All Sales $141,239,215 302
Condos & Townhomes $44,619,575 32% 155 51%
Single Family Homes $79,428,965 56% 93 31%
Mt. Crested Butte $50,402,009 36% 152 50%
Mt. CB Single Family Homes $17,097,270 12% 25 8%
Crested Butte Single Family Homes $28,994,395 21% 28 9%
Skyland Single Family Homes $2,825,000 2% 2 1%
CB South Single Family Homes $5,670,800 4% 14 5%
Almont $9,239,500 7% 13 4%
Land/Lots $17,190,675 12% 54 18%
SF Homes Sold > $1M $36,423,045 26% 20 7%
Land / Lots Sold YTD Count YTD %
YTD 2010 24 15%
YTD 2011 48 19%
YTD 2012 53 22%
YTD 2013 59 18%
YTD 2014 54 13%
Sales Volume numbers represent all Single Family Homes, Condos, Townhomes and Land sales in the North End of the Gunnison Valley, including Almont, CB South, Rural Crested Butte, Crested Butte, Mt. Crested Butte and Rural Mt. Crested Butte as shown in the Gunnison Country
Association of Realtors MLS. Information contained herein deemed reliable, but not guaranteed.
CHRIS KOPF
PREVIEWS® PROPERTY SPECIALIST
COLDWELL BANKER BIGHORN REALTY
cell: 970.209.5405
chriskopf@bighornrealty.com
www.chriskopf.com
CRESTED BUTTE REAL ESTATE MARKET REPORT
2014 YEAR TO DATE – THROUGH NOVEMBER
PREPARED BY CHRIS KOPF
The detail below represents the past three years data by category. Interesting note for both Buyers and Sellers: after 3 years of price decline, most properties are priced to the Market and offer
great value, evidence by % Difference Original Price vs. Sold Price and the % Difference Asking Price vs. Sold Price by Category, on average 9.53% for all property types.
2014 YTD Totals
Total Sold
by Category
Average
Sold Price
Total Asking
Price by
Category
Average
Asking
Price
Total Original
Price by
Category
Average
Original
Price
% Difference
Original Price
vs. Sold Price
% Difference
Asking Price
vs. Sold Price
Average
Price Per
Sq. Foot
Count of #
Properties
Sold
Total All Sales $141,239,215 467,680 $156,123,158 516,964 162,509,556 538,111 -13.09% -9.53% 302
Condos & Townhomes $44,619,575 287,868 $47,562,058 306,852 49,786,133 321,201 -10.38% -6.19% $247 155
Single Family Homes $79,428,965 854,075 $87,447,900 940,300 90,515,249 973,282 -12.25% -9.17% $330 93
Mt. Crested Butte $50,402,009 331,592 $55,253,848 363,512 56,879,557 374,208 -11.39% -8.78% $266 152
Mt. CB Single Family Homes $17,097,270 683,891 $18,619,950 744,798 19,873,750 794,950 -13.97% -8.18% $255 25
Crested Butte Single Family Homes $28,994,395 1,035,514 $30,691,450 1,096,123 31,416,000 1,122,000 -7.71% -5.53% $455 28
Skyland Single Family Homes $2,825,000 1,412,500 $2,935,000 1,467,500 2,935,000 1,467,500 -3.75% -3.75% $361 2
CB South Single Family Homes $5,670,800 405,057 $5,957,100 425,507 6,106,100 436,150 -7.13% -4.81% $183 14
Almont $9,239,500 710,731 $11,402,500 877,115 10,242,500 787,885 -9.79% -18.97% $3,666 13
Land/Lots $17,190,675 318,346 $21,113,200 390,985 19,997,599 370,326 -14.04% -18.58% 54
SF Homes Sold > $1M $36,423,045 1,821,152 $41,225,950 2,061,298 42,028,000 2,101,400 -13.34% -11.65% $476 20
2013 YTD Totals
Total Sold
by Category
Average
Sold Price
Total Asking
Price by
Category
Average
Asking
Price
Total Original
Price by
Category
Average
Original
Price
% Difference
Original Price
vs. Sold Price
% Difference
Asking Price
vs. Sold Price
Average
Price Per
Sq. Foot
Count of #
Properties
Sold
Total All Sales $137,006,348 441,956 $148,137,091 477,862 249,121,481 803,618 -45.00% -7.51% 310
Condos & Townhomes $34,948,777 256,976 $37,622,334 276,635 41,534,600 305,401 -15.86% -7.11% $214 136
Single Family Homes $89,660,935 779,660 $96,638,245 840,333 104,764,700 910,997 -14.42% -7.22% $295 115
Mt. Crested Butte $47,259,011 387,369 $51,326,500 420,709 53,549,200 438,928 -11.75% -7.92% $288 122
Mt. CB Single Family Homes $22,133,730 1,106,687 $24,132,500 1,206,625 26,853,400 1,342,670 -17.58% -8.28% $329 20
Crested Butte Single Family Homes $22,013,755 917,240 $23,085,900 961,913 24,767,400 1,031,975 -11.12% -4.64% $433 24
Skyland Single Family Homes $5,012,000 1,002,400 $5,329,000 1,065,800 6,254,000 1,250,800 -19.86% -5.95% $325 5
CB South Single Family Homes $7,438,400 391,495 $7,787,600 409,874 8,078,700 425,195 -7.93% -4.48% $175 19
Almont $1,521,550 190,194 $1,714,300 214,288 1,889,800 236,225 -19.49% -11.24% $154 8
Land/Lots $12,396,636 210,112 $13,876,512 235,195 102,763,781 1,741,759 -87.94% -10.66% 59
SF Homes Sold > $1M $46,313,130 1,715,301 $50,431,000 1,867,815 53,778,000 1,991,778 -13.88% -8.17% $425 27
2012 YTD Totals
Total Sold
by Category
Average
Sold Price
Total Asking
Price by
Category
Average
Asking
Price
Total Original
Price by
Category
Average
Original
Price
% Difference
Original Price
vs. Sold Price
% Difference
Asking Price
vs. Sold Price
Average
Price Per
Sq. Foot
Count of #
Properties
Sold
Total All Sales $95,106,030 389,779 $107,454,647 440,388 128,457,547 526,465 -25.96% -11.49% 244
Condos & Townhomes $27,324,905 265,290 $30,143,399 292,654 39,297,449 381,529 -30.47% -9.35% $205 103
Single Family Homes $57,049,625 648,291 $63,238,948 718,624 73,057,848 830,203 -21.91% -9.79% $269 88
Mt. Crested Butte $37,106,450 353,395 $43,038,700 409,892 46,857,849 446,265 -20.81% -13.78% $272 105
Mt. CB Single Family Homes $15,555,950 864,219 $17,347,900 963,772 20,713,500 1,150,750 -24.90% -10.33% $277 18
Crested Butte Single Family Homes $15,828,513 633,141 $16,903,698 676,148 18,405,698 736,228 -14.00% -6.36% $341 25
Skyland Single Family Homes $2,605,000 $651,250 $3,013,000 $753,250 $3,113,000 $778,250 -16.32% -13.54% $291 4
CB South Single Family Homes $5,405,300 360,353 $5,610,750 374,050 6,249,950 416,663 -13.51% -3.66% $159 15
Almont $1,895,012 270,716 $2,236,600 319,514 2,192,700 313,243 -13.58% -15.27% $245 7
Land/Lots $10,731,500 202,481 $14,072,300 265,515 15,202,200 286,834 -29.41% -23.74% 53
SF Homes Sold > $1M $21,197,500 1,766,458 $24,061,900 2,005,158 27,824,000 2,318,667 -23.82% -11.90% $379 12
Sales Volume numbers represent all Single Family Homes, Condos, Townhomes and Land sales in the North End of the Gunnison Valley, including Almont, CB South, Rural Crested Butte, Crested Butte, Mt. Crested Butte and Rural Mt. Crested Butte as shown in the Gunnison Country
Association of Realtors MLS. Information contained herein deemed reliable, but not guaranteed.
CHRIS KOPF
PREVIEWS® PROPERTY SPECIALIST
COLDWELL BANKER BIGHORN REALTY
cell: 970.209.5405
chriskopf@bighornrealty.com
www.chriskopf.com
CRESTED BUTTE REAL ESTATE MARKET REPORT
2014 YEAR TO DATE – THROUGH NOVEMBER
PREPARED BY CHRIS KOPF
!
Winter Ski Season is Here – CBMR & Many Businesses are Bullish
It has been announced by CBMR, the RTA and others that Winter planes and
hotel room bookings are up and forecasts look good. We have great snow and
lots of events throughout the Crested Butte Ski Season – it is a great time to be
in CB! The metric for measuring the Winter Economy are the monthly Sales
Tax Revenue results and final results for the season in May. Visitors to our
valley in the Winter does result in Real Estate activity - and the more
Showings, Offers, Contracts, results in more Sold properties 30-90 days later.
Upcoming Winter Events of Note:
-  December 13 - Crested Butte Santa Ski & Pub Crawl. cbsantacrawl.com
-  December 20 - Winter Solstice Yurt Dinner. events@cbnordic.org
-  December 24 & 31 - Torchlight and Santa's Sleighride at Base area.
-  January 14-18 – Mountain High Music Festival. mountainhighmusicfest.com
Air Deals on American Airlines to/from DFW - Gunnison.
12/18-12/25 and 1/1-1/11, round trip fares starting as low as $319.00.
Reservations can be made by calling Crested Butte Travel at 970-349-2287.
#1 Agent in Crested Butte, Kopf Rises to the Top - I am very excited to
announce that through much hard work, good fortune, and many great clients
I rose to the top as the #1 Real Estate Agent in Crested Butte (based on a total
Volume of $21.3M at the end of November for the preceding 12 months).
How can I help you? This Crested Butte Real Estate Market report and the
level of detail is representative of what you can expect from me as your Real
Estate Agent. If you are interested in finding out what your existing property
is worth, or considering me to represent you as a Buyer, I would appreciate the
opportunity to earn your business (or that of a friend you think I could help).
For everything Crested Butte Real Estate– visit www.chriskopf.com. Contact
me at: (970) 209-5405, or chriskopf@bighornrealty.com
Thanks,
Chris Kopf
Under Contract Of the 33 properties Under Contract, 17 are
Condos/Townhomes, only 6 are Single Family homes and 10
are lots. At the end of November these 33 properties under
contract represents $9.9M compared with 40 properties Under
Contract and $16.7M at the end of October and $40M at the end
of September.
Active Listings There are 614 properties For Sale in our market
representing $400M. We have seen a steady decrease in local
inventory for sale, but we still have lots of properties for sale –
and some great values.
All Properties
Under Contract
Total Under
Contract by
Asking Price
Average
Under
Contract by
Asking
Price
Count of #
Properties
Under
Contract
Total All Properties Under Contract $9,939,000 $301,182 33
Condos & Townhomes $3,784,400 $222,612 17
Single Family Homes $2,843,100 $473,850 6
Mt. Crested Butte $3,909,400 $229,965 17
Mt. CB Single Family Homes $0 None 0
Crested Butte Single Family Homes $549,000 $549,000 1
Skyland Single Family Homes $0 None 0
CB South Single Family Homes $1,699,100 $424,775 4
Land/Lots $3,311,500 $331,150 10
SF Homes > $1M $1,100,000 $1,100,000 1
Almont $0 None 0
35 Acre SF Homes $0 None 0
All Current Listings
Total Current
Listing Price
by Category
Average
Listing Price
Count of #
Properties on
the Market
Total All Current Listings $400,410,864 $652,135 614
Condos & Townhomes $66,006,639 $360,692 183
Single Family Homes $184,069,698 $1,252,175 147
Mt. Crested Butte $158,385,039 $700,819 226
Mt. CB Single Family Homes $62,279,600 $1,415,445 44
Crested Butte Single Family Homes $27,013,900 $1,125,579 24
Skyland Single Family Homes $14,611,999 $1,328,364 11
CB South Single Family Homes $5,714,100 $519,464 11
Almont $12,104,670 $281,504 43
Land/Lots $150,334,527 $529,347 284
SF Homes > $1M $133,783,698 $1,967,407 68
35 Acre SF Homes $36,098,999 $2,005,500 18

Contenu connexe

Tendances

Annie Williams Real Estate Report - October 2019
Annie Williams Real Estate Report - October 2019Annie Williams Real Estate Report - October 2019
Annie Williams Real Estate Report - October 2019Jon Weaver
 
Gbar monthly-market-insights-report-november20
Gbar monthly-market-insights-report-november20Gbar monthly-market-insights-report-november20
Gbar monthly-market-insights-report-november20Joe Schutt
 
December 2020 Victoria Real Estate Board Statistics
December 2020 Victoria Real Estate Board StatisticsDecember 2020 Victoria Real Estate Board Statistics
December 2020 Victoria Real Estate Board StatisticsVicky Aulakh
 
Georgia Real Estate Market Trends February 2022
Georgia Real Estate Market Trends February 2022Georgia Real Estate Market Trends February 2022
Georgia Real Estate Market Trends February 2022Arthur Prescott
 
December 2018 Greater Boston Real Estate Market Trends
December 2018 Greater Boston Real Estate Market TrendsDecember 2018 Greater Boston Real Estate Market Trends
December 2018 Greater Boston Real Estate Market TrendsJoe Schutt
 
Gbar monhtly-market-insight-report-nov2019
Gbar monhtly-market-insight-report-nov2019Gbar monhtly-market-insight-report-nov2019
Gbar monhtly-market-insight-report-nov2019Joe Schutt
 
The Real Estate Report for the Las Vegas Metropolitan Area (February/March 2...
The Real Estate Report for the Las Vegas Metropolitan Area  (February/March 2...The Real Estate Report for the Las Vegas Metropolitan Area  (February/March 2...
The Real Estate Report for the Las Vegas Metropolitan Area (February/March 2...Mark Evan Israelitt (or IZZY)
 
Annie Williams Real Estate Report - April 2019
Annie Williams Real Estate Report - April 2019Annie Williams Real Estate Report - April 2019
Annie Williams Real Estate Report - April 2019Jon Weaver
 
Housing Rebound - War Room Slides
Housing Rebound - War Room SlidesHousing Rebound - War Room Slides
Housing Rebound - War Room Slideshiddenlevers
 
San Francisco Market Focus November 2017
San Francisco Market Focus November 2017San Francisco Market Focus November 2017
San Francisco Market Focus November 2017Ronny Budiutama
 
Annie Williams Real Estate Report - July 2020
Annie Williams Real Estate Report - July 2020Annie Williams Real Estate Report - July 2020
Annie Williams Real Estate Report - July 2020Jon Weaver
 
Annie Williams Real Estate Report - January 2019
Annie Williams Real Estate Report - January 2019Annie Williams Real Estate Report - January 2019
Annie Williams Real Estate Report - January 2019Jon Weaver
 
Annie Williams Real Estate Report - February 2020
Annie Williams Real Estate Report - February 2020Annie Williams Real Estate Report - February 2020
Annie Williams Real Estate Report - February 2020Jon Weaver
 
Real Estate Board of Greater Vancouver Statistics Package March 2021
Real Estate Board of Greater Vancouver Statistics Package March 2021Real Estate Board of Greater Vancouver Statistics Package March 2021
Real Estate Board of Greater Vancouver Statistics Package March 2021Vicky Aulakh
 

Tendances (20)

Corporate Relocation Council of Chicago Presentation: Real Estate Market Upda...
Corporate Relocation Council of Chicago Presentation: Real Estate Market Upda...Corporate Relocation Council of Chicago Presentation: Real Estate Market Upda...
Corporate Relocation Council of Chicago Presentation: Real Estate Market Upda...
 
1 realtor report
1 realtor report1 realtor report
1 realtor report
 
Annie Williams Real Estate Report - October 2019
Annie Williams Real Estate Report - October 2019Annie Williams Real Estate Report - October 2019
Annie Williams Real Estate Report - October 2019
 
Gbar monthly-market-insights-report-november20
Gbar monthly-market-insights-report-november20Gbar monthly-market-insights-report-november20
Gbar monthly-market-insights-report-november20
 
December 2020 Victoria Real Estate Board Statistics
December 2020 Victoria Real Estate Board StatisticsDecember 2020 Victoria Real Estate Board Statistics
December 2020 Victoria Real Estate Board Statistics
 
October Realtor Report
October Realtor ReportOctober Realtor Report
October Realtor Report
 
Georgia Real Estate Market Trends February 2022
Georgia Real Estate Market Trends February 2022Georgia Real Estate Market Trends February 2022
Georgia Real Estate Market Trends February 2022
 
December 2018 Greater Boston Real Estate Market Trends
December 2018 Greater Boston Real Estate Market TrendsDecember 2018 Greater Boston Real Estate Market Trends
December 2018 Greater Boston Real Estate Market Trends
 
Gbar monhtly-market-insight-report-nov2019
Gbar monhtly-market-insight-report-nov2019Gbar monhtly-market-insight-report-nov2019
Gbar monhtly-market-insight-report-nov2019
 
The Real Estate Report for the Las Vegas Metropolitan Area (February/March 2...
The Real Estate Report for the Las Vegas Metropolitan Area  (February/March 2...The Real Estate Report for the Las Vegas Metropolitan Area  (February/March 2...
The Real Estate Report for the Las Vegas Metropolitan Area (February/March 2...
 
Annie Williams Real Estate Report - April 2019
Annie Williams Real Estate Report - April 2019Annie Williams Real Estate Report - April 2019
Annie Williams Real Estate Report - April 2019
 
Housing Rebound - War Room Slides
Housing Rebound - War Room SlidesHousing Rebound - War Room Slides
Housing Rebound - War Room Slides
 
San Francisco Market Focus November 2017
San Francisco Market Focus November 2017San Francisco Market Focus November 2017
San Francisco Market Focus November 2017
 
Annie Williams Real Estate Report - July 2020
Annie Williams Real Estate Report - July 2020Annie Williams Real Estate Report - July 2020
Annie Williams Real Estate Report - July 2020
 
Annie Williams Real Estate Report - January 2019
Annie Williams Real Estate Report - January 2019Annie Williams Real Estate Report - January 2019
Annie Williams Real Estate Report - January 2019
 
Annie Williams Real Estate Report - February 2020
Annie Williams Real Estate Report - February 2020Annie Williams Real Estate Report - February 2020
Annie Williams Real Estate Report - February 2020
 
Real Estate Board of Greater Vancouver Statistics Package March 2021
Real Estate Board of Greater Vancouver Statistics Package March 2021Real Estate Board of Greater Vancouver Statistics Package March 2021
Real Estate Board of Greater Vancouver Statistics Package March 2021
 
Homestead estates
Homestead estatesHomestead estates
Homestead estates
 
September 2018 Realtor Report
September 2018 Realtor ReportSeptember 2018 Realtor Report
September 2018 Realtor Report
 
October Housing Report for Southwest California
October Housing Report for Southwest CaliforniaOctober Housing Report for Southwest California
October Housing Report for Southwest California
 

En vedette

Revue de presse harissa label
Revue de presse harissa labelRevue de presse harissa label
Revue de presse harissa labelmarouen chikhaoui
 
Linked Data Overview - AGI Technical SIG
Linked Data Overview - AGI Technical SIGLinked Data Overview - AGI Technical SIG
Linked Data Overview - AGI Technical SIGChris Ewing
 
Introduction to MapAction
Introduction to MapActionIntroduction to MapAction
Introduction to MapActionChris Ewing
 
Tdr emballage et charte smsa djebba
Tdr emballage et charte smsa djebbaTdr emballage et charte smsa djebba
Tdr emballage et charte smsa djebbamarouen chikhaoui
 
Using smartphones in humanitarian mapping
Using smartphones in humanitarian mappingUsing smartphones in humanitarian mapping
Using smartphones in humanitarian mappingChris Ewing
 
appel d'offre - achat équipement de laboratoire pour le CTAB
appel d'offre - achat équipement de laboratoire pour le CTAB appel d'offre - achat équipement de laboratoire pour le CTAB
appel d'offre - achat équipement de laboratoire pour le CTAB marouen chikhaoui
 
Building Catastrophe Models using Open Data and Open Source
Building Catastrophe Models using Open Data and Open SourceBuilding Catastrophe Models using Open Data and Open Source
Building Catastrophe Models using Open Data and Open SourceChris Ewing
 
Revue de presse juillet octobre 2016
Revue de presse juillet octobre 2016Revue de presse juillet octobre 2016
Revue de presse juillet octobre 2016marouen chikhaoui
 

En vedette (10)

Revue de presse harissa label
Revue de presse harissa labelRevue de presse harissa label
Revue de presse harissa label
 
Linked Data Overview - AGI Technical SIG
Linked Data Overview - AGI Technical SIGLinked Data Overview - AGI Technical SIG
Linked Data Overview - AGI Technical SIG
 
Newsletter pampat n3
Newsletter pampat n3Newsletter pampat n3
Newsletter pampat n3
 
Introduction to MapAction
Introduction to MapActionIntroduction to MapAction
Introduction to MapAction
 
Tdr emballage et charte smsa djebba
Tdr emballage et charte smsa djebbaTdr emballage et charte smsa djebba
Tdr emballage et charte smsa djebba
 
Using smartphones in humanitarian mapping
Using smartphones in humanitarian mappingUsing smartphones in humanitarian mapping
Using smartphones in humanitarian mapping
 
appel d'offre - achat équipement de laboratoire pour le CTAB
appel d'offre - achat équipement de laboratoire pour le CTAB appel d'offre - achat équipement de laboratoire pour le CTAB
appel d'offre - achat équipement de laboratoire pour le CTAB
 
PPT on NBFCs & CIC in India
PPT on NBFCs  & CIC in IndiaPPT on NBFCs  & CIC in India
PPT on NBFCs & CIC in India
 
Building Catastrophe Models using Open Data and Open Source
Building Catastrophe Models using Open Data and Open SourceBuilding Catastrophe Models using Open Data and Open Source
Building Catastrophe Models using Open Data and Open Source
 
Revue de presse juillet octobre 2016
Revue de presse juillet octobre 2016Revue de presse juillet octobre 2016
Revue de presse juillet octobre 2016
 

Similaire à YTD Crested Butte Real Estate Market Report through November

Santa Cruz County Real Estate Market Report - August 2015
Santa Cruz County Real Estate Market Report - August 2015Santa Cruz County Real Estate Market Report - August 2015
Santa Cruz County Real Estate Market Report - August 2015Liz Kroft
 
The Silver Fern Report - January 2011
The Silver Fern Report - January 2011The Silver Fern Report - January 2011
The Silver Fern Report - January 2011oparvez
 
Concierge Auctions Luxury Homes Market Index
Concierge Auctions Luxury Homes Market IndexConcierge Auctions Luxury Homes Market Index
Concierge Auctions Luxury Homes Market IndexChad Roffers
 
October 2016 Home Sales Report
October 2016 Home Sales ReportOctober 2016 Home Sales Report
October 2016 Home Sales ReportPhil Sveum
 
The Silver Fern Report - July 2010
The Silver Fern Report - July 2010The Silver Fern Report - July 2010
The Silver Fern Report - July 2010oparvez
 
The August Silver Fern Report (Boulder Real Estate)
The August Silver Fern Report (Boulder Real Estate)The August Silver Fern Report (Boulder Real Estate)
The August Silver Fern Report (Boulder Real Estate)oparvez
 
August 2015 Home Sales Report
August 2015 Home Sales ReportAugust 2015 Home Sales Report
August 2015 Home Sales ReportPhil Sveum
 
Sf report april 2010
Sf report april  2010Sf report april  2010
Sf report april 2010oparvez
 
July 2015 Home Sales Report
July 2015 Home Sales ReportJuly 2015 Home Sales Report
July 2015 Home Sales ReportPhil Sveum
 
TownHouseReport2014
TownHouseReport2014TownHouseReport2014
TownHouseReport2014Tres Seippel
 
October 2015 Home Sales Report
October 2015 Home Sales ReportOctober 2015 Home Sales Report
October 2015 Home Sales ReportPhil Sveum
 
2015 10 oct homes sales report
2015 10 oct homes sales report2015 10 oct homes sales report
2015 10 oct homes sales reportSheryl Schroeder
 
Sarasota Market Statistics July 2013
Sarasota Market Statistics July 2013Sarasota Market Statistics July 2013
Sarasota Market Statistics July 2013Sarasota Real Estate
 
December 2009 Statistics
December 2009 StatisticsDecember 2009 Statistics
December 2009 StatisticsNeil Kearney
 
2016 01 jan homes sales report
2016 01 jan homes sales report2016 01 jan homes sales report
2016 01 jan homes sales reportSheryl Schroeder
 
January 2016 Home Sales Report
January 2016 Home Sales ReportJanuary 2016 Home Sales Report
January 2016 Home Sales ReportPhil Sveum
 
November 2015 Home Sales Report
November 2015 Home Sales ReportNovember 2015 Home Sales Report
November 2015 Home Sales ReportSheryl Schroeder
 
November 2015 Home Sales Report
November 2015 Home Sales ReportNovember 2015 Home Sales Report
November 2015 Home Sales ReportPhil Sveum
 

Similaire à YTD Crested Butte Real Estate Market Report through November (20)

Santa Cruz County Real Estate Market Report - August 2015
Santa Cruz County Real Estate Market Report - August 2015Santa Cruz County Real Estate Market Report - August 2015
Santa Cruz County Real Estate Market Report - August 2015
 
The Silver Fern Report - January 2011
The Silver Fern Report - January 2011The Silver Fern Report - January 2011
The Silver Fern Report - January 2011
 
Concierge Auctions Luxury Homes Market Index
Concierge Auctions Luxury Homes Market IndexConcierge Auctions Luxury Homes Market Index
Concierge Auctions Luxury Homes Market Index
 
October 2016 Home Sales Report
October 2016 Home Sales ReportOctober 2016 Home Sales Report
October 2016 Home Sales Report
 
The Silver Fern Report - July 2010
The Silver Fern Report - July 2010The Silver Fern Report - July 2010
The Silver Fern Report - July 2010
 
The August Silver Fern Report (Boulder Real Estate)
The August Silver Fern Report (Boulder Real Estate)The August Silver Fern Report (Boulder Real Estate)
The August Silver Fern Report (Boulder Real Estate)
 
August 2015 Home Sales Report
August 2015 Home Sales ReportAugust 2015 Home Sales Report
August 2015 Home Sales Report
 
Sf report april 2010
Sf report april  2010Sf report april  2010
Sf report april 2010
 
July 2015 Home Sales Report
July 2015 Home Sales ReportJuly 2015 Home Sales Report
July 2015 Home Sales Report
 
TownHouseReport2014
TownHouseReport2014TownHouseReport2014
TownHouseReport2014
 
Marblehead Report
Marblehead ReportMarblehead Report
Marblehead Report
 
October 2015 Home Sales Report
October 2015 Home Sales ReportOctober 2015 Home Sales Report
October 2015 Home Sales Report
 
2015 10 oct homes sales report
2015 10 oct homes sales report2015 10 oct homes sales report
2015 10 oct homes sales report
 
Sarasota Market Statistics July 2013
Sarasota Market Statistics July 2013Sarasota Market Statistics July 2013
Sarasota Market Statistics July 2013
 
December 2009 Statistics
December 2009 StatisticsDecember 2009 Statistics
December 2009 Statistics
 
March 2016 Columbus Ohio Real Estate Market Report
March 2016 Columbus Ohio Real Estate Market ReportMarch 2016 Columbus Ohio Real Estate Market Report
March 2016 Columbus Ohio Real Estate Market Report
 
2016 01 jan homes sales report
2016 01 jan homes sales report2016 01 jan homes sales report
2016 01 jan homes sales report
 
January 2016 Home Sales Report
January 2016 Home Sales ReportJanuary 2016 Home Sales Report
January 2016 Home Sales Report
 
November 2015 Home Sales Report
November 2015 Home Sales ReportNovember 2015 Home Sales Report
November 2015 Home Sales Report
 
November 2015 Home Sales Report
November 2015 Home Sales ReportNovember 2015 Home Sales Report
November 2015 Home Sales Report
 

Dernier

Shapoorji Pallonji Joyville Vista Pune | Spend Your Family Time Together
Shapoorji Pallonji Joyville Vista Pune | Spend Your Family Time TogetherShapoorji Pallonji Joyville Vista Pune | Spend Your Family Time Together
Shapoorji Pallonji Joyville Vista Pune | Spend Your Family Time Togetheraidasheikh47
 
9990771857 Call Girls Dwarka Sector 9 Delhi (Call Girls ) Delhi
9990771857 Call Girls Dwarka Sector 9 Delhi (Call Girls ) Delhi9990771857 Call Girls Dwarka Sector 9 Delhi (Call Girls ) Delhi
9990771857 Call Girls Dwarka Sector 9 Delhi (Call Girls ) Delhidelhimodel235
 
Call Girls in shastri nagar Delhi 8264348440 ✅ call girls ❤️
Call Girls in shastri nagar Delhi 8264348440 ✅ call girls ❤️Call Girls in shastri nagar Delhi 8264348440 ✅ call girls ❤️
Call Girls in shastri nagar Delhi 8264348440 ✅ call girls ❤️soniya singh
 
Low Rate ↬Call Girls in Trilokpuri Delhi ↫8447779280}Escorts Service In Delhi
Low Rate ↬Call Girls in Trilokpuri Delhi ↫8447779280}Escorts Service In DelhiLow Rate ↬Call Girls in Trilokpuri Delhi ↫8447779280}Escorts Service In Delhi
Low Rate ↬Call Girls in Trilokpuri Delhi ↫8447779280}Escorts Service In Delhiasmaqueen5
 
M3M The Line Brochure - Premium Investment Opportunity for Commercial Ventures
M3M The Line Brochure - Premium Investment Opportunity for Commercial VenturesM3M The Line Brochure - Premium Investment Opportunity for Commercial Ventures
M3M The Line Brochure - Premium Investment Opportunity for Commercial Venturessheltercareglobal
 
call girls in ganesh nagar Delhi 8264348440 ✅ call girls ❤️
call girls in ganesh nagar Delhi 8264348440 ✅ call girls ❤️call girls in ganesh nagar Delhi 8264348440 ✅ call girls ❤️
call girls in ganesh nagar Delhi 8264348440 ✅ call girls ❤️soniya singh
 
2k Shots ≽ 9205541914 ≼ Call Girls In Sainik Farm (Delhi)
2k Shots ≽ 9205541914 ≼ Call Girls In Sainik Farm (Delhi)2k Shots ≽ 9205541914 ≼ Call Girls In Sainik Farm (Delhi)
2k Shots ≽ 9205541914 ≼ Call Girls In Sainik Farm (Delhi)Delhi Call girls
 
Properties for Sale in Istanbul with Schools and Parks | Antalya Development
Properties for Sale in Istanbul with Schools and Parks | Antalya DevelopmentProperties for Sale in Istanbul with Schools and Parks | Antalya Development
Properties for Sale in Istanbul with Schools and Parks | Antalya DevelopmentAntalya Development
 
Call Girls In Laxmi Nagar Delhi +91-8447779280! !Best Woman Seeking Man Escor...
Call Girls In Laxmi Nagar Delhi +91-8447779280! !Best Woman Seeking Man Escor...Call Girls In Laxmi Nagar Delhi +91-8447779280! !Best Woman Seeking Man Escor...
Call Girls In Laxmi Nagar Delhi +91-8447779280! !Best Woman Seeking Man Escor...asmaqueen5
 
2k Shot Call girls Aiims Delhi 9205541914
2k Shot Call girls Aiims Delhi 92055419142k Shot Call girls Aiims Delhi 9205541914
2k Shot Call girls Aiims Delhi 9205541914Delhi Call girls
 
Greater Vancouver Realtors Statistics Package April 2024
Greater Vancouver Realtors Statistics Package April 2024Greater Vancouver Realtors Statistics Package April 2024
Greater Vancouver Realtors Statistics Package April 2024VickyAulakh1
 
TENANT SCREENING REPORT SERVICES​ How Tenant Screening Reports Work
TENANT SCREENING REPORT SERVICES​ How Tenant Screening Reports WorkTENANT SCREENING REPORT SERVICES​ How Tenant Screening Reports Work
TENANT SCREENING REPORT SERVICES​ How Tenant Screening Reports WorkTurbo Tenant
 
Girls in Kalyanpuri }Delhi↫8447779280↬Escort Service. In Delhi NCR
Girls in Kalyanpuri }Delhi↫8447779280↬Escort Service. In Delhi NCRGirls in Kalyanpuri }Delhi↫8447779280↬Escort Service. In Delhi NCR
Girls in Kalyanpuri }Delhi↫8447779280↬Escort Service. In Delhi NCRasmaqueen5
 
9990771857 Call Girls in Dwarka Sector 6 Delhi (Call Girls) Delhi
9990771857 Call Girls in Dwarka Sector 6 Delhi (Call Girls) Delhi9990771857 Call Girls in Dwarka Sector 6 Delhi (Call Girls) Delhi
9990771857 Call Girls in Dwarka Sector 6 Delhi (Call Girls) Delhidelhimodel235
 
9990771857 Call Girls in Dwarka Sector 137 Noida (Call Girls) Delhi
9990771857 Call Girls in Dwarka Sector 137 Noida (Call Girls) Delhi9990771857 Call Girls in Dwarka Sector 137 Noida (Call Girls) Delhi
9990771857 Call Girls in Dwarka Sector 137 Noida (Call Girls) Delhidelhimodel235
 
3D Architectural Rendering Company by Panoram CGI
3D Architectural Rendering Company by Panoram CGI3D Architectural Rendering Company by Panoram CGI
3D Architectural Rendering Company by Panoram CGIPanoram CGI
 
9990771857 Call Girls in Dwarka Sector 1 Delhi (Call Girls) Delhi
9990771857 Call Girls in Dwarka Sector 1 Delhi (Call Girls) Delhi9990771857 Call Girls in Dwarka Sector 1 Delhi (Call Girls) Delhi
9990771857 Call Girls in Dwarka Sector 1 Delhi (Call Girls) Delhidelhimodel235
 
Maha Mauka Squarefeet Brochure |Maha Mauka Squarefeet PDF Brochure|
Maha Mauka Squarefeet Brochure |Maha Mauka Squarefeet PDF Brochure|Maha Mauka Squarefeet Brochure |Maha Mauka Squarefeet PDF Brochure|
Maha Mauka Squarefeet Brochure |Maha Mauka Squarefeet PDF Brochure|AkshayJoshi575980
 
Best Deal Virtual Space in Satya The Hive Tata Zudio 750 Sqft 1.89 Cr All inc...
Best Deal Virtual Space in Satya The Hive Tata Zudio 750 Sqft 1.89 Cr All inc...Best Deal Virtual Space in Satya The Hive Tata Zudio 750 Sqft 1.89 Cr All inc...
Best Deal Virtual Space in Satya The Hive Tata Zudio 750 Sqft 1.89 Cr All inc...ApartmentWala1
 
Call Girls in Karkardooma Delhi +91 84487779280}Woman Seeking Man in Delhi NCR
Call Girls in Karkardooma Delhi +91 84487779280}Woman Seeking Man in Delhi NCRCall Girls in Karkardooma Delhi +91 84487779280}Woman Seeking Man in Delhi NCR
Call Girls in Karkardooma Delhi +91 84487779280}Woman Seeking Man in Delhi NCRasmaqueen5
 

Dernier (20)

Shapoorji Pallonji Joyville Vista Pune | Spend Your Family Time Together
Shapoorji Pallonji Joyville Vista Pune | Spend Your Family Time TogetherShapoorji Pallonji Joyville Vista Pune | Spend Your Family Time Together
Shapoorji Pallonji Joyville Vista Pune | Spend Your Family Time Together
 
9990771857 Call Girls Dwarka Sector 9 Delhi (Call Girls ) Delhi
9990771857 Call Girls Dwarka Sector 9 Delhi (Call Girls ) Delhi9990771857 Call Girls Dwarka Sector 9 Delhi (Call Girls ) Delhi
9990771857 Call Girls Dwarka Sector 9 Delhi (Call Girls ) Delhi
 
Call Girls in shastri nagar Delhi 8264348440 ✅ call girls ❤️
Call Girls in shastri nagar Delhi 8264348440 ✅ call girls ❤️Call Girls in shastri nagar Delhi 8264348440 ✅ call girls ❤️
Call Girls in shastri nagar Delhi 8264348440 ✅ call girls ❤️
 
Low Rate ↬Call Girls in Trilokpuri Delhi ↫8447779280}Escorts Service In Delhi
Low Rate ↬Call Girls in Trilokpuri Delhi ↫8447779280}Escorts Service In DelhiLow Rate ↬Call Girls in Trilokpuri Delhi ↫8447779280}Escorts Service In Delhi
Low Rate ↬Call Girls in Trilokpuri Delhi ↫8447779280}Escorts Service In Delhi
 
M3M The Line Brochure - Premium Investment Opportunity for Commercial Ventures
M3M The Line Brochure - Premium Investment Opportunity for Commercial VenturesM3M The Line Brochure - Premium Investment Opportunity for Commercial Ventures
M3M The Line Brochure - Premium Investment Opportunity for Commercial Ventures
 
call girls in ganesh nagar Delhi 8264348440 ✅ call girls ❤️
call girls in ganesh nagar Delhi 8264348440 ✅ call girls ❤️call girls in ganesh nagar Delhi 8264348440 ✅ call girls ❤️
call girls in ganesh nagar Delhi 8264348440 ✅ call girls ❤️
 
2k Shots ≽ 9205541914 ≼ Call Girls In Sainik Farm (Delhi)
2k Shots ≽ 9205541914 ≼ Call Girls In Sainik Farm (Delhi)2k Shots ≽ 9205541914 ≼ Call Girls In Sainik Farm (Delhi)
2k Shots ≽ 9205541914 ≼ Call Girls In Sainik Farm (Delhi)
 
Properties for Sale in Istanbul with Schools and Parks | Antalya Development
Properties for Sale in Istanbul with Schools and Parks | Antalya DevelopmentProperties for Sale in Istanbul with Schools and Parks | Antalya Development
Properties for Sale in Istanbul with Schools and Parks | Antalya Development
 
Call Girls In Laxmi Nagar Delhi +91-8447779280! !Best Woman Seeking Man Escor...
Call Girls In Laxmi Nagar Delhi +91-8447779280! !Best Woman Seeking Man Escor...Call Girls In Laxmi Nagar Delhi +91-8447779280! !Best Woman Seeking Man Escor...
Call Girls In Laxmi Nagar Delhi +91-8447779280! !Best Woman Seeking Man Escor...
 
2k Shot Call girls Aiims Delhi 9205541914
2k Shot Call girls Aiims Delhi 92055419142k Shot Call girls Aiims Delhi 9205541914
2k Shot Call girls Aiims Delhi 9205541914
 
Greater Vancouver Realtors Statistics Package April 2024
Greater Vancouver Realtors Statistics Package April 2024Greater Vancouver Realtors Statistics Package April 2024
Greater Vancouver Realtors Statistics Package April 2024
 
TENANT SCREENING REPORT SERVICES​ How Tenant Screening Reports Work
TENANT SCREENING REPORT SERVICES​ How Tenant Screening Reports WorkTENANT SCREENING REPORT SERVICES​ How Tenant Screening Reports Work
TENANT SCREENING REPORT SERVICES​ How Tenant Screening Reports Work
 
Girls in Kalyanpuri }Delhi↫8447779280↬Escort Service. In Delhi NCR
Girls in Kalyanpuri }Delhi↫8447779280↬Escort Service. In Delhi NCRGirls in Kalyanpuri }Delhi↫8447779280↬Escort Service. In Delhi NCR
Girls in Kalyanpuri }Delhi↫8447779280↬Escort Service. In Delhi NCR
 
9990771857 Call Girls in Dwarka Sector 6 Delhi (Call Girls) Delhi
9990771857 Call Girls in Dwarka Sector 6 Delhi (Call Girls) Delhi9990771857 Call Girls in Dwarka Sector 6 Delhi (Call Girls) Delhi
9990771857 Call Girls in Dwarka Sector 6 Delhi (Call Girls) Delhi
 
9990771857 Call Girls in Dwarka Sector 137 Noida (Call Girls) Delhi
9990771857 Call Girls in Dwarka Sector 137 Noida (Call Girls) Delhi9990771857 Call Girls in Dwarka Sector 137 Noida (Call Girls) Delhi
9990771857 Call Girls in Dwarka Sector 137 Noida (Call Girls) Delhi
 
3D Architectural Rendering Company by Panoram CGI
3D Architectural Rendering Company by Panoram CGI3D Architectural Rendering Company by Panoram CGI
3D Architectural Rendering Company by Panoram CGI
 
9990771857 Call Girls in Dwarka Sector 1 Delhi (Call Girls) Delhi
9990771857 Call Girls in Dwarka Sector 1 Delhi (Call Girls) Delhi9990771857 Call Girls in Dwarka Sector 1 Delhi (Call Girls) Delhi
9990771857 Call Girls in Dwarka Sector 1 Delhi (Call Girls) Delhi
 
Maha Mauka Squarefeet Brochure |Maha Mauka Squarefeet PDF Brochure|
Maha Mauka Squarefeet Brochure |Maha Mauka Squarefeet PDF Brochure|Maha Mauka Squarefeet Brochure |Maha Mauka Squarefeet PDF Brochure|
Maha Mauka Squarefeet Brochure |Maha Mauka Squarefeet PDF Brochure|
 
Best Deal Virtual Space in Satya The Hive Tata Zudio 750 Sqft 1.89 Cr All inc...
Best Deal Virtual Space in Satya The Hive Tata Zudio 750 Sqft 1.89 Cr All inc...Best Deal Virtual Space in Satya The Hive Tata Zudio 750 Sqft 1.89 Cr All inc...
Best Deal Virtual Space in Satya The Hive Tata Zudio 750 Sqft 1.89 Cr All inc...
 
Call Girls in Karkardooma Delhi +91 84487779280}Woman Seeking Man in Delhi NCR
Call Girls in Karkardooma Delhi +91 84487779280}Woman Seeking Man in Delhi NCRCall Girls in Karkardooma Delhi +91 84487779280}Woman Seeking Man in Delhi NCR
Call Girls in Karkardooma Delhi +91 84487779280}Woman Seeking Man in Delhi NCR
 

YTD Crested Butte Real Estate Market Report through November

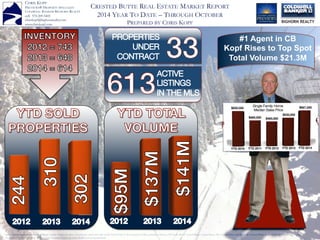
  • 1. Sales Volume numbers represent all Single Family Homes, Condos, Townhomes and Land sales in the North End of the Gunnison Valley, including Almont, CB South, Rural Crested Butte, Crested Butte, Mt. Crested Butte and Rural Mt. Crested Butte as shown in the Gunnison Country Association of Realtors MLS. Information contained herein deemed reliable, but not guaranteed. CHRIS KOPF PREVIEWS® PROPERTY SPECIALIST COLDWELL BANKER BIGHORN REALTY cell: 970.209.5405 chriskopf@bighornrealty.com www.chriskopf.com CRESTED BUTTE REAL ESTATE MARKET REPORT 2014 YEAR TO DATE – THROUGH NOVEMBER PREPARED BY CHRIS KOPF CRESTED BUTTE REAL ESTATE MARKET REPORT 2014 YEAR TO DATE – THROUGH OCTOBER PREPARED BY CHRIS KOPF CHRIS KOPF PREVIEWS® PROPERTY SPECIALIST COLDWELL BANKER BIGHORN REALTY cell: 970.209.5405 chriskopf@bighornrealty.com www.chriskopf.com #1 Agent in CB Kopf Rises to Top Spot Total Volume $21.3M Single Family Home! Median Sales Price
  • 2. Sales Volume numbers represent all Single Family Homes, Condos, Townhomes and Land sales in the North End of the Gunnison Valley, including Almont, CB South, Rural Crested Butte, Crested Butte, Mt. Crested Butte and Rural Mt. Crested Butte as shown in the Gunnison Country Association of Realtors MLS. Information contained herein deemed reliable, but not guaranteed. CHRIS KOPF PREVIEWS® PROPERTY SPECIALIST COLDWELL BANKER BIGHORN REALTY cell: 970.209.5405 chriskopf@bighornrealty.com www.chriskopf.com CRESTED BUTTE REAL ESTATE MARKET REPORT 2014 YEAR TO DATE – THROUGH NOVEMBER PREPARED BY CHRIS KOPF Crested Butte Real Estate Market Report – Year to Date through November, 2014 - All Good 2014 Totals Look Similar to 2013 Results The Crested Butte Real Estate Market started off with a whimper, but is ending similar to 2013 as a result of a very strong Summer and Fall. We see that the 2014 YTD Volume of $141M is a slight increase (3%) over the 2013 total of $137M, and the number of total properties sold YTD in 2014 is 302 vs. 310 in 2013. While the length of the “off-season” shrunk a bit this Fall thanks to a number of Fall events, beautiful autumn colors, and continued visitors. We are in a holding pattern now until the beginning of the year – the ski resort is open and lifts are spinning – but primarily servicing local skiers until the Holidays. There is typically light activity through Christmas – and things start to pick-up around New Years eve. Comparing the monthly totals from 2014 to 2013 we see that while we have arrived at about the same destination, the strong Fall results in 2014 made up for the slower start at the beginning of the Year. Looking at the properties currently Under Contract (33 properties YTD Total $ Volume of Properties Sold YTD Number of Properties Sold Comparing 2013 & 2014 $ Volume of Properties Sold By Month MO. 2013 2014 JAN $8,751,700 $5,773,686 FEB $8,671,475 $7,026,450 MAR $10,261,486 $3,803,000 APR $17,126,400 $8,412,800 MAY $8,539,400 $14,169,200 JUNE $11,327,749 $7,800,189 JULY $13,731,000 $10,012,300 AUG $10,323,420 $24,785,750 SEPT $17,127,511 $22,739,400 OCT $18,102,107 $27,347,015 NOV $13,044,100 $9,369,425 DEC $7,091,625 TOTAL $144,097,973 $141,239,215 JAN FEB MAR APR MAY JUNE JULY AUG SEPT OCT NOV $5,773,686 $7,026,450 $3,803,000 $8,412,800 $14,169,200 $7,800,189 $10,012,300 $24,785,750 $22,739,400 $27,347,015 $9,369,425 2014 YTD $ Volume representing $9.9M) the month of December results will likely be around $6M – and the overall 2014 totals will barely exceed the annual totals from 2013. Interesting stat – The Inventory of the number of Properties for Sale has been dropping over the past few years – looking at the snapshot from November of the previous years we we see: 2012 = 743, 2013 = 648, 2014 = 614
  • 3. Sales Volume numbers represent all Single Family Homes, Condos, Townhomes and Land sales in the North End of the Gunnison Valley, including Almont, CB South, Rural Crested Butte, Crested Butte, Mt. Crested Butte and Rural Mt. Crested Butte as shown in the Gunnison Country Association of Realtors MLS. Information contained herein deemed reliable, but not guaranteed. CHRIS KOPF PREVIEWS® PROPERTY SPECIALIST COLDWELL BANKER BIGHORN REALTY cell: 970.209.5405 chriskopf@bighornrealty.com www.chriskopf.com CRESTED BUTTE REAL ESTATE MARKET REPORT 2014 YEAR TO DATE – THROUGH NOVEMBER PREPARED BY CHRIS KOPF Crested Butte Luxury Real Estate Market - Properties Sold for $1 Million + Year to Date Luxury Properties For Sale in the Crested Butte Area There are a total of 106 properties Listed for over $1M for a total Volume of $217M, including 68 Single Family Homes for sale with Asking Prices over $1M representing $134M in total volume. In historic downtown Crested Butte there are 12 luxury homes for sale with prices ranging from $1.1M to $2.7M and median Asking Price of $1.25M, and Average Price per Sq. Ft. of $570. There are 21 Single Family Homes for sale on Mt. Crested Butte – and a handful representing ski-in/ski-out including 2 in the Prospect Subdivision. There are 2 high-end luxury condos and town homes for sale in Mt. Crested Butte – one at the ski-in/out West Wall (Penthouse unit A-403 Listed for $2.095M), and two across the street at The Villas, there is also 1 luxury condo for sale in downtown Crested Butte at the corner of Gothic & 7th for sale for over $1.1M. There have been 27 properties sold for over $1M YTD – 20 of them have been Single Family Homes, 2 ski-in/out condos (West Wall and Silver Ridge) and 5 riverfront home sites at Wilder on the Taylor. The most expensive single family home sold in the past 16 months has been the $3.9M luxury home sold in Trappers Crossing at CB (5 bedrooms, 5.5 baths, fully furnished). The Luxury volume of $47.2M sold YTD represents 33% of the total volume, and the the 20 Luxury Single Family Homes Sold total of $36.4M comes short of the 27 sales and $46.3M for the same period in 2013. The average sold price for the high-end homes sold is $1.82M; median price $1.48M, and Average Price per sq. ft. was $476. 2014 YTD Luxury Properties $1M+ Sold Total Sold by Category Average Sold Price Total Asking Price by Category Average Asking Price Total Original Price by Category Average Original Price % Difference Original Price vs. Sold Price % Difference Asking Price vs. Sold Price Average Price Per Sq. Foot Count of # Properties Sold Total All Sales $47,705,545 $1,766,872 $54,770,950 $2,028,554 55,573,000 $2,058,259 -14.16% -12.90% 27 Condos & Townhomes $3,282,500 $1,641,250 $3,495,000 $1,747,500 3,445,000 $1,722,500 -4.72% -6.08% $572 2 Single Family Homes $36,423,045 $1,821,152 $41,225,950 $2,061,298 42,028,000 $2,101,400 -13.34% -11.65% $476 20 Mt. Crested Butte $6,008,500 $1,502,125 $6,640,000 $1,660,000 6,740,000 $1,685,000 -10.85% -9.51% $423 4 Mt. CB Single Family Homes $2,726,000 $1,363,000 $3,145,000 $1,572,500 3,045,000 $1,522,500 -10.48% -13.32% $322 2 Crested Butte Single Family Homes $15,427,045 $1,542,705 $16,212,950 $1,621,295 16,561,000 $1,656,100 -6.85% -4.85% $533 10 Skyland Single Family Homes $1,925,000 $1,925,000 $1,950,000 $1,950,000 1,950,000 $1,950,000 -1.28% -1.28% $403 1 Land/Lots $8,000,000 $1,600,000 $10,050,000 $2,010,000 $9,031,000 $1,806,200 -11.42% -20.40% 5 Year Total # Luxury Homes Sold $ Volume Luxury Homes Sold Avg. Price Per Sq. Ft 2009 13 $21,260,000 $396 2010 14 $23,919,100 $411 2011 23 $40,179,500 $427 2012 12 $21,197,500 $379 2013 27 $46,313,130 $425 2014 20 $36,423,045 $476
  • 4. Sales Volume numbers represent all Single Family Homes, Condos, Townhomes and Land sales in the North End of the Gunnison Valley, including Almont, CB South, Rural Crested Butte, Crested Butte, Mt. Crested Butte and Rural Mt. Crested Butte as shown in the Gunnison Country Association of Realtors MLS. Information contained herein deemed reliable, but not guaranteed. CHRIS KOPF PREVIEWS® PROPERTY SPECIALIST COLDWELL BANKER BIGHORN REALTY cell: 970.209.5405 chriskopf@bighornrealty.com www.chriskopf.com CRESTED BUTTE REAL ESTATE MARKET REPORT 2014 YEAR TO DATE – THROUGH NOVEMBER PREPARED BY CHRIS KOPF Median and Average Prices for Condos & Townhomes shows an increase in price points -- given the YTD data we see Median Condo Sales Price at $192,000 and Average at $233,000. Avg. Price per sq. ft. for Condos & Town homes are up 15% year over year from $214 in 2013 to $247 year to date 2014. We see a greater price increase in the Single Family (SF) homes category – Comparing Year to Date (YTD) results from 2014 to prior years we see that the Median Price for Single Family homes has risen from $530,000 to $667,500 and Average SF Home price has risen from $780,000 to $854,000. Given the mix of homes sold this may be a result of the sample set. Avg. Price per sq. ft. for SF Homes are up 12% from $295 (2013) to $330 year to date. Condo Median Sales Price Single Family Home! Median Sales Price Condo Average Sales Price Single Family Home! Average Sales Price What Real Estate is Selling in the Crested Butte area? Condos and Townhomes represents the most transactions (155) and 51% of all transaction, with Single Family homes making up the second largest count (93). Land /Lots Sold (54) represent 18% of the count but only 12% of the total dollar volume sold YTD. There have been 20 single family homes sold for over $1M, and this represents 26% of the overall Volume, but only 7% of the total number of transactions. 2014 YTD TOTALS - CATEGORY $ Volume of Properties Sold % of Total Count of # Properties Sold % of Total Total All Sales $141,239,215 302 Condos & Townhomes $44,619,575 32% 155 51% Single Family Homes $79,428,965 56% 93 31% Mt. Crested Butte $50,402,009 36% 152 50% Mt. CB Single Family Homes $17,097,270 12% 25 8% Crested Butte Single Family Homes $28,994,395 21% 28 9% Skyland Single Family Homes $2,825,000 2% 2 1% CB South Single Family Homes $5,670,800 4% 14 5% Almont $9,239,500 7% 13 4% Land/Lots $17,190,675 12% 54 18% SF Homes Sold > $1M $36,423,045 26% 20 7% Land / Lots Sold YTD Count YTD % YTD 2010 24 15% YTD 2011 48 19% YTD 2012 53 22% YTD 2013 59 18% YTD 2014 54 13%
  • 5. Sales Volume numbers represent all Single Family Homes, Condos, Townhomes and Land sales in the North End of the Gunnison Valley, including Almont, CB South, Rural Crested Butte, Crested Butte, Mt. Crested Butte and Rural Mt. Crested Butte as shown in the Gunnison Country Association of Realtors MLS. Information contained herein deemed reliable, but not guaranteed. CHRIS KOPF PREVIEWS® PROPERTY SPECIALIST COLDWELL BANKER BIGHORN REALTY cell: 970.209.5405 chriskopf@bighornrealty.com www.chriskopf.com CRESTED BUTTE REAL ESTATE MARKET REPORT 2014 YEAR TO DATE – THROUGH NOVEMBER PREPARED BY CHRIS KOPF The detail below represents the past three years data by category. Interesting note for both Buyers and Sellers: after 3 years of price decline, most properties are priced to the Market and offer great value, evidence by % Difference Original Price vs. Sold Price and the % Difference Asking Price vs. Sold Price by Category, on average 9.53% for all property types. 2014 YTD Totals Total Sold by Category Average Sold Price Total Asking Price by Category Average Asking Price Total Original Price by Category Average Original Price % Difference Original Price vs. Sold Price % Difference Asking Price vs. Sold Price Average Price Per Sq. Foot Count of # Properties Sold Total All Sales $141,239,215 467,680 $156,123,158 516,964 162,509,556 538,111 -13.09% -9.53% 302 Condos & Townhomes $44,619,575 287,868 $47,562,058 306,852 49,786,133 321,201 -10.38% -6.19% $247 155 Single Family Homes $79,428,965 854,075 $87,447,900 940,300 90,515,249 973,282 -12.25% -9.17% $330 93 Mt. Crested Butte $50,402,009 331,592 $55,253,848 363,512 56,879,557 374,208 -11.39% -8.78% $266 152 Mt. CB Single Family Homes $17,097,270 683,891 $18,619,950 744,798 19,873,750 794,950 -13.97% -8.18% $255 25 Crested Butte Single Family Homes $28,994,395 1,035,514 $30,691,450 1,096,123 31,416,000 1,122,000 -7.71% -5.53% $455 28 Skyland Single Family Homes $2,825,000 1,412,500 $2,935,000 1,467,500 2,935,000 1,467,500 -3.75% -3.75% $361 2 CB South Single Family Homes $5,670,800 405,057 $5,957,100 425,507 6,106,100 436,150 -7.13% -4.81% $183 14 Almont $9,239,500 710,731 $11,402,500 877,115 10,242,500 787,885 -9.79% -18.97% $3,666 13 Land/Lots $17,190,675 318,346 $21,113,200 390,985 19,997,599 370,326 -14.04% -18.58% 54 SF Homes Sold > $1M $36,423,045 1,821,152 $41,225,950 2,061,298 42,028,000 2,101,400 -13.34% -11.65% $476 20 2013 YTD Totals Total Sold by Category Average Sold Price Total Asking Price by Category Average Asking Price Total Original Price by Category Average Original Price % Difference Original Price vs. Sold Price % Difference Asking Price vs. Sold Price Average Price Per Sq. Foot Count of # Properties Sold Total All Sales $137,006,348 441,956 $148,137,091 477,862 249,121,481 803,618 -45.00% -7.51% 310 Condos & Townhomes $34,948,777 256,976 $37,622,334 276,635 41,534,600 305,401 -15.86% -7.11% $214 136 Single Family Homes $89,660,935 779,660 $96,638,245 840,333 104,764,700 910,997 -14.42% -7.22% $295 115 Mt. Crested Butte $47,259,011 387,369 $51,326,500 420,709 53,549,200 438,928 -11.75% -7.92% $288 122 Mt. CB Single Family Homes $22,133,730 1,106,687 $24,132,500 1,206,625 26,853,400 1,342,670 -17.58% -8.28% $329 20 Crested Butte Single Family Homes $22,013,755 917,240 $23,085,900 961,913 24,767,400 1,031,975 -11.12% -4.64% $433 24 Skyland Single Family Homes $5,012,000 1,002,400 $5,329,000 1,065,800 6,254,000 1,250,800 -19.86% -5.95% $325 5 CB South Single Family Homes $7,438,400 391,495 $7,787,600 409,874 8,078,700 425,195 -7.93% -4.48% $175 19 Almont $1,521,550 190,194 $1,714,300 214,288 1,889,800 236,225 -19.49% -11.24% $154 8 Land/Lots $12,396,636 210,112 $13,876,512 235,195 102,763,781 1,741,759 -87.94% -10.66% 59 SF Homes Sold > $1M $46,313,130 1,715,301 $50,431,000 1,867,815 53,778,000 1,991,778 -13.88% -8.17% $425 27 2012 YTD Totals Total Sold by Category Average Sold Price Total Asking Price by Category Average Asking Price Total Original Price by Category Average Original Price % Difference Original Price vs. Sold Price % Difference Asking Price vs. Sold Price Average Price Per Sq. Foot Count of # Properties Sold Total All Sales $95,106,030 389,779 $107,454,647 440,388 128,457,547 526,465 -25.96% -11.49% 244 Condos & Townhomes $27,324,905 265,290 $30,143,399 292,654 39,297,449 381,529 -30.47% -9.35% $205 103 Single Family Homes $57,049,625 648,291 $63,238,948 718,624 73,057,848 830,203 -21.91% -9.79% $269 88 Mt. Crested Butte $37,106,450 353,395 $43,038,700 409,892 46,857,849 446,265 -20.81% -13.78% $272 105 Mt. CB Single Family Homes $15,555,950 864,219 $17,347,900 963,772 20,713,500 1,150,750 -24.90% -10.33% $277 18 Crested Butte Single Family Homes $15,828,513 633,141 $16,903,698 676,148 18,405,698 736,228 -14.00% -6.36% $341 25 Skyland Single Family Homes $2,605,000 $651,250 $3,013,000 $753,250 $3,113,000 $778,250 -16.32% -13.54% $291 4 CB South Single Family Homes $5,405,300 360,353 $5,610,750 374,050 6,249,950 416,663 -13.51% -3.66% $159 15 Almont $1,895,012 270,716 $2,236,600 319,514 2,192,700 313,243 -13.58% -15.27% $245 7 Land/Lots $10,731,500 202,481 $14,072,300 265,515 15,202,200 286,834 -29.41% -23.74% 53 SF Homes Sold > $1M $21,197,500 1,766,458 $24,061,900 2,005,158 27,824,000 2,318,667 -23.82% -11.90% $379 12
  • 6. Sales Volume numbers represent all Single Family Homes, Condos, Townhomes and Land sales in the North End of the Gunnison Valley, including Almont, CB South, Rural Crested Butte, Crested Butte, Mt. Crested Butte and Rural Mt. Crested Butte as shown in the Gunnison Country Association of Realtors MLS. Information contained herein deemed reliable, but not guaranteed. CHRIS KOPF PREVIEWS® PROPERTY SPECIALIST COLDWELL BANKER BIGHORN REALTY cell: 970.209.5405 chriskopf@bighornrealty.com www.chriskopf.com CRESTED BUTTE REAL ESTATE MARKET REPORT 2014 YEAR TO DATE – THROUGH NOVEMBER PREPARED BY CHRIS KOPF ! Winter Ski Season is Here – CBMR & Many Businesses are Bullish It has been announced by CBMR, the RTA and others that Winter planes and hotel room bookings are up and forecasts look good. We have great snow and lots of events throughout the Crested Butte Ski Season – it is a great time to be in CB! The metric for measuring the Winter Economy are the monthly Sales Tax Revenue results and final results for the season in May. Visitors to our valley in the Winter does result in Real Estate activity - and the more Showings, Offers, Contracts, results in more Sold properties 30-90 days later. Upcoming Winter Events of Note: -  December 13 - Crested Butte Santa Ski & Pub Crawl. cbsantacrawl.com -  December 20 - Winter Solstice Yurt Dinner. events@cbnordic.org -  December 24 & 31 - Torchlight and Santa's Sleighride at Base area. -  January 14-18 – Mountain High Music Festival. mountainhighmusicfest.com Air Deals on American Airlines to/from DFW - Gunnison. 12/18-12/25 and 1/1-1/11, round trip fares starting as low as $319.00. Reservations can be made by calling Crested Butte Travel at 970-349-2287. #1 Agent in Crested Butte, Kopf Rises to the Top - I am very excited to announce that through much hard work, good fortune, and many great clients I rose to the top as the #1 Real Estate Agent in Crested Butte (based on a total Volume of $21.3M at the end of November for the preceding 12 months). How can I help you? This Crested Butte Real Estate Market report and the level of detail is representative of what you can expect from me as your Real Estate Agent. If you are interested in finding out what your existing property is worth, or considering me to represent you as a Buyer, I would appreciate the opportunity to earn your business (or that of a friend you think I could help). For everything Crested Butte Real Estate– visit www.chriskopf.com. Contact me at: (970) 209-5405, or chriskopf@bighornrealty.com Thanks, Chris Kopf Under Contract Of the 33 properties Under Contract, 17 are Condos/Townhomes, only 6 are Single Family homes and 10 are lots. At the end of November these 33 properties under contract represents $9.9M compared with 40 properties Under Contract and $16.7M at the end of October and $40M at the end of September. Active Listings There are 614 properties For Sale in our market representing $400M. We have seen a steady decrease in local inventory for sale, but we still have lots of properties for sale – and some great values. All Properties Under Contract Total Under Contract by Asking Price Average Under Contract by Asking Price Count of # Properties Under Contract Total All Properties Under Contract $9,939,000 $301,182 33 Condos & Townhomes $3,784,400 $222,612 17 Single Family Homes $2,843,100 $473,850 6 Mt. Crested Butte $3,909,400 $229,965 17 Mt. CB Single Family Homes $0 None 0 Crested Butte Single Family Homes $549,000 $549,000 1 Skyland Single Family Homes $0 None 0 CB South Single Family Homes $1,699,100 $424,775 4 Land/Lots $3,311,500 $331,150 10 SF Homes > $1M $1,100,000 $1,100,000 1 Almont $0 None 0 35 Acre SF Homes $0 None 0 All Current Listings Total Current Listing Price by Category Average Listing Price Count of # Properties on the Market Total All Current Listings $400,410,864 $652,135 614 Condos & Townhomes $66,006,639 $360,692 183 Single Family Homes $184,069,698 $1,252,175 147 Mt. Crested Butte $158,385,039 $700,819 226 Mt. CB Single Family Homes $62,279,600 $1,415,445 44 Crested Butte Single Family Homes $27,013,900 $1,125,579 24 Skyland Single Family Homes $14,611,999 $1,328,364 11 CB South Single Family Homes $5,714,100 $519,464 11 Almont $12,104,670 $281,504 43 Land/Lots $150,334,527 $529,347 284 SF Homes > $1M $133,783,698 $1,967,407 68 35 Acre SF Homes $36,098,999 $2,005,500 18