SlideShare une entreprise Scribd logo
1  sur  48
Télécharger pour lire hors ligne
ECONOMYMATTERS
Right to Fair Compensation
and Transparency in Land
Acquisition,
Rehabilitation &
Resettlement
Bill, 2013
Volume 01 No. 08August - September 2013
Our major neighboring economies- Sri Lanka, Bangladesh, Pakistan and Nepal - too are
facing the heat as both global slowdown and country specific factors have stunted their
domestic economic growth. The Sri Lankan economy bounced back strongly after the end
of the civil war, but has not been immune to the global headwinds. Bangladesh has been
fast emerging as a manufacturing hub in view of its low labour cost. Pakistan, on the other
hand, finds itself embroiled in the worst ever fiscal deterioration due to inefficient
performance of various government sector enterprises and the mounting cost of
maintaining internal security in the country. Nepal is facing the classic macroeconomic
dilemma of low growth and high inflation. Going forward, the growth outlook in these
economies will be contingent upon the pace of recovery of the advanced economies and
theirinternaldomesticresilience.
The domestic scenario looks equally challenging at present, with the first quarter GDP
numbersconfirmingthatwearenotoutofthewoodsasyet.Withmonsoonsbeingnormal,
a good agricultural performance coupled with rise in rural wages would help bolster rural
demand. But, that by itself is not adequate, when the other indicators are all southward
bound. There are no visible signs of investment pick up as investor sentiments continue to
be very low. A weak rupee, tight liquidity, high cost of funds, procedural delays, etc are all
cominginthewayofaninvestmentrevival.AcoordinatedeffortfromtheGovernmentand
the RBI is required to ensure that this vicious cycle is broken. Hastening disinvestment of
public sector units, ensuring coal supplies to the power sector, promoting competition in
the mining sector and ensuring speedy implementation of Delhi Mumbai Industrial
Corridor (DMIC), all of which require non-legislative action, would be seen as positive
developments.
The Right to Fair Compensation, Resettlement, Rehabilitation and Transparency in Land
Acquisition Bill 2013 will be a milestone since it is the first ever attempt to combine
Resettlement of Project Affected People and their Rehabilitation (R&R) along with land
acquisition. Besides, the new Bill provides a prominent role for Government in land
acquisition process for the Industry, which is a very welcome step. Industry however
continuesto have apprehensionson some of the key provisionsof the Bill. These pertainto
compensation package and R&R entitlements; Consent Clause; Acquisition of Irrigated
Multi-Crop Land; Retrospective Applicability of the Bill; Return of Un-utilised Land etc.
Besides, the process of land acquisition, as proposed in the new Bill is highly complex and
time taking, stretching up to a minimum of 56 Months. While the objective should be
improving quality of life of affected families post land acquisition, it is imperative to
streamline the land acquisition mechanism in the country in a manner that balances the
interestsofaffectedfamilieswithindustryaffordability.
Chandrajit Banerjee
Director-General, CII
1 AUGUST-SEPTEMBER 2013
FOREWORD
DISCLAIMER
Copyright©2013byConfederationofIndianIndustry(CII),Allrightsreserved.
Nopartofthispublicationmaybereproduced,storedin,orintroducedintoaretrievalsystem,ortransmittedinanyformorby
any means (electronic, mechanical, photocopying, recording or otherwise), without the prior written permission of the
copyright owner. CII has made every effort to ensure the accuracy of information presented in this document. However,
neitherCII noranyofitsofficebearersoranalystsoremployeescanbeheld responsibleforanyfinancialconsequencesarising
outoftheuse ofinformationprovidedherein.However,incaseofanydiscrepancy,error,etc., samemayplease be broughtto
thenoticeofCIIforappropriatecorrections.
Published by Confederation of Indian Industry (CII), The Mantosh Sondhi Centre; 23, Institutional Area, Lodi Road, New Delhi-
110003(INDIA),
Tel:+91-11-24629994-7,Fax:+91-11-24626149;Email:info@cii.in;Web:www.cii.in
2ECONOMY MATTERS
TheConfederationofIndianIndustry(CII)workstocreateandsustainanenvironmentconducivetothedevelopmentofIndia,
partneringindustry,Government,andcivilsociety,throughadvisoryandconsultativeprocesses.
CII is a non-government, not-for-profit, industry-led and industry-managed organization, playing a proactive role in India's
development process. Founded over 118 years ago, India's premier business association has over 7100 members, from the
private as well as public sectors, including SMEs and MNCs, and an indirect membership of over 90,000 enterprises from
around257nationalandregionalsectoralindustrybodies.
CII charts change by working closely with Government on policy issues, interfacing with thought leaders, and enhancing
efficiency, competitiveness and business opportunities for industry through a range of specialized services and strategic
globallinkages.Italsoprovidesaplatformforconsensus-buildingandnetworkingonkeyissues.
Extending its agenda beyond business, CII assists industry to identify and execute corporate citizenship programmes.
Partnerships with civil society organizations carry forward corporate initiatives for integrated and inclusive development
across diverse domains including affirmative action, healthcare, education, livelihood, diversity management, skill
development,empowermentofwomen,andwater,tonameafew.
The CII Theme for 2013-14 is Accelerating Economic Growth through Innovation, Transformation, Inclusion and Governance.
Towards this, CII advocacy will accord top priority to stepping up the growth trajectory of the nation, while retaining a strong
focus on accountability, transparency and measurement in the corporate and social eco-system, building a knowledge
economy,andbroad-basingdevelopmenttohelpdeliverthefruitsofprogresstoall.
With63offices,including10CentresofExcellence,inIndia,and7overseasofficesinAustralia,China,Egypt,France,Singapore,
UK, and USA, as well as institutional partnerships with 224 counterpart organizations in 90 countries, CII serves as a reference
pointforIndianindustryandtheinternationalbusinesscommunity.
ABOUT CII Research
The CII Research team regularly tracks economic, political and business developments within India and abroad to comment on
theemergingeconomicscenariofortheIndiancorporatesector.Ittrackspolicydevelopments,offerscomprehensiveanalysis
of industries and comments on and analyzes the economic climate through its regular publications– Economy Matters,
BusinessOutlookSurveyand,FortnightlyEconomicUpdates.
Wehavein-houseexpertiseinprovidingthemostcomprehensive,in-depth,unbiasedandincisiveanalysisandforecastsonthe
Indian economy and various sectors. CII Research is also well versed and well equipped to offer customized research based
consultancy services on any theme. It has been catering to the needs of various stakeholders including industries, business
houses and government providing meaningful insights about the prevailing trends, outlook on likely future trends, factors
behind these trends, existing government policies and policy recommendations with an objective to help stakeholders in
better understanding of the issues at hand. The objective of CII Research is to assist stakeholders in taking more informed and
strategicdecisionswithduefocusontheattainmentofshorttermaswellaslongtermgoals. Formoredetailsandtoadvertise
inourproducts,writetousatecoresearch@cii.in
CONTENT
Cover Story
The passage of Land Acquisition
Bill by both Houses of Parliament
has brought little cheer to the
industry as there are concerns on
some of its provisions.Cost of land
acquisition is likely to increase by
3-3.5 times, making industrial
projects unviable and raising costs
intheoveralleconomy.Wediscuss
the key provisions of the new Bill
andhowitwouldbringoutabouta
change in the existing scenario in
thismonth’sSpecialArticle.
3 AUGUST-SEPTEMBER 2013
Inside This Issue
Executive Summary.................................................................04
GDP Forecasts Scaled Down for 2013-14.......................07
T A X E S
Global Trends
08
Deciphering Trends in the Major
South Asian Economies
Domestic Trends
GDP, IIP, Inflation & External Sector
15
Taxation
Draft Safe Harbour Rules - Do they Bridge or
Widen the Taxpayer-Exchequer Divide?
22
Sector in Focus
Capital Goods
27
Special Article
Right to Fair Compensation and Transparency
in Land Acquisition, Rehabilitation &
Resettlement Bill, 201334
Corporate Performance
Industry Under Pressure as Growth
Dips Further
24
Economy Monitor ................................................................... 43
Special Feature
Green Manufacturing: The Next
Big Opportunity
40
GlobalTrends
DomesticTrends
CorporatePerformance
ThelargeSouthAsianeconomies(ex-India),viz,SriLanka,
Bangladesh, Pakistan and Nepal are facing varied sets of
problems precipitated as a result of the global slowdown
and country specific factors. The Sri Lankan economy has
bounced back strongly after the end of the civil war, but
has not been immune to global headwinds. Bangladesh
has been fast emerging as a manufacturing hub in view of
its low labour cost. Pakistan on the other hand is facing
mounting difficulties in the wake of sharp increase in
fiscal deficit coupled with internal security strife. The
smallest economy of the region, Nepal on the other hand
is facing the classic macroeconomic dilemma of low
growth and high inflation. Going forward, the growth
outlook in these economies will be contingent upon the
pace of recovery of the advanced economies and their
internaldomesticresilience.
GDP growth moderated to its more than four-year low of
4.4 per cent in the first quarter GDP growth dropped to a
four-year low of 4.4 per cent of the current fiscal as
compared to 4.8 per cent in the quarter before. This is the
lowest quarterly growth rate since March 2009, when the
global financial crisis was at its peak. The downslide was
drivenbyaweakindustrialperformance,whichslippedto
a its multi-year low. Inflation on the other hand has
continued to accelerate, rising to 6.1 per cent in August
2013mainlyduetohighfoodprices.Ontheexternalfront,
improvementintheglobalscenariohasprovidedafillipto
exports growth, which accelerated to 13 per cent in
August 2013, while imports contracted due to subdued
demandintheeconomyandimpactofaweakRupee.
The deepening economic slowdown, rising interest rates,
tight liquidity, declining investments and depreciating
rupee are slowly taking a toll on India Inc's financial
performance with majority of companies witnessing a
decline in net profits for the past few quarters. The
corporateresultsattheendoffirstquarter(April-June)of
the current fiscal painted a rather gloomy picture as the
financial performance of Indian companies deteriorated.
While revenues plummeted sharply, corporate sector
continued to pull expenses down against the backdrop of
a clouded economic outlook. However, the reduction in
expenditure costs was not large enough to provide to
cushion the bottom-line of the firms. Consequently, there
was de-growth witnessed in profit-after-tax (PAT) on an
aggregate basis in the first quarter of 2013-14. Margins,
bothnetandgrosssawandeteriorationinthequartertoo,
reflecting the fall in profitability. Our analysis is based on
the financial performance of balanced panel of 2,701 firms
(extractedonAugust29,2013).
Capital goods sector is of strategic importance for the
Indian economy. Being large and diverse in nature and
playing a critical role in production process, the sector has
high multiplier effect on the overall growth of the
economy. The sector not only determines the pace of
economicexpansionbut also gets influenced by the same.
However, the negative growth recorded by the capital
goods sector over the last two years is a matter of
concern. Declining production in the sector was reflected
intheimportsofcapitalgoodstoo,whichwitnessedsharp
increase over the last decade or so, supported by a
relatively low rate of customs duty in the range of 0.0-7.5
per cent. Poor performance of the sector has much to do
withthelowcostcompetitivenessofthesector,whichhas
magnified in the face of the economic slowdown. While
revival of manufacturing growth is critical for capital
goods sector, healthy growth performance of capital
goodssectortoocanhelptherevivalprocess.
The passage of Land Acquisition bill by both Houses of
Parliamenthasbroughtlittlecheertotheindustryasthere
are concerns on some of the provisions of the Bill. Cost of
land acquisition is likely to increase by 3-3.5 times, making
industrial projects unviable and raising costs in the overall
Indianeconomy.TheBillwouldalsoleadtomajordelaysin
theprocessofLandAcquisitionastakingtheconsentof80
per cent of affected families for Private Sector and 70 per
cent of affected families for Public Private Partnership
(PPP) Projects under 'Public Purpose' in the Bill would
make the process of obtaining consent a very long drawn
out process. Further, retrospective applicability of the Bill
would severely affect the on-going industry projects as re-
starting the entire land acquisition process would lead to
avoidable delays and consequent cost over-runs. CII
however does appreciate the holistic nature of the Bill and
role of government in acquiring land. However, at a time
when major projects are stalled and India's global
competitiveness is eroding, a more facilitative land
acquisition process would have helped long-term growth
andrestoreinvestorsentiments.
Sector in Focus: Capital Goods
SpecialArticle
EXECUTIVE SUMMARY
4ECONOMY MATTERS
ECONOMYMATTERS
n
n
n
Keeps readers abreast of global & domestic
economic developments
Monthly Journal of top management of 8000
companies
Read by CII Members, Thought Leaders,
Diplomats, Policy Makers, MPs and other
decision makers
The Facts
n
n
n
n
n
n
Domestic Trends
Corporate Performance
Sector in Focus
Special Article
Economy Monitor
Global Trends
The Coverage
CII invites full-page* Advertisements for
this flagship document at an attractive rate
of Rs 50,000 per issue and Rs 5 lakh for 12
issues.
For more details, Please Contact:
Confederation of Indian Industry
The Mantosh Sondhi Centre, 23, Institutional Area, Lodi Road, New Delhi- 110003 (INDIA)
Tel : +91-011-24629994-7, Fax: +91-011-24626149; Email: Ecoresearch@cii.in
Dr. Danish A. Hashim, Director- Economic Research
GDP FORECAST
GDP Forecasts Scaled Down for 2013-14
(y-o-y%) Old Forecasts New Forecasts
BNP Paribas 5.2 3.7
HSBC 5.5 4.0
Goldman Sachs 6.4 4.0
Standard Chartered 5.1 4.1
Nomura 5.0 4.2
JP Morgan 5.5 4.7
Macquarie 6.2 5.3
CRISIL 5.5 4.8
RBI 5.7 5.5
PM Economic Advisory Council 6.4 5.3
CII 6.0-6.4 5.3-5.8
7 AUGUST-SEPTEMBER 2013
Deciphering Trends in the Major
South Asian Economies
below trend performance by the agriculture and
services sectors, which grew at 2 per cent and 4.3 per
cent, respectively. Services sector is the most dominant
sector of the Sri Lankan economy, having a share of
above 50 per cent in the total GDP, followed by industry
at around 30 per cent and agriculture constituting the
remaining. The sharp deceleration witnessed in
agriculture was due to the drop in production of rubber
due to lower global prices and unfavourable rainfall for
tapping activities. Amongst the services sector,
transport & communication and hotels & restaurant
sectors grew by 9.5 per cent and 18.6 per cent
respectively.
SriLanka
S
GDPGrowth
ri Lanka's GDP in the first quarter (January-March)
of the current year grew at 6.0 per cent as
compared to 8.0 per cent in the same quarter of the last
year. The subdued performance was underpinned by a
GLOBAL TRENDS
8ECONOMY MATTERS
(y-o-y%) 1Q:2011 1Q:2012 1Q:2013
Agriculture -4.4 12.0 2.0
Industry 11.1 10.8 10.7
Services 9.5 5.8 4.3
OverallGDP 8.0 8.0 6.0
Source: Department of Census & Statistics, Government of Sri Lanka
Yearly GDP growth rate in Sri Lanka (January-December)
the same period last year. Looking ahead, inflation is
expected to remain in single-digit during the remainder
of 2013, and in mid-single digits in 2014. Considering the
subdued inflationary pressures prevalent in the
economy currently, the Monetary Board in its meeting,
th
heldon15 August2013,wasoftheviewthatthecurrent
monetary policy stance is appropriate, and therefore,
decided to maintain the Repurchase rate and the
Reverse Repurchase rate of the Central Bank of Sri
Lanka unchanged at 7.00 per cent and 9.00 per cent,
respectively.
Inflation
The prudent demand management policies along with
favourable supply conditions have resulted in a
continued low inflation environment in Sri Lanka.
Inflationhasremainedat singledigitlevels for4 and half
years with headline inflation (year-on-year), as
measured by the Colombo consumers' price index
(base: 2006/07=100) CCPI for first seven months of 2013
standing at 7.5 per cent as compared to 6.7 per cent in
3.8
6.3
12
10
8
6
4
2
0
Jan-12
Mar-12
May-12
Jul-12
Sep-12
Nov-12
Jan-13
Mar-13
May-13
Jul-13
CPI Inflation in Sri Lanka (y-o-y %)
Source: Department of Census & Statistics, Government of Sri Lanka
On the exchange rate front, following the general trend
of depreciation against the US dollar of the other major
currencies in the region, the Sri Lankan Rupee too fell to
a near 10-month low in August 2013 due to dollar
demand by importers and capital outflows. The rupee
has fallen around 4 per cent since June 7, 2013 as foreign
investors pulled out of Sri Lankan bonds and other
emerging market assets due to a rise in U.S. treasury
yields.
Trade
Intheexternalsector,merchandiseexportsinJune2013
showed some turnaround, recording a positive year-on-
year growth after the decline observed in the past 15
months. The cumulative performance in merchandise
trade depicts a salutary 7.1 per cent decline in the trade
deficit for the first six months of 2013. Earnings from
tourism and workers' remittances have continued to
improve, while the financial inflows have been
substantialinthefirsthalfoftheyear.
key factor behind this was slower growth in agriculture,
which according to these provisional numbers has
slowed from 3.1 per cent in 2011-12 to 2.2 per cent in 2012-
13. This was largely due to the base effect of two
consecutive years of record growth, lower output due
to the falling price of paddy/rice and also due to
weather-related disruptions. Yet, the industrial growth,
which is the sector most affected by access to timely
credit,isestimatedat9.0percentin2012-13,higherthan
the 8.9 per cent in 2011-12, driven in large part by faster
growth of construction and small scale industries. On
Bangladesh
GDPGrowth
In 2012-13 (July-June), Bangladesh economy was faced
with the challenges of rising inflation and balance of
payments pressures stemming largely from a sudden
surgeinoilimports. Accordingly,theGDPfortheannual
year came in lower at 6.0 per cent as compared to 6.2
per cent in the previous fiscal. Growth was also lower
than the previous five-year average of 6.2 per cent. A
9 AUGUST-SEPTEMBER 2013
fiscal, Bangladesh Bank (Central Bank of Bangladesh)
forecasts that the output growth is unlikely to deviate
significantly from the last ten year average of 6.2 per
cent.
the other hand, growth of services sector marginally
slowed down to 5.7 per cent in 2012-13 from 5.9 per cent
in 2011-12 as the retail and wholesale trade sectors were
particularly affected. Looking ahead to the current
(y-o-y%) 2010-11 2011-12 2012-13(P)
Agriculture 5.1 3.1 2.2
Industry 8.2 8.9 9.0
Services 6.2 6.0 5.7
OverallGDP 6.7 6.2 6.0
Source: Bangladesh Bank
Note: P- Provisional
GDP Growth Rate in Bangladesh in Fiscal Year (July-June)
using the 1995-96 base. The risks to the inflation target
stem partly from likely wage increases, in both the
public and private sectors, which will further add to
existing aggregate demand pressures. Consequently,
the expected monetary stance of the Central Bank of
Bangladesh for the second-half of the current fiscal
(July-December 2013) states maintaining the repo rates
and reserve requirement ratios unchanged following
the 50 bps rate cut in January 2013, in addition to
bringing down average inflation to 7 per cent (using the
1995-96base).
Inflation
Average inflation, using the 1995-96 base year, has been
declining steadily over the past fifteen months, from a
peak of 10.9 per cent in February 2012 to 7.7 per cent in
June 2013. This decline was driven by a steady fall in
point-to-point food and non-food inflation until October
2012 when food inflation bottomed out at 5.6 per cent.
Since then, food inflation has begun to rise and in June
2013 came in at 8.5 per cent. For the current fiscal, the
inflation target announced in the Budget is 7.0 per cent,
10.6
7.7
11
10
9
8
7
Jun-12
Jul-12
Aug-12
Sep-12
Oct-12
Nov-12
Dec-12
Jan-13
Feb-13
Mar-13
Apr-13
May-13
Jun-13
CPI Inflation in Bangladesh (y-o-y%)
Source: Bangladesh Bank
2012-13, partly reflecting the significant fall in food
import demand, lower petroleum imports as well as
slower demand for imports related to manufacturing
output. The capital account shows that foreign direct
investment is projected to have increased from US$1.2
billion in 2011-12 to US$1.3 billion in 2012-13. Remittances
remain an important source of foreign capital for the
Trade
In the external sector, the current account balance
(CAB) continued to be in surplus of US$2004 million in
2012-13,onthebackofincreasinginflowsofremittances,
continued buoyant export expansion, and declining
imports. Import growth continued to remain sluggish in
10ECONOMY MATTERS
appreciated 2.6 per cent between January 1st-June 30th
2013 and real exchange rate data indicates a marginal
impact on export competitiveness. However, Central
Bank's interventions in the foreign exchange market
have limited this loss significantly by slowing the
appreciationoftheTaka.
country. Remittances have been buoyed by larger
numbersofBangladeshiworkersmovingabroadin2011-
12 as well as real wage growth in the Middle East
followingthe'ArabSpring'events.
The Central Bank has been also working to rein in the
excessive volatility in the exchange rate. The Taka
(US$million) 2010-11(Actual) 2011-12(P) 2012-13(Estimation)
CurrentAccountBalance -1549 151 2004
CapitalAccount 642 469 535
FinancialAccount 514 785 2347
OverallBalance -656 494 4886
Source: Bangladesh Bank
Note: P- Provisional
Bangladesh's Balance of Payments
growth rate for the past five years has remained as low
as 3 per cent, which is alarming when compared to the
2.1percentgrowthinthepopulation.Performanceofall
the three sub-sectors, viz, agriculture, industry and
services remained subdued during the year. For the
current fiscal, government is targeting 4.4 per cent GDP
growth. Though the new government that came in May
2013 is expected to provide some clarity on the political
front, power shortages and security conditions
continuetobestrongimpedimentstogrowth.
Pakistan
GDPGrowth
Embroiled in an acute energy crisis since the last many
years, Pakistan economy continues to face challenges
on all fronts. The data for the GDP in Pakistan, which is
releasedonanannualbasis,showsthatfor2012-13(July-
June),theGDPgrewbymerely3.6percentascompared
to the annual plan target of 4.3 per cent. The average
2012-13 2011-12
Growth(y-o-y%) Shares(%) Contribution(%) Growth(y-o-y%)
Agriculture 3.3 21.4 0.7 3.5
Industry 3.5 20.9 0.7 2.7
Services 3.7 57.7 2.1 5.3
OverallGDP 3.6 100 3.6 4.4
Source: State Bank of Pakistan
GDP Growth in Pakistan (July-June)
impactofthedepreciationofthePakistaniRupee.Inthe
latest budget the government has announced an
increase of 1 percentage point in the General Sales Tax
(GST),from16percentto17percent,andchangesinthe
tax structurefor some goods & services. In addition, the
government is considering a phase-wise upward
adjustment in electricity tariff. Therefore, there is a risk
Inflation
Inflation continues to remain high, with July 2013 CPI
inflation reading coming at a 10-month high of 8.3 per
cent as compared to 9.6 per cent in the same month of
last year mainly due to rise in food prices and adverse
11 AUGUST-SEPTEMBER 2013
economy, the State Bank of Pakistan (SBP) chose to cut
its policy rate by 50 bps, to 9 per cent in its policy review
held on June 24th, 2013, thus giving more weight to the
declininggrowthprospects.
that average inflation for the current fiscal could exceed
the announced target of 8 per cent for the year.
Notwithstanding, the rising inflationary pressures in the
FiscalDeficit
Another significant challenge facing the economy is the
rising fiscal deficit. The centre fiscal deficit for 2012-13 is
estimated to be 8.8 per cent (of GDP), which is nearly
twicetheinitialtargetof 4.7 per cent. The source of
deviation is structural and well known - low tax
revenues due to absence of meaningful tax reforms and
continuation of untargeted subsidies without
comprehensively addressing the energy sector
problems. The high inefficiency of the public sector
enterprises (PSEs) is worth highlighting in this context.
For the current year, the federal government has
announcedaprovisionalfiscaldeficitestimateof6.3per
cent.
12.3
8.3
14
12
10
8
6
4
May-12
Jun-12
Jul-12
Aug-12
Sep-12
Oct-12
Nov-12
Dec-12
Jan-13
Feb-13
Mar-13
Apr-13
May-13
Jun-13
Jul-13
CPI Inflation in Pakistan (y-o-y%)
Source: State Bank of Pakistan
12ECONOMY MATTERS
1980s 1990s 2000s FY11 FY12 FY13 E
7.0 6.8
4.7
6.6
8.5 8.8
Fiscal Deficit (as a % of GDP) in Pakistan
Source: State Bank of Pakistan
Note: E- Estimated
Trade
On the external front, the exports from Pakistan during
2012-13 stood at US$24.5 billion, marginally higher than
US$23.6 billion recorded in 2011-12. Energy shortages
and slow economic growth in developed world
economieswerethemajorreasonsbehindtherelatively
slow expansion in exports. Almost all the exports
earnings originated from textile manufactures, as the
country's exports are concentrated in a few items like
cotton & cotton manufactures, leather, rice and few
others. Imports in to the country were recorded at
US$44.9 billion during 2012-13. The trade deficit, hence,
during 2012-13 amounted to US$20.4 billion as against
the US$21.3 billion deficit recorded during the same
periodoflastyear.
On the exchange rate front, the Pakistani Rupee
continues to be battered against the US$. The Rupee
droppedtoafreshall-timelowof103.47perUSdollaron
August 21, 2013, a depreciation of over 9 per cent on an
annual basis. The widening current account deficit,
slipped to 1.6 per cent in 2012-13 as compared to 3.0 per
cent in the previous year. The services sector in 2012-13,
however, expanded by 6.0 per cent, much higher than
4.5 per cent last year. Nepal's economy has been
embroiled in a major political crisis, with the elections
now being postponed to November 2013. The country
has been without a parliament for more than a year
now, after major political parties missed yet another
deadline to write a constitution and reach a consensus
on the structure of the government. The political
paralysis has deeply affected the economy. The strong
factor for Nepal's economy has been the remittances
sent by its residents staying outside; which constitutes
roughly 22 per cent of the country's gross domestic
product.
Nepal
GDPGrowth
According to the preliminary estimates of the Central
Bureau of Statistics (CBS), the Real GDP is estimated to
have grown by 3.6 per cent in 2012-13 compared, lower
than 4.5 per cent in the previous year. The deceleration
in growthwas underpinnedby subdued performanceby
theagricultureandindustrialsector.Agriculturegrewby
a tepid 1.3 per cent mainly due to unfavourable
monsoonswhichledtodecreaseintheproduceofmajor
crops. Due to various structural bottlenecks, including
energy shortage, industrial labour relation and delay in
adopting a full-fledged budget, industrial growth
(y-o-y%) 2011-12 2012-13(P)
Agriculture 4.9 1.2
Industry 3.0 1.6
Services 4.5 6.0
OverallGDP 4.5 3.6
Source: Nepal Rastra Bank
Note: P- Provisional
GDP Growth in Nepal (fiscal year starting mid-July)
Inconclusion,fromtheanalysisofthemajorSouthAsian
economies, it emerges that they too are facing
headwinds emanating from the tough global
macroeconomic scenario. Out of the four major
economies of South Asia, Pakistan appears to be in the
most precarious state, troubled by deteriorating law
and order, energy deficiencies, high inflation and fiscal
deficit, and dip in the external aid. The currencies of all
the four economies have witnessed sharp depreciation
in the last few months, in line with the evolving global
developments. Going forward, the growth outlook in
these economies will be contingent upon the pace of
recovery of the advanced economies and their internal
domesticresilience.
Inflation
Annual average inflation based on consumer price index
wasestimatedat9.9percentin2012-13,comparedto8.3
per cent in the previous year. Additional pressure on
inflation has emerged as a result of a number of factors
such as decline in food production due to unfavorable
weather, weak supply situation, energy crisis,
devaluation of Nepalese currency, increase in the price
of petroleum products and Indian inflation. The
monetary policy formulated by the Central Bank of
Nepal for the current fiscal, adopted an accommodative
policy stance to facilitate higher economic growth of 5.5
per cent during the year by making adequate provisions
ofcreditalongwithcontaininginflationat8percent.
excessive government borrowing from State Bank,
absenceofforeigninflows,increasingoilimports,lackof
foreign investment and repayments to the International
Monetary Fund are the prominent reasons behind the
constantdepreciationofPakistaniRupee.
13 AUGUST-SEPTEMBER 2013
14ECONOMY MATTERS
OtherMajorGlobalDevelopmentsduringtheMonth
1. US GDP in the second quarter of 2013 was revised upwards to 2.5 per cent on an annualised basis as compared
to initially estimated 1.7 per cent. Expansion in the second quarter - faster than the annualized growth rate in
the first quarter of 1.1 per cent - was driven by gains in consumer spending, exports, private inventory
investment,non-residentialfixedinvestmentandresidentialfixedinvestment.
2. In US, non-farm payrolls (NFP) increased by 169K in August 2013, lower than market expectations of an
increase of 180K. Meanwhile, total job addition for July was revised lower from 162K to 104K, while that for
Junewasrevisedfrom188Kto172K.
3. Real GDP in Euro Area posted a growth of 0.3 per cent on q-o-q basis in the second quarter of 2013, marking its
first expansion since third quarter of 2011. In y-o-y terms though, GDP contracted 0.5 per cent, slower than a
contractionof1.0percentinthepreviousquarter.
4. Real GDP in UK posted a growth of 0.7 per cent on q-o-q basis - revised up from previously estimated 0.6 per
cent - in second quarter of 2013, as against a growth of 0.3 per cent in the previous quarter. In y-o-y terms also,
GDPincreased1.5percentlastquarter,markingthehighestgrowthsincefirstquarterof2011.
5. Headline inflation softened in UK for the second consecutive month to 2.7 per cent in August 2013, as against
2.8 per cent in the previous month. Core inflation, on the other hand, was unchanged at 2.0 per cent last
month.The deceleration in inflation was primarily due to lower contribution by 'transport' and 'clothing &
footwear'sectors,whilearisein'furniture&householdservices'partiallyoffsetthedeceleration.
6. The Bank of England (BoE) kept its policy rate unchanged at 0.5 per cent and the quantum of Asset Purchase
th
Facility(APF)wasalsoretainedatGBP375billioninitsmonetarypolicymeetingheldon5 September2013.
7. Government's Purchasing Managers Index (PMI) in China increased to 51.0 in August 2013, up by 0.7
percentagepointmonth-on-month,andpositionedabovethethresholdfor11consecutivemonths.
DOMESTIC TRENDS
GDP Slows Down to 4-Year Low
unexpected, as the monthly index of industrial
production (IIP) numbers had pre-empted this
weakness by posting a contraction to the tune of 1.1 per
centinthefirstquarter.
Thefullyeargrowthinthelastfiscalwasatadecadelow
of 5 per cent. At the beginning of this fiscal it seemed as
though the economy had bottomed out and that there
would be some recovery during the course of this year.
However, the first quarter print has effectively dashed
any such hopes and it does not seem as though the
growthcycle hasseen the troughyet as the next quarter
islikelytobeonaweakerfootingtoo.
GDP growth dropped to a four-year low of 4.4
per cent in the first quarter of the current fiscal as
compared to 4.8 per cent in the quarter before. This is
the lowest quarterly growth rate since March 2009,
when the global financial crisis was at its peak. The
downslide was driven by a weak industrial performance,
which slipped to multi-year lows. This was however not
5.4 5.2
4.7 4.8
4.4
1QFY13 2QFY13 3QFY13 4QFY13 1QFY14
Growth in GDP at Factor cost (y-o-y%)
Source: CSO
15 AUGUST-SEPTEMBER 2013
16ECONOMY MATTERS
lows in March 2009. This is particularly worrying as it is a
proxy of consumption expenditure and contributes
more than 25 per cent to overall GDP. In contrast,
community, social & personal spending which is
regarded as a proxy for government spending grew at
its highest pace since the September 2009 quarter.
However, it might be difficult to sustain this high
government spending as slowing growth is having an
adverse impact on tax revenues and the depreciating
rupee is raising the subsidy burden of the government.
In the first quarter alone, the actual fiscal deficit was
almost half of the budgeted deficit for the entire fiscal
year. For the remaining quarters, it looks increasingly
likely that the government will have to cut back
expenditure sharply from budgeted levels to maintain
itsfiscaldeficittarget(4.8percentofGDP).
The area under cotton, another important kharif crop,
has surged by 7.3 per cent to 108.5 lakh heactares (lh),
and this bodes well for the textile industry. In 2012-13,
domesticcottonoutputhaddeclinedfourpercentto34
million bales owing to a drought in the main cotton
producing states of Gujarat and Maharashtra. This had
also impacted cotton exports last year. Further, the
coverage of coarse cereals went up by 20.1 per cent to
163.1 lh. This has positive implications for the domestic
poultryindustry.
Kharif crop output touched an all-time high of 131.3
million tonnes in 2011-12. But kharif production had
fallen in 2012-13 because of the drought in Karnataka,
Maharashtra, Gujarat and Rajasthan. Timely sowing this
year will ensure crops get adequate time to mature. The
higher kharif output this year is expected to cool food
inflationaswell.
From the supply-side, agriculture growth came in at a
one-year high of 2.7 per cent in the first-quarter of the
current fiscal as compared to 1.4 per cent in the previous
quarter. The performance of the sector is expected to
improve further in the coming quarters aided by a good
monsoon this fiscal and expectation of record-high food
grain production this year. In fact agriculture sector's
performanceisexpectedtobekeycontributortooverall
growth this year. In contrast, industrial sector growth
slumped to a low of 0.2 per cent, the lowest point
second only to contraction in March 2009. Amongst its
sub-sectors, manufacturing sector contracted by 1.2 per
cent, while mining & quarrying continued to remain in
theredterritoryinthereportingquarter.
Any meaningful revival cannot afford to by-pass the
crucial manufacturing sector, given its importance in
employment creation; hence bold steps by the
policymakers to revive the sector's fortunes are the
need of the hour. Growth in the labour intensive sector
of construction was a mere 2.8 per cent in the June
quarter. Second quarter is usually a seasonally weak
quarter for construction and the trend is likely to
continue. The sector is possibly reflecting the sharp cut
in government's plan expenditure towards the end of
last year and the near halting of private investment
projects.
Services sector grew at the same clip as last fiscal, at 6.6
per cent and has been almost flat for 3 consecutive
quarters now. However, the dynamics within the
services component has changed significantly for the
worse. The trade, hotels, transport and communication
sector came in at a low of 3.9 per cent next only to its
(y-o-y%) 2QFY13 Q3FY13 Q4FY13 Q1FY14
GDP at factor cost 4.4
Agriculture 2.7
Industry 0.2
Services 6.6
-2.8
-1.2
2.8
3.7
3.9
8.9
9.4
5.2 4.7 4.8
1.7 1.8 1.4
1.3 2.5 2.7
7.6 6.7 6.6
Mining & quarrying 1.7 -0.7 -3.1
Manufacturing 0.1 2.5 2.6
Construction 3.1 2.9 4.4
Electricity, gas & water supply 3.2 4.5 2.8
Trade, hotels, transport & communication 6.8 6.4 6.2
Financing, insurance, real estate & business services 8.3 7.8 9.1
Community, social & personal services 8.4 5.6 4.0
Source: CSO
GDP Break-Up from Supply-Side
providing the biggest boost to expenditure GDP was
government spending, which came in at 10.5 per cent.
But as mentioned earlier, this trend might not be
sustained in the future. Exports and imports were fairly
muted and clocked -1.2 per cent and 0.7 per cent
respectively. It seems as though the government's
export promotion measures will take some more time
topanout.
From the demand-side, the situation remains weak and
GDP notched 2.4 per cent in the April-June 2013 quarter
as compared to 3.0 per cent in the previous quarter. The
primary source of concern was the sharp slowdown in
consumption growth, which came in at a dismal 1.6 per
cent, which is the lowest print on record for this GDP
series. In corroboration of the fact that the investment
cycle in the economy is faltering, gross fixed capital
formation contracted by 1.2 per cent. The component
Source: CSO
GDP Break-Up from Demand-Side
Outlook
CII is disappointed with the dismal performance of the first quarter GDP data which showed further deceleration in
the economic growth. In particular, the near stagnation in the manufacturing sector is worrying at a time when
policy makers are keen to raise the share of this sector in the economy. In view of the downside risks to growth, we
havenowrevisedourGDPgrowthforecastdownwardtoarangeof5.3-5.8percentforthecurrentfiscal.Inorderto
lift the economy out of the current quagmire, that all policy levers should be used to drive a revival in the economy.
Project clearances should be hastened, implementation of the manufacturing policy should begin by identifying
specificzoneswhereindustrycaninvestandinterestratesshouldbereduced.
improvementinIIPgrowthwasnotentirelyunexpected
as core sector (which constitutes close to 38 per cent of
the total index) had grown at 3.1 per cent during the
month.The positivesequential momentumwas evident
from the 3.8 per cent growth in the seasonally-adjusted
month-on-month (SA m-o-m) series in July 2013.
However, on a cumulative basis, for the first four
monthsofthefiscal,IIPcontractedby0.2percent.
In an encouraging sign, index of industrial production
grew by 2.6 per cent in July 2013 after remaining in
negative territory for two consecutive months. The
turnaround was mainly driven by a positive trend in the
manufacturing growth rate. The print for June has also
been revised upward to -1.8 per cent from -2.2 per cent
earlier. However, it should be noted that the
Industrial Growth Picks Up in July 2013
Jul-12
Sep-12
Nov-12
Jan-13
Mar-13
May-13
Jul-13
-0.1 2.6
10
5
0
-5
y-o-y% SA m-o-m%
IIP Growth Rebounds in July 2013
Source: CSO
(y-o-y%) 2QFY13 Q3FY13 Q4FY13 Q1FY14
GDP at market prices 2.4
1.6
10.5
-1.2
-1.2
0.7
2.5 4.1 3.0
Private Consumption 3.5 4.2 3.8
Govt. Consumption 6.9 2.2 0.6
Fixed Investment 1.1 4.5 3.4
Exports 5.0 -3.5 -0.6
Imports 9.5 4.2 3.3
17 AUGUST-SEPTEMBER 2013
18ECONOMY MATTERS
the previous month. The sector recorded positive
growth after remaining in the negative territory for
threeconsecutivemonths.Consumergoodscontinueto
remain in negative territory for the third consecutive
month, primarily on account of consumer durables.
Overall consumer goods sector showed de-growth to
the tune of 0.9 per cent in July 2013 as compared to -1.9
per cent in the previous month. The continued poor
performance by consumer durables in the last eight
months, wherein it remained in the negative territory, is
amatterofconcernasitiswidelyregardedasaproxyfor
consumption growth. Non-durables on the other hand
continued to show a robust performance, growing by
6.8 per cent in July 2013 as compared to 5.7 per cent in
thepreviousmonth.
On the sectoral front, manufacturinggrew at a relatively
robust 3 per cent, as compared to two previous
consecutive months of negative growth. As per the
industry classification, of the 22 industries, 11 showed
positive growth, mainly led by electrical machinery,
wearing apparel, luggage & footwear and tanning of
leather products. In contrast, regulatory and
environmental issues continued to plague the mining
sector, as it contracted by 2.3 per cent in July 2013.
Electricity sector, meanwhile, showed a strong rebound
of 5.2 per cent after the surprise stagnant growth last
month.
Ontheusebasedfront,themostsignificantsurprisewas
onthecapitalgoodsfront,whichgrewbyaconsiderable
15.6 per cent in July 2013 as compared to -5.8 per cent in
Apr-July
Weight July-12 May-13 Jun-13 July-13 FY13 FY14
General 1000.0 -0.1 -2.8 -1.8 -0.2 -0.2
Manufacturing 755.3 0.0 -3.6 -1.7 -0.6 -0.2
Mining 141.6 -3.5 -5.9 -4.3 -2.0 -4.0
Electricity 103.2 2.8 6.2 0.0 5.5 3.9
Use-Based
Basic 456.8 1.0 -0.9 -1.5 2.7 0.2
Capital 88.3 -5.8 -2.6 -5.8 -16.8 1.8
Intermediates 156.9 0.1 1.0 1.3 0.6 1.8
Consumer Goods 298.1 0.7 -7.1 -1.9 3.1 -2.0
-Durables 84.6 0.8 -18.4 -10.4 6.1 -12.0
-Non durables 213.5 0.6 3.0 5.7 0.6 6.8
2.6
3.0
-2.3
5.2
1.7
15.6
2.4
-0.9
-9.3
6.8
Source: CSO
Sectoral Growth (y-o-y, %)
Outlook
CII is happy to note the return of industrial growth to the positive terrain in July 2013, which marks a break from the
pasttwomonthsofnegativegrowth.Thisiswelcome,thoughitistooearlytopresumethatarecoveryisunderway.
However, manufacturing sector has been performing below its potential for quite some time now, hence well-
thought-outshortandmediumtermactionplansareneededtoacceleratethegrowthmomentumofthesector.
WPI Inflation Accelerates on Higher Food Prices
High fruits & vegetable prices coupled with high inland-
fish prices drove the primary food inflation sharply up to
18.2 per cent as compared to 11.9 per cent in the last
month. Consequently, primary inflation increased to 11.7
per cent in the reporting month as compared to 9 per
cent in the month before despite sharp deceleration in
its non-food and mineral sub components. Fuel inflation
on the other hand remained stable at 11.3 per cent in
August 2013. Encouragingly, non-food manufacturing
inflation, which is widely regarded as the proxy for
demand-side pressures in the economy came down to
1.9 per cent from 2.4 per cent in the month before. Total
manufacturing inflation too stood at 1.9 per cent during
themonth.
HeadlineWPI-basedinflationclimbedto6-monthhighof
6.1percentinAugust2013ascomparedto5.8percentin
the previous month mainly on account of spiralling food
prices. Total food inflation (primary + manufacturing)
accelerated sharply to 12.4 per cent in August 2013 as
compared to 9.5 per cent in the month before. The
average inflation for the first five months of the fiscal
stands at 5.3 per cent as compared to 7.6 per cent in the
same period last year. The sequential momentum of
seasonally-adjusted month-on-month series also
showedpickup.CombinedCPIinflationforthemonthof
August 2013 stood at 9.52 per cent as compared to 9.64
percentinthepreviousmonth.
General 100.0 8.0 5.2 5.8 7.6 5.3
Primary 20.1 11.2 8.8 9.0 10.3 8.1
- Food 14.3 9.3 10.3 11.9 10.4 11.0
-Non-Food 4.3 14.1 7.7 5.5 8.8 5.3
-Minerals 1.5 18.1 1.3 -2.4 12.3 -4.1
Fuel 14.9 8.7 7.5 11.3 10.5 9.2
-Petrol 1.1 9.5 -6.9 1.2 10.5 -0.9
-High Speed 4.7 0.5 23.4 26.3 5.0 23.8
Diesel
Manufacturing 65.0 6.4 2.9 2.8 5.6 2.9
-Food 10.0 9.3 6.4 5.0 6.9 5.4
-Non-food 55.0 5.8 2.2 2.4 5.4 2.4
April-Aug
Weight Aug-12 Jun-13 July-13 Aug-13 FY13 FY14
6.1
11.7
18.2
1.1
-7.2
11.3
3.2
27.6
1.9
1.7
1.9
Source: Office of Economic Advisor
Sectoral Components of Inflation
Outlook
While on the one hand, high food prices drove inflation higher during the month, non-food manufacturing (core)
inflation subsided further. This has complicated the task of the Central Bank further as there is clear evidence of
abatement of demand-side pressures, which makes the case for a rate cut to spur growth, but on the other hand,
supply-side issues have driven total inflation higher. We would urge the RBI to cut rates as it is well known that
monetarypolicyisnotaneffectivetoolforcurbinginflationcausedduetosupply-sidebottlenecks.
19 AUGUST-SEPTEMBER 2013
20ECONOMY MATTERS
Trade Deficit Narrows on Sharp Spurt in Exports Growth
Meanwhile, the cumulative value of exports for the
period April-August FY2014 came in at US$124.4 billion,
higher than US$119.7 billion recorded during same
period last year. Imports contracted by 0.7 per cent in
August 2013, lower than a decline of 6.2 per cent in July
2013, mirroring the continued subdued domestic
demand in the economy, impact of imports getting
costlierinthewakeofdepreciatingrupeeagainsttheUS
dollar and the curtailed imports of non-productive items
like gold. Imports also contracted in month-over-month
terms, printing US$37.1 billion in August as against
USD$38.1billioninJuly.
Exports stabilised further in August 2013, as global
demand improved. Imports declined reflecting the slow
domestic demand scenario, thus resulting in narrowing
of the monthly trade deficit. However, these may be
early days still to pass any judgement on the
sustainability of the exports momentum in the months
tocome.
In August 2013, exports were valued at US$26.1 billion,
up a robust 13 per cent as compared with same period
last year. This is the highest monthly increase this fiscal
and augurs well for the future economic prospects.
11.8 13.0
28.8
-0.7
40
30
20
10
0
-10
-20
Jan/12
Feb/12
Mar/12
Apr/12
May/12
Jun/12
Jul/12
Aug/12
Sep/12
Oct/12
Nov/12
Dec/12
Jan/13
Feb/13
Mar/13
Apr/13
May/13
Jun/13
Jul/13
Aug/13
y-o-y%
Exports Imports
Source: Ministry of Commerce
External Sector Performance
Oil imports were higher by 17.9 per cent on a y-o-y basis.
Non-oil imports declined by 10.4 per cent-standing at
US$21.9billionduringthemonth.
As exports rose and imports fell during the month, the
tradedeficitnarrowedtoUS$10.9billionfromadeficitof
US$12.3 billion in July. On a cumulative basis, trade
deficit came in at US$73.4 billion in April-August FY14,
slightly lower than a deficit of US$74.7 billion during the
sameperiodinFY13.
Within imports, oil and related products accounted for
US$15.1 billion worth of imports in August 2013 as
compared to US$12.7 billion in the previous month. The
higher oil import bill is attributable to the high
international oil prices during the month due the
ongoing geopolitical tensions in Syria. The Indian crude
oil basket price rose to US$110.1/bbl in late August as
comparedtoUS$105/bblinJulyandUS$101.0/bblinJune.
Outlook
Going ahead, exports are likely to find some support amidst signs of economic recovery in both the US and the Euro
zone. Besides, a weaker Rupee is also likely to aid exports. However, on the negative side, elevated crude oil prices
poseriskstotheoilimportbill.
v
v
v
v
v
v
Services projected to grow at 6.6 per cent in 2013-14
asagainst7.1percentin2012-13.
WPI inflation by end March 2014 will be around 5.5
percentasagainsttheaverageof7.4percentin2012-
13and5.7percentatendMarch2013.
Current Account Deficit projected at US$70 billion
(3.8 per cent of GDP) in 2013-14 against an estimated
US$88.2billion(4.8percentofGDP)in2012-13.
NetCapitalflowsprojectedatUS$61.4billion(3.4per
cent of GDP) in the current year against an estimated
US$89.4 billion in the last fiscal, the second highest
leveltodate.
Investment and Savings rate projected at 34.7 per
centand31percentofGDPrespectivelyin2013-14.
Some of the measures suggested by the council to
improve economic conditions in the medium to long
term include improving manufacturing capabilities,
lowering current account deficit and encouraging
foreigninvestmentamongstothermeasures.
Initsrevisedeconomicforecastforthecurrentfiscal,PM
Economic Advisory Council (PMEAC) lowered its GDP
forecast from 6.4 per cent to 5.3 per cent. Though
growth has been revised downwards, it is still higher
than the 5 per cent growth posted last year. As per the
council, the main reasons for the higher forecast in the
current year is the sharp increase in agriculture output
coupled with expected pick-up in growth of other
sectors also in the second half of the year owing to slew
of policy measures announced in the last couple of
months. Following are the key highlights from the
council'sotherforecasts:
Agriculture projected to grow at 4.8 per cent in 2013-
14 as against 1.9 per cent in 2012-13 owing to a good
monsoon which had a huge positive impact on
sowingactivity.
Industry projected to grow at 2.7 per cent in 2013-14
as against 2.1 per cent in 2012-13. Manufacturing
sectorprojectedtogrowat1.5percentinthecurrent
fiscalasagainst1percentinthelastfiscal.
v
v
PMEAC Cuts GDP Forecast to 5.3 per cent
Dr. Raghuram Rajan Takes Over as the New RBI Governor
view that it is mainly the supply constraints that have
unleashed the forces of inflation, especially in food. As
the governor has appropriately emphasized on a policy
that will promote inclusive growth and development, it
is even more critical to address the supply bottlenecks
throughawellcoordinatedmonetaryandfiscalpolicy.
With a view to encourage investors to take positions
domestically and provide depth and profits to our
economy, CII welcomes the intention of the new RBI
governor to steadily liberalize the domestic market, and
ease the restrictions on investment and positions
taking. This will also help the country by way of boosting
confidenceofforeigninvestorsintheIndianeconomy.
CII is also happy that the new governor will be taking
several steps to help the households, who remain
vulnerable to the vagaries of the market. Among these
important measures, the decision of RBI to issue
Inflation Indexed Savings Certificates linked to the CPI
New Index to retail investors by end-November 2013, is
welcomeandisinlinewith CIIrecommendations.
CII welcomes the new governor and is confident that he
will take the necessary pro-reform measures in the
months to come in order to re-invigorate growth in the
economyandkeeptheinflationaryexpectationslow.
Dr. Raghuram Rajan assumed charge as
rd
the 23 Governor of the Reserve Bank of
India on September 4, 2013. Prior to this,
he was the Chief Economic Advisor,
Ministry of Finance, Government of
India and the Eric J. Gleacher
Distinguished Service Professor of Finance at the
UniversityofChicago'sBoothSchool.Between2003and
2006, Dr. Rajan was the Chief Economist and Director of
Research at the International Monetary Fund. The new
governor takes over at a very critical stage for the
economy which saw Rupee touching historic lows in
addition to the perceived fiscal dominance over
monetary policy in recent times. Covering these critical
areas in his maiden speech, Dr. Rajan, expressed
confidence that monetary policy, in coordination with
fiscal policy, will not only be able to address the macro
economic issues facing the country currently but will
also provide platform for sustaining the high growth
withinclusivenessinmediumtolongterm.
Dr. Rajan rightly recognized the need for taming
inflationary expectations by taking measures based on
the understanding of the dynamics of originating
sources like the value of currency, supply-side
constraints and demand pressures. CII has been of the
21 AUGUST-SEPTEMBER 2013
22ECONOMY MATTERS
Draft Safe Harbour Rules – Do They Bridge or
Widen the Taxpayer-Exchequer Divide?
The Safe Harbour rules (the rules) were released in draft
form by the Central Board of Direct Taxes (the CBDT) on
14 August 2013. After considering comments from
various stakeholders, the final rules have been issued on
18 September 2013. The rules cover the following
categories/sectors of transactions and prescribe the
belowmentionedsafeharbourmargins/prices:
Software development and IT-enabled services - Cost
plus mark-up of 20 per cent (provided the value of such
transactions does not exceed INR 500 crores i.e. INR 5
billion); cost plus mark-up of 22 per cent mark in other
cases, i.e. above INR 500 crores; the draft rules had
proposed a threshold limit of INR 100 crores, i e
taxpayers having transactions above INR 100 crores
werenoteligiblefortheSafeHarbour
Knowledge Processes Outsourcing (KPO services) -
Cost plus mark-up of 25 per cent; in the draft rules the
same was proposed as 30 per cent with an upper limit
eligibilitythresholdofINR100crores.
Contract Research & Development (R&D) relating to
software development and generic pharmaceutical
drugs - Cost plus mark-up of 30 per cent and 29 per cent
respectively; same as the margins proposed in the draft
rules
Transfer Pricing (TP) has emerged as one of the key
focal points of high-pitched tax litigation in India.
While outsourcing/captive units have experienced
significantTP adjustmentsto theirprofitmargins,Indian
parent companies have suffered adjustments on their
intra-groupfinancingarrangements.
The Finance (No. 2) Act, 2009 had introduced Safe
Harbour Provisions in order to reduce the uncertainty
faced by the taxpayers in India. The provisions were also
intended to provide clarity and guidance on the quantity
of taxable profits that should be earned in India as per
the arm's length principle. Safe Harbour is a mechanism
under which the tax authorities accept the transfer
prices declared by taxpayers without undertaking
detailed audit, in certain circumstances. Safe harbour
provisions generally intend to confer benefits like
compliancerelief,administrativesimplicityandcertainty
on the taxpayers and tax administrators. While this
helps the tax payers in reducing compliance cost, tax
authorities can focus their limited resources on bigger
andmorecomplextransactions.
T A X E S
TAXATION
The rules have prescribed different margins for services
viz., software development, ITeS, KPO, contract R&D,
etc. A noteworthy aspect is that service providers
bearing insignificant risk are only eligible to opt for the
rules. The factors mentioned for identification of
taxpayers with 'insignificant risk', inter-alia, includes
performance of economically significant functions,
provisionsoffunds/capitalandownershipofintangibles
by foreign principal, etc. Hence, distinction in mark-up
percentage between various services, presumably on
the basis of high-end vs. low-end nature of activities,
could lead to enhancing disputes on characterisation of
taxpayers.
The mark-up percentages prescribed in the rules may
not meet the taxpayers' expectations (based on
industry average margin trends and prevalent
commercial rates) and opting for the prescribed
margins under the rules may overshadow the expected
benefits. Similarly, the safe harbour interest rate for
loans would range from 11 per cent to 13 per cent
(applying the SBI base rate as on 30 June 2013), which
clearly is on a higher side. Also, the margin provided for
auto components industry, which in particular has been
going through a challenging phase, appears high. Since
several rulings of the Income tax Appellate Tribunals
have accepted lower percentage of mark-up or interest
tobe atarm'slength,theratesspecified intherulesmay
notfindfavourwiththetaxpayers.
Whilst the step by the CBDT is a positive move, it is
expected that the revenue authorities during audits,
APA/MAP negotiations will not consider the safe harbor
margins. An issuance of a binding circular clarifying that
safe harbour rates should be strictly applied only to
taxpayers who opt for the rules and should not be
generically extended to other assessees (who do not
opt for the rules) would provide a sense of relief to
taxpayers.Thereisnodoubtthatthereleaseofthelong-
awaitedSafeHarbourrulesisastepintherightdirection
and the certainty and administrative convenience
offered by the rules would be an additional incentive
that will increase the attractiveness of India as an
investmentjurisdiction.
Manufacture and export of core and non-core auto
components - Cost plus mark-up of 12 per cent and 8.5
percentrespectively;sameasthedraftrules
Interest on loans sourced in Indian Rupees extended to
Wholly-Owned non-resident subsidiaries (WOS) - State
Bank of India (SBI) base rate plus 150 basis points for
loans up to INR 50 crores and, SBI base rate plus 300
basis points for loans exceeding INR 50 crores i.e. INR
0.5billion.
Guarantee fee on explicit corporate guarantees on
behalf of WOS - 2 per cent per annum where the amount
guaranteed does not exceed INR 100 crores i.e. INR 1
billion and 1.75 per cent in case the amount guaranteed
exceeds INR 100 crores and the credit rating of the WOS
is of adequate to highest safety as carried out by an
agency registered with the Securities and Exchange
BoardofIndia.
The issuanceof detailed Safe Harbourrules is a welcome
measure. The removal of upper threshold limits for
eligibility of opting for safe harbour rules will give an
opportunity to taxpayers at large to opt for the rules. As
regards the period, application of the rules for five years
(instead of 2 years as in the draft rules) is another
positive development. It is expected that the rules
would help overcome immense potential TP litigation
andcreateanamicabletaxenvironment.
However, the rules in final form also have certain issues
aswereinthedraftrules.Therulesrequirethetaxpayers
opting for Safe Harbour to comply with the detailed
requirements relating to TP documentation. Such
compulsion would defeat the key benefit of reduced
compliance burden. Once a certain mark-up for a
specified service is acceptable to the tax authorities,
maintaining detailed documentation thereafter may, at
bestbeofacademicimportance.
The final rules only cover R&D for software
developmentandgenericpharmaceuticaldrugs,leaving
out other sectors such as R&D for active pharmaceutical
ingredients, chemicals, agriculture, etc. Further, the
rules only cover loans/guarantee provided by taxpayer
to/for WOS and cover only rupee-sourced loans, thus,
havingrestrictedapplicability.
This articlehas beencontributedby Tarun Arora, Senior Director, Shuchi Ray, Director, DeloitteToucheTohmatsuIndia Pvt.Ltd. and Manmeet Vij,
SeniorManager,DeloitteHaskins&Sells.ViewsexpressedinthearticlearethoseoftheauthorsandnotnecessarilyofCII.
23 AUGUST-SEPTEMBER 2013
24ECONOMY MATTERS
CORPORATE PERFORMANCE
Industry Under Pressure as Growth
Dips Further
The analysis factors in the financial performance during
the first quarter of 2013-14 of a balanced panel of 1664
manufacturing companies (excluding oil and gas
companies) and 1037 service firms extracted from the
th
AceEquitydatabaseason29 August2013.
Growth in net sales on an aggregate basis stood at a
measly 4.8 per cent at the end of first quarter of the
current year, as compared to a healthy 12.2 per cent in
the same quarter a year ago. The growth of net sales for
manufacturing firms moderated sharply to 0.2 per cent
during the quarter as compared to 12.7 per cent in the
same quarter a year ago. Firms in the services sector, on
the other hand, fared somewhat better, with their net
sales growing at a much higher pace of 12.6 per cent as
compared to 11.4 per cent during the comparable time-
period of last year. The low net sales of firms are
reflectiveofthelackofampledemandintheeconomy,a
scenario that has been persistent for quite some time
now.
The deepening economic slowdown, rising interest
rates, tight liquidity, declining investments and
depreciating rupee are slowly taking a toll on India Inc's
financial performance with majority of companies
witnessing a decline in net profits for the past few
quarters.Thecorporateresultsattheendoffirstquarter
(April-June)of the currentfiscal painted a rathergloomy
picture as the financial performance of Indian
companies deteriorated. A scanty 4.4 per cent GDP
growth in the reporting quarter worsened the cause,
even as the RBI tightened its purse strings in a bid to
stem the downfall in Rupee. While the growth in
expenditure costs stood somewhat curbed, fading
growth of net sales and contraction in PAT added to the
prevalentgloom.
the corresponding period of last year. Interestingly,
growth in interest costs decelerated sharply to 10.0 per
cent in the reporting quarter as against 29.0 per cent in
the same quarter of 2012-13. In a reflection of slowing
production, growth in raw materials cost contracted by
5.7 per cent in the reporting quarter as compared to a
positivegrowthof10.5percentseeninthesamequarter
oflastyear.
Totalexpenditure,onanaggregatebasis,deceleratedto
3.5 per cent in the reporting quarter as against a growth
of 16.5 per cent in the corresponding period of 2012-13.
This came as a breather and fairly cushioned the severe
impact of lower net sales growth during the quarter.
Amongst the various components of total expenditure,
the growth in wages & salaries stood at 14.7 per cent in
thefirstquarterascomparedto15.1percentrecordedin
GrowthinNetSales(y-o-y%)
Aggregate Manufacturing Services
FY13Q1 12.2 12.7 11.4
FY13Q2 9.9 8.8 11.8
FY13Q3 7.0 6.5 7.9
FY13Q4 4.5 2.1 9.1
FY14Q1 4.8 0.2 12.6
Source: Ace Equity database & CII calculations
Growth in Net Sales (y-o-y%)
Growth in Expenditure (y-o-y%)
10.5
-5.7
15.1
14.7
29.0
10.0
FY13Q1
FY13Q2
FY13Q3
FY13Q4
FY14Q1
FY13Q1
FY13Q2
FY13Q3
FY13Q4
FY14Q1
FY13Q1
FY13Q2
FY13Q3
FY13Q4
FY14Q1
Services & Raw Materials Wages & Salaries Interest Payments
Source: Ace Equity database & CII calculations
correspondingquarteroflastyear.
On an aggregate basis, PAT declined by 5.9 per cent in
the April-June 2013 quarter as compared to a growth of
3.2 per cent in the same quarter of last fiscal. Growth in
operating profits (profits earned from a firm's core
business operations excluding investments and the
effects of depreciation, interest and taxes) on an
aggregate basis saw moderation to 5.1 per cent in the
April-June, 2013 quarter as compared to a growth 11.3
per cent in the first quarter of last year. PAT growth
decelerated at a much faster rate than growth in
operating profits due mainly to high interest rates
prevailingintheeconomy.
While moderation in growth of expenditure has to some
extent mitigated the impact of the current bout of
economic crisis characterized by falling growth in net
sales, the reduction was not large enough to provide
cushion to the bottom-line of the firms. Consequently,
there was de-growth witnessed in profit-after-tax (PAT)
on an aggregate basis in the first quarter of 2013-14. The
sharpest contraction in PAT growth was seen in
manufacturing sector firms, which saw its PAT declining
by12.6percentinthefirstquarterofthecurrentfiscalas
compared to a contraction of 14.5 per cent in the same
quarter of last year. For the services sector, PAT growth
moderated to 0.7 per cent in the reporting quarter as
against a growth of 29.3 per cent seen in the
25 AUGUST-SEPTEMBER 2013
26ECONOMY MATTERS
Growth in PAT (y-o-y%)
Manufacturing Services Aggregate Manufacturing Services Aggregate
FY13Q1 FY13Q2 FY13Q3 FY13Q4 FY14Q1
Growth in PBDIT (y-o-y%)
Source: Ace Equity database & CII calculations
FY13Q1 FY13Q2 FY13Q3 FY13Q4 FY14Q1
3.2
20.1
9.9
-5.9
40
20
0
-20
-12.6
11.3 13.3
6.0
0.1
5.1
and thus also on aggregate basis in the reporting
quarter. The fall in margins mirrored the sharp decline in
profitability that the firms have had to confront in the
reportingquarter.
Our analysis shows that both net margin (ratio of PAT
and net sales) and gross margins (ratio of PBDIT and net
sales) fell across manufacturing as well as service firms,
Gross Margin Net Margin
Source: Ace Equity database & CII calculations
Manufacturing Services Aggregate
20.3 20.6
19.4 19.9
20.4
FY13Q1 FY13Q2 FY13Q3 FY13Q4 FY14Q1
Manufacturing Services Aggregate
FY13Q1 FY13Q2 FY13Q3 FY13Q4 FY14Q1
8.4 9.1
7.9 8.1 7.6
some moderation in expenditure costs. Net sales and
PAT growth, however, continue to remain a sore point,
indicating that there is still a long way to go before
revivalinaggregatedemandgainstraction.
Overall,theanalysisoftheresultsobtainedsofarreveals
that there seems be no news to cheer for the India Inc
amidst this weak macroeconomic scenario, except for
30
15
0
-15
40
20
0
20
10
0
Capital Goods
Production Trend in Capital Goods
Sector
Analyzing the yearly performance of the capital goods
segment, below table shows a sharp moderation in
growthofthesectorsince2007-08(JulytoJune).Owing
to the global financial crisis, the growth in capital goods
sector plunged from 48 per cent in 2007-08 to 4 per cent
in 2008-09. With the quick turnaround of the economy,
growth prospects for the sector improved in the next
two years. However, the sector went in for a sharp
contraction in 2011-12 (-9 per cent) and 2012-13 (-2.2 per
cent). The negative growth recorded by the sector over
the last two years is a serious concern and its revival is
crucial for the economy to resume its high growth
trajectory.
It is interesting to note that all sub-sectors of the capital
goods segment have witnessed rapid deterioration in
growth performance over the last two years. Machinery
& equipment, which is an important indicator of the
health of the other sectors of economy, has recorded
contraction over two consecutive years. Given that it
playsacrucialroleinupscalingthepaceoftheeconomy,
directly and indirectly, every effort should be made to
reversethedowntrendinthissector.
Introduction
apital goods sector is of strategic importance for
the Indian economy. Being large and diverse in
nature and playing a critical role in production process,
the sector has high multiplier effect on the overall
growth of the economy. The sector not only determines
the pace of economic expansion but also gets
influenced by the same. As the demand for the sector's
output is derived from the demand for other sectors of
the economy, its own performance provides an
important clue to the future. By analyzing the recent
trends in production and imports of lead components of
capital goods sector, one can, therefore, explain the
growthprospectsofrelatedsectorsoftheeconomyand
alsocommentontheneedforpolicyintervention,ifany.
While the performance of capital goods sector is
generally considered as a barometer of the growth
prospectsoftheeconomygoingforward,italsohelpsto
assess the need for encouraging efficiency and
production of the sector to encourage demand from its
endusers.
C
SECTOR IN FOCUS
27 AUGUST-SEPTEMBER 2013
28ECONOMY MATTERS
automobile sector in slow track. While efforts can be
made to revive the automobile production by direct
policy intervention, it would also be helpful to enhance
the cost competitiveness of "other transport
equipment" to attract additional demand from its end
users.
Similarly, sharp growth deterioration witnessed by
'other transport equipment' signifies the downtrend in
theautomobilesector,anotherengineofgrowthforthe
economy. Slowing income growth, rising fuel prices,
uncertainty relating to growth recovery and high credit
cost have been among the major factors keeping the
Year Machinery & Office, accounting & Electrical machinery Radio, TV and Other Capital
equipment n.e.c. computing machinery & apparatus n.e.c. communication transport Goods
equipment & equipment (Aggregate)
apparatus
2007-08 19.6 6.3 183.8 87.5 -0.7 48.1
2008-09 -8.4 -11.3 33.0 15.7 4.9 4.1
2009-10 25.0 5.2 -0.6 18.4 31.4 10.4
2010-11 20.3 9.3 11.2 7.4 22.0 15.0
2011-12 -1.9 -3.8 -30.3 10.5 9.0 -9.1
2012-13 -7.4 -17.2 20.3 -2.9 1.1 -2.2
Average 7.9 -1.9 36.2 22.8 11.3 11.1
Source: CSO
Average Annual Growth in IIP of Capital Goods Sector (July to June, y-o-y%)
manufacturing sector plotted against the
corresponding IIP for capital goods since June 2007.
Production growth in capital goods sector, which
constitutes less than 9 per cent share in overall weights
in IIP, has moved in tandem with the overall growth of
manufacturing index. Being the derived nature of
demand for capital goods, its growth trend, in general,
has preceded that of manufactured goods. In below
figure, it can be seen that production growth of capital
goods sector assumed a sharp downward spiral during
June 2007 to Nov 2009, and the growth in
manufacturingsectorfollowedsuitwithatimelag.After
this, the capital goods sector exhibited a vigorous
recovery till June 2011, albeit with a large volatility,
coinciding with high growth performance of the
manufacturing sector. Capital goods sector since July
2011haslargelystayedinnegativezones,bringingtohalt
theexpansioninmanufacturingoutput.
Sharp moderation in growth of 'Radio, TV and
Communication equipment & apparatus' over the last
two years is again the result of economic slowdown led
by fall in demand. The fate of the sector largely depends
upon the measures that could help in revival of demand
for durables. The negative growth of 'office, accounting
& commuting machinery' sector over the last two years
is indicative of slowing business activities, and could
mirrordecliningjobprospectsaswell.
Interrelationship between Capital
GoodsandManufacturingSectors
The production performance of capital goods sector is
directly linked to the growth performance of the
manufacturing sector. Close relationship between the
two sectors of the economy is discernible from the
monthly Index of Industrial Production (IIP) for
especially true for the period of 2000s, when
manufacturing sector recorded robust performance,
supported by the elevated growth of capital imports.
This is where there is a scope for domestic capital goods
sectortofillthegap.
Showing large dependence on imports of capital goods,
the growth in manufacturing output has also moved
closely with the growth in imports of capital goods (see
below figure). Whenever there was high growth
registered by the manufacturing sector, it was backed
by large imports of capital goods and vice versa. This is
Monthly Growth in Capital Goods and Manufacturing IIP since June 2007
70
56
42
28
14
0
-14
-28
Jun-07
Sep-07
Dec-07
Mar-08
Jun-08
Sep-08
Dec-08
Mar-09
Jun-09
Sep-09
Dec-09
Mar-10
Jun-10
Sep-10
Dec-10
Mar-11
Jun-11
Sep-11
Dec-11
Mar-12
Jun-12
Sep-12
Dec-12
Mar-13
Jun-13
Manufacturing Capital goods
Source: CSO
50
40
30
20
10
0
-10
-20
-30
-40
1989-90
1990-91
1991-92
1992-93
1993-94
1994-95
1995-96
1996-97
1997-98
1998-99
1999-00
2000-01
2001-02
2002-03
2003-04
2004-05
2005-06
2006-07
2007-08
2008-09
2009-10
2010-11
2011-12
2012-13
Manf. Output Imports of Capital Goods
Yearly Growth in Capital Goods Imports and Manufacturing Output since 1989-90 (%)
Source: CSO
billion in 2001 to US$79 billion in 2012. Even as the
domestic production of capital goods sector has
witnessed contraction in the last two years, imports of
capital goods managed to maintain growth momentum
and grew by an average of 12 per cent per year in the last
twoyears.Relativelylowprotectionagainstimportsand
growing pressure on the part of exporters to reduce
prices in the wake of global slowdown could be among
TrendinImportsofCapitalGoods
In keeping with the pace of overall economic growth
and lack of development of domestic capital goods
sector, the imports of capital goods have witnessed
sharpincreaseoverthelastdecadeorso,supportedbya
relativelylowrateofcustomsdutyintherangeof0.0-7.5
percent.Theimportsjumpedupby10timesfromUS$7.9
29 AUGUST-SEPTEMBER 2013
30ECONOMY MATTERS
value of rupee against US dollar plunges to record new
lows on regular basis. Further, the import duty could be
raised to the WTO base rate to regulate unnecessary
importslikehasbeendoneforgold.
the major reasons that allowed imports to maintain its
momentum. In the wake of widening current account
deficit,whenthegovernmentandRBIaremakingallout
effortstocurbavoidableimports,hugeimportofcapital
goods is causing a drain on foreign reserves, even as the
these two items together constitute less than 22 per
cent of total imports, overall expansion in imports of
capital goods continue to remain healthy. Three largest
sub-sectors of capital goods imports - electrical
equipment, telecommunication equipments, and
industrial equipments - constituting half of the total
importsofcapitalgoodsin2012-sawimportsgrowingin
double-digits, which could mean good prospects of
growthinendusersofthesesectors.
Interestingly, majority of the capital goods sub-sectors
haveshownconsistentandhealthygrowthinimportsin
recent years; even over the last two years when
economic growth in the country moderated
substantially (see below table). The only sectors
exhibiting poor growth performance in imports since
2007 are Railway/Tramway equipment (-5.7 per cent),
and industry special machine (3.8 per cent). Given that
7.9 10.3
14.7
19.8
28.2
40.8
47.9
64.6
58.1
63.8
76.7 79.0
2001 2002 2003 2004 2005 2006 2007 2008 2009 2010 2011 2012
Trend in Imports of Capital Goods (US$, billion)
Source: UN Comtrade
Year Power Industry Metal Industrial Office/data Telecom Electrical Road Railway/ Total
generating special working equipment proc ms etc equipment vehicles tramway Capital
equipment machine machinery machines equipment equipment Goods
2007 3.1 6.9 2.5 6.8 4.2 9.9 6.5 1.9 6.1 47.9
2008 4.0 8.3 3.5 9.2 4.5 7.3 7.6 3.2 17.2 64.6
2009 3.9 6.8 2.5 7.7 4.3 11.6 9.9 2.7 8.7 58.1
2010 4.9 7.1 2.8 9.5 5.3 13.6 9.4 4.0 7.2 63.8
2011 6.1 8.9 3.6 12.2 6.8 14.6 14.1 5.0 5.2 76.7
2012 6.0 8.5 4.0 12.2 7.6 13.5 13.7 5.0 8.6 79.0
Avg 14.8 3.8 7.8 12.1 13.4 11.5 17.2 20.6 -5.7 9.3
Annual
Growth
(%)
Source: UN Comtrade
Trend in Imports of Major Components of Capital Goods Sector (US$, billion)
India's sources of capital goods imports are
concentratedin just a few countries.This is evident from
the fact that just the top ten sources contributed nearly
80 per cent of capital goods imports in 2012-13; of these,
the top 5 countries - China, Germany, Japan, US, and
Korea Rep. - accounted for 63 per cent of the total
imports of capital goods. China is by far the largest
exporterofcapitalgoodstoIndia.
India is heavily dependent upon the imports of capital
goods for meeting the domestic demand. This is evident
from the fact that imports constituted 29 per cent of
domestic demand for capital goods in 2010-11. Earth
moving equipment, machine tools, metallurgical
machinery and textiles machinery are sub-sectors that
are particularly weak in self reliance with 48 to 87 per
centdemandbeingmetbyimports.
Electrical
equipment
17.3%
Telecomms
etc equipment
17.1%
Industrial
equipment nes
15.4%
Railway/tramway
equipmnt 10.8%
Industry
special
machine
10.8%
Office/dat
proc machines
9.6%
Metalworking
machinery 5.1%
Road vehicles
6.3%
Power generating
equipmt 7.5%
Sectoral Share of Capital Goods Imports (2012)
Source: UN Comtrade
China
31%
Germany
9%
Japan 8%United States
8%
Korea, Rep.
7%
Singapore 4%
Italy 3%
Malaysia 3%
Thailand 3%
France 3%
Others
21%
Composition of Imports of Capital Goods from
Top-10 Countries (2012)
Source: UN Comtrade
31 AUGUST-SEPTEMBER 2013
32ECONOMY MATTERS
This raises a pertinent question: why should we not
make attempts to cut imports of capital goods by
encouraging its domestic production, which would not
only help in saving foreign exchange but also create
much needed value addition and employment within
the economy. This is especially critical in the context of
sharperodingvalueofrupeeagainsttheUSdollarwhich
is going to impact the imports of capital goods
adversely. In order to ensure the sector's progressive
development and to drive it to the next level of growth,
there are numbers of measures that need to be taken,
asmentionedinthefollowingsection.
Measures to Boost Domestic Capital
GoodsSector
o Leverage domestic demand - To leverage large
domestic demand that exists in India, there is a need
for developing significant collaboration between
usersandproducersofcapitalgoodssector.
o Harmonize tax, duty structures, and FTAs - Indian
capital goods manufacturers are affected by current
duty structure that has created an unequal playing
field between domestically manufactured goods
and imported goods. Further, in certain cases, Free
Trade Agreements (FTAs) are also being exploited to
the disadvantage of domestic capital goods
manufacturers.ExportsfromcountriessuchasChina
are routed through these FTA countries to secure
greater advantage over local manufacturers. There
is, therefore, a need harmonize tax and duty
structureandensurethatFTAsdon'tinflictinjuriesto
thedomesticcapitalgoodssector.
o Addressing the issue of inverted duty structure - In
the current duty structure for intermediate and
finished goods, there are certain anomalies, which at
times, make the domestic capital goods costlier. At
the same time, import duty on finished goods turns
out to be lower in many instances, thereby creating
an advantage for imports over domestic production.
Such cases exist in various capital goods segments,
callingforurgentpolicyattention.
o Restricting imports of second hand machinery -
There is a need to curb the large imports of second
hand machinery in several sectors in India, including
machine tools and textile machinery. Policy needs to
be shaped to limit import of second hand equipment
toprovideimpetustolocalmanufacturing.
o Bridging the technology gap and increasing the
depth of capabilities of domestic capital goods
manufacturers-Indiancapitalgoodssectorneedsto
plan and invest in developing the "next generation"
products in order to shorten the prevailing
technology gap between domestic manufacturers
andforeignplayers.
Imports Domestic
Split of Demand between Imports and Domestic Production (2010-11)
th
Source: Report of the Working Group on Capital Goods & Engineering Sector for the 12 Five Year Plan, October 2011
9%
24%
26%
31%
35%
48%
51%
71%
87%
29%
91%
76%
74%
69%
65%
52%
49%
29%
13%
71%
Process plant equipment
Engineering Goods
Heavy Electrical Equipment
Dies, Moulds and Tools
Plastic Machinery
Textile Machinery
Earth Moving Equipment
Machine Tools
Metallurgical Machinery
Overall
O
demand met by imports
ver 50 per cent
Conclusion
The negative growth recorded by the capital goods sector over the last two years is a matter of concern. To blame
the economic slowdown alone for the same would be incorrect as the imports of capital goods in the country have
continued to remain buoyant. Poor performance, therefore, has much to do with the low cost competitiveness of
the sector, which has magnified in the face of the economic slowdown. While revival of manufacturing growth is
critical for capital goods sector, its healthy growth performance too can help the revival process. This is especially
true in the backdrop of the sharp erosion in value of rupee against the US dollar, which is going to impact the
importsofcapitalgoodsinthecountryadversely,besidesaddingtotheproblemofcurrentaccountdeficit.
To make the domestic capital goods sector competitive, it is critical that we provide the right mix of fiscal
incentives, infrastructure and skilled personnel and develop domestic capabilities across the value chain in the
sector. Measures such as rationalizing the local tax structure, reducing the cost of credit, time bound fiscal
incentives, putting check on avoidable imports of second hand machinery, addressing the issue of inverted duty
structure, and facilitating skill development facilities for a competent workforce would go a long way in helping
thesector.
33 AUGUST-SEPTEMBER 2013
Global Taxation
Summit 2013
The topics to be deliberated at the Summit would broadly
include:
International & Domestic Tax Developments –Lessons and
Learning for India
Key Current and Emerging Transfer Pricing Audit Issues in India
Alternate Dispute Resolution – Challenges & Way Forward
BEPS – Emerging Trends in Developed and Emerging Markets
Indirect Tax Issues including CENVAT, Service Tax and State VAT
v
v
v
v
v
Ms. Jessy Rajji
Confederation of Indian Industry; 23 Institutional Area; Lodhi Road
New Delhi 110 003.
Tel : 91-11-24690715 /24629994 – 7; Fax : 91-11-24615693
Email : jessy.rajji@cii.in
CII is organizing a day
long Global Taxation
th
Summit 2013 on 20
November, 2013 at Hotel
Taj Palace, New Delhi.
Mr. Sumit Bose, Secretary - Revenue, Ministry of Finance, has
kindly agreed to be the Chief Guest at the Summit. The Summit
would also have the benefit of the views of senior government
officers, tax experts from India and abroad and industry.
You are invited to participate in the Summit. For registration
and sponsorship opportunities, please contact:
34ECONOMY MATTERS
SPECIAL ARTICLE
Right to Fair Compensation and Transparency in Land
Acquisition, Rehabilitation and Resettlement Bill, 2013
Over a period of time, land acquisition has emerged
as a critical constraint in India's industrialization,
given pressures on limited land-mass for multiple uses.
In order to remove the impediments to land acquisition,
itisessentialthatitmusttakeplaceinamannerthatfully
protects the interests of land-owners and also of those
whose livelihoods depend on the land being acquired.
Under our Constitution, land is a State subject but land
acquisition is a Concurrent subject. So far, the basic law
governing the land acquisition process has been the
Land Acquisition Act, 1894. Although it has been
amended from time to time, it is painfully evident that
thebasiclawhasbecomearchaic.Againstthisbackdrop,
review of the outdated Land Acquisition Act of 1894 in
the country could not have come at a more appropriate
time. After passage from both the Houses of the
Parliament, the "Right to Fair Compensation and
Transparency in Land Acquisition, Rehabilitation and
Resettlement Bill, 2013" is currently awaiting the assent
of the President of India and will become a new law
within next three months. In this article we discuss the
key provisions of the new bill and how it would bring
aboutachangeintheexistinglandacquisitionscenario.
Some of the key provisions of the new legislation, which
hasbeenpassedbytheParliamenton6September,2013
arelistedbelow:
TheBillprovidesforanexpandeddefinitionofpublic
purpose that includes infrastructure projects,
including: (i) all activities listed by the Government
as infrastructure projects in its notification dated
March 27, 2012, excluding private hospitals, private
educational institutions and private hotels; (ii)
projects related to agriculture, agro-processing,
cold storage facilities; (iii) industrial corridors or
mining activities, national investment and
manufacturing zones as designated in the National
Manufacturing Policy; (iv) Government
administered or Government aided educational and
research institutions; (v) sports, health care,
transport or space program projects; and (vi) any
other infrastructural facilities notified by the Central
Government after tabling the notification in the
Parliament.
KeyProvisions
vDefinitionofPublicPurpose
-Key Provisions of the New Legislation
Further, public purpose also includes acquisition of
land for use by: (a) Public-Private Partnership
Projects (PPPs), where ownership of land continues
to vest with the Government; and (b) private
companies,forthepurposesmentionedabove.
The new legislation requires the concerned
Government to conduct a Social Impact Analysis
(SIA) prior to every acquisition of land. The SIA has
to be conducted in consultation with the Panchayat
at the village level and at the Municipality or
municipalcorporationattheurbanlevel.
Further, the SIA has to be completed within six
monthsfromthedateofitscommencementandwill
take into account, amongst other factors, the social
impact of the project on the overall costs of the
project vis-a-vis the benefits of the project. The SIA
report will be made available in the local language at
the offices of the Panchayat, Municipality as the
casemaybe.
The SIA will be evaluated by an Expert Group, which
has to look at whether the project serves any public
purpose; or the social costs and adverse social
impacts outweigh the potential benefits. It is
required to submit its recommendation within two
monthsofitsconstitution.
The provisions of this Act relating to consent shall
apply when the appropriate Government acquires
landforthefollowingpurposes,namely:-
(a) For public private partnership projects, where
theownershipofthelandcontinuestovestwith
theGovernment,forpublicpurposeand
(b) for private companies for public purpose,
provided that in the case of acquisition for- (i)
Private companies, the prior consent of at lest
eighty per cent of affected families; and
(ii) Public Private Partnership projects, the prior
consent of at least seventy per cent of affected
families shall be obtained through a process as
may be prescribed by the appropriate
Government.
The process of obtaining the consent shall be
carried out along with the Social Impact
Analysis(SIA)study.
vSocialImpactAnalysis(SIA)
vConsentforLandAcquisition
vCompensationtoLandOwners
vRehabilitation & Resettlement (R&R)
Entitlements
As per the new legislation, the market value of the
acquiredlandshallbebasedonthe (i) market value
specified in the Indian Stamp Act for the registration
ofsaledeeds;or (ii) average of the top 50 per cent
of all the sale deeds in the similar type of land
situated in the vicinity; whichever is higher. Once the
market value is computed, it shall be multiplied by a
factor (1-2) for rural areas, based on the distance of
the said land from urban areas. Once the total
compensation is arrived at, the Collector shall
impose a 100 per cent Solatium on it for both rural as
well as urban areas. Further, the Collector shall
award an amount at the rate of 12 per cent per
annum on the market value from the period
commencing from date of publication of the SIA till
the date of the award of the Collector or the date of
takingpossessionoftheland,whicheverisearlier.
One of the key provisions of the new legislation is
that families owning the land or whose livelihood is
affected as a result of land acquisition shall be
entitled for a specified R&R package, which has
been elaborated in the Schedule II. Affected family
insuchcaseswouldinclude-
(i) A family whose land or other immovable
propertyhasbeenacquired;
(ii) A family which does not own any land but a
member or members of such family may be
agricultural labourers, tenants including any
form of tenancy or holding of usufruct right,
share-croppers or artisans or who may be
working in the affected area for three years
prior to the acquisition of the land, whose
primary source of livelihood stand affected by
theacquisitionofland;
(iii) The Scheduled Tribes and other traditional
forest dwellers that have lost any of their forest
rights recognised under the Scheduled Tribes
and Other Traditional Forest Dwellers
(Recognition of Forest Rights) Act, 2006 due to
acquisitionofland;
(iv) Family whose primary source of livelihood for
three years prior to the acquisition of the land is
dependent on forests or water bodies and
35 AUGUST-SEPTEMBER 2013
36ECONOMY MATTERS
vAdditional Compensation to Original land
Owner
vProcessofLandAcquisition
vReturnofUnutilizedLand
vAcquisition of Irrigated Multi Cropped
Land
vLeasingofLand
Bill stipulates that 40 per cent of appreciated land
value (profit) should be shared with original land
owners in cases where - Any land more than the
threshold stipulated by the State Government
which has been purchased through private
negotiations on or after 5 September 2011 and
acquired by the Government within three (3) years
of commencement of this Bill; and whenever the
ownership of any land acquired under this Act is
transferred to any person for consideration,
without any development having taken place on
such land in proportion to the value at which the
landwasacquiredwithinaperiodof5yearsfromthe
date of acquisition. For both the cases, benefit shall
accrue only on the first sale or transfer that occurs
aftertheconclusionoftheacquisitionproceedings.
The entire process of land acquisition, starting from
Social Impact Analysis (SIA) to possession of land by
the concerned Collector (after ensuring full
payment of compensation as well as rehabilitation
and resettlement entitlements are paid or tendered
to the entitled persons) would take a minimum time
of56months(see Table1).
The New Bill stipulates that any acquired land, if not
used for 5 years should be returned to owner or to
the State Land Bank in case the land owner does not
return the original compensation, as the case may
be.
The new legislation stipulates certain limits on
acquisition of Multi-Cropped Land to be determined
by the appropriate Government considering the
relevantStatespecificfactorsandcircumstances.
The new legislation permits the State Government
to exercise the option of taking the land on lease
insteadofacquiringtheland.
includes gatherers of forest produce, hunters,
fisher folk and boatmen and such livelihood is
affectedduetoacquisitionofland;
(v) A member of the family who has been assigned
land by the State Government or the Central
Government under any of its schemes and such
landisunderacquisition;
(vi) A family residing on any land in the urban areas
for preceding three years or more prior to the
acquisition of the land or whose primary source
of livelihood for three years prior to the
acquisition of the land is affected by the
acquisitionofsuchland;
The Bill provides that R&R will be mandatory in case
of private purchase of land above a certain
threshold, which shall be determined by individual
State Governments after considering the relevant
state specific factors. Further, it is also stipulated
that it is mandatory to file an application with the
concerned Collector before acquisition of such land,
notifying him of - (a) intent to purchase; (b) purpose
for which such purchase is being made; and (c)
particularsoflandstobepurchased.
No land use change shall be permitted in such cases
if rehabilitation and resettlement is not complied
withinfull.
The proposed Bill has a provision of Retrospective in
cases where - (i) notification has been issued but no
award under Section 11 of the L.A. Act 1894 has been
made; (ii) an award under Section 11 on the L.A. Act
of 1894 has been made 5 years or more prior to the
commencement of this New Bill but the physical
possession of the land has not been taken or the
compensation has not been paid; and (iii) more than
50 per cent of land owners have not accepted the
compensation.
vResettlement & Rehabilitation (R&R) in
caseofPrivatePurchaseofLand
vRetrospective Applicability of the New
Bill
37 AUGUST-SEPTEMBER 2013
Q.Do you think the proposed Bill will raise the cost of
acquiringland?Ifyes,byhowmuch?
Q. Apart from the cost, what is industry's view on the
process of land acquisition as stipulated in the new
Bill?
A. As per the proposed provisions in the new Bill, CII
estimates predict that cost of land acquisition in the
countryislikelytoincreaseby3-3.5times.
At a time when economy is trying to recover from the
slowdown and National Manufacturing Policy (NMP)
has set an ambitious target of creating 100 million
jobs by 2025, enhanced cost of land acquisition could
severely affect the viability of industrial projects
acrosstheboardanderodecompetitivenessofIndian
manufacturingsector.
We in CII had suggested that since the proposed
formula in the new Bill to calculate market value of
thelandalreadyhas'Multiplier'totake careofunder-
valuation of land, 'Solatium' should be dropped and if
at all it has to be retained, it should be reduced from
the proposed 100 per cent to 30 per cent. Similarly,
R&R provisions should have been worked out
separately for each category of affected families,
depending upon their losses, with the ultimate
objective of improving their quality of lives, post land
acquisition.
A. The process of land acquisition, starting from the
Social Impact Analysis (SIA) up to the possession of
the Land by the Collector, as proposed in the new Bill
is highly complex and time taking, stretching up to a
minimum of 56 Months. This elaborate process needs
tobesimplifiedbyeithereliminatingfewprocessesor
Q. Do you think the proposed Right to Fair
Compensation and Transparency in Land Acquisition,
Rehabilitation and Resettlement Bill, 2013 is a step in
therightdirection?
A. We in CII have always believed that India has and can
have enough land for all its requirements -
Agricultural, Industrial & Domestic, provided they are
used judiciously and 'Supply' is managed efficiently. It
is in this background that review of the archaic Land
Acquisition Act of 1894 has come at a very
appropriatetime.
Right to Fair Compensation and Transparency in Land
Acquisition, Rehabilitation and Resettlement Bill,
2013, which is currently awaiting President's formal
approvalisamilestonesinceitisthefirsteverattempt
to combine Resettlement of project affected people
and their Rehabilitation (R&R) with land acquisition.
Thisbecomesevenmoreimportantinthewakeofthe
fact that last decade has witnessed several cases of
land acquisition, especially in Government projects
where compensation to the project affected people
has not been fair and resettlement and rehabilitation
measures for the affected people have not been
proper.
Besides, the fact that Government would continue to
acquire land for the Industry, as proposed in the new
legislation, is heartening as we have always
maintained that Government should have a
prominent role in land acquisition as agglomerating
land from numerous owners is not a task which
corporate sector can do effectively, especially in the
absence of proper land records and small & scattered
land-holdingsinthecountry.
Mr B Muthuraman
Chairman, CII National Task Force on Land Acquisition
Past President, CII and Vice Chairman, Tata Steel Limited
CII View Point
LARR Bill: A Step Forward, Yet Industry Has Concerns
38ECONOMY MATTERS
adversely affect Industries that, by nature, grow in
phases. Instead, we had suggested for a 'Land Use
Plan' framework and align return of land with it,
which can be monitored by the Chief Secretary of the
concernedStateonacase-to-casebasis.
A. Digitization of Land Records: Over decades, the land
records have been maintained & upgraded manually
onad-hocbasiswithhardlyanyfocusonaccuracyand
authenticity. Archaic and un-authentic land records
are the biggest pit-falls and road-blocks in land
acquisition & disbursement of compensation. To
streamline and bring transparency, CII strongly
recommends speedy digitization of land records by
state Government and the availability of these
records on-line. The digitization of land records,
across all States, over a specified time period, with
comprehensive scrutiny would help make land
records transparent, tamper-proof and facilitate
detailed planning of land use for industrial,
agricultureandresidentialdevelopment.
Zoning of Land: Simultaneously with digitization, CII
alsorecommendsex-antezoningoflandsoastohave
aclearmapping,identificationandsegregationofthe
land for various purposes, over a 100 - 150 year
horizon. Updating, digitization and zoning of land
records will be key for achieving success in the
processofsystematicdevelopmentofindustrialland.
Set up State Land Bank Corporations: CII
recommends setting up of dedicated Institutions for
acquiring fallow, barren and unproductive as well as
other Lands, ex-ante, for Industrial purposes, as a
transparent and viable solution to the problem. The
job of these State Land Bank Corporations would be
to scientifically acquire large tracts of non-cultivable
and other lands, develop them as Land Banks for the
future and have a transparent mechanism to pass
themontotheprivatesector.
Q.Does CII have other suggestions for successfully
resolving the issue of Land Acquisition in the long
run?
making them simultaneous, with an objective to
facilitate an acquisition within a minimum time line of
2years.
A. Industry has specific concerns and suggestions on
some of the key provisions of the proposed new Bill.
First, though Government would continue to acquire
land for Private Sector and PPP Projects, mandatory
consent requirement from affected families - 80 per
cent and 70 per cent for private sector & PPP
respectively appears to be very high and continues to
be a cause of concern. The process of obtaining
consent as provided in the new Bill in itself is long
drawn out, goes through various stages, taking up to
several years. We in CII had suggested that consent
provision should be limited to 60 per cent of the land
owners.
Second, providing for R&R entitlements to affected
families in cases of direct acquisition of land from the
owners above a certain threshold, to be determined
bytheStates,couldalsohavebeenavoided.Assellers
would have already bargained for the premium on
land value in cases of direct purchase, we had
suggested laying down of suitable R&R entitlements
onlyforaffectedfamilieswholosetheirlivelihoodasa
resultofsuchlandacquisition.
Third, retrospective applicability of the new
legislation under certain cases has also raised
Industry apprehensions. To avoid delays and
consequent cost escalation, CII had maintained right
from the beginning that where land acquisition
notification under section 11 of LA Act 1894 has
already been issued and the process of award
initiated, land acquisition process should be
continuedandnotstartedafresh.
Fourth, the provision as per the new Bill stipulating
return of the unutilized land after 5 years to owner or
totheStateLandBank(SLB),asthecasemaybecould
Q.What are some of the other concerns regarding the
newBill?
39 AUGUST-SEPTEMBER 2013
Process (Sequential) Detail Minimum Stipulated Time
Social Impact Analysis (SIA) Preparation of Social Impact Analysis(SIA) 6 Months
in consultation with the concerned
Panchayat, Municipality or Municipal
Corporation
Multi-disciplinary Expert Group Appraisal of SIA by an independent multi- 2 Months
disciplinary Expert Group constituted by
the appropriate Government
Preliminary Notification Publication of Preliminary Notification along 12 Months
with the details of land to be acquired and
determination of market value of land
Publication of Declaration Appropriate Government to publish the 12 Months
declaration after Requiring Body deposits
the amount & examining of any objections
Award Collector shall make the award 12 Months
Corrections to Awards Clerical or Arithmetical Corrections to 6 Months
Awards by Collector
Possession of Land Collector shall take possession of land 3 Months for the
(after ensuring full payment of compensation compensation and a period
as well as rehabilitation and resettlement of 6 Months for the
entitlements are paid or tendered to the monetary part of R&R
entitled persons) entitlements
Table 1: Minimum Stipulated Time Frame under Various Processes
Economy Matters, August - September 2013

Contenu connexe

Tendances

India budget 2015 pdf.pdf1
India budget 2015   pdf.pdf1India budget 2015   pdf.pdf1
India budget 2015 pdf.pdf1
maidur
 
Presentation on government policies for small
Presentation on government policies for smallPresentation on government policies for small
Presentation on government policies for small
Shalu Bijani
 
Real estate - Making India_Ernst and Young
Real estate - Making India_Ernst and YoungReal estate - Making India_Ernst and Young
Real estate - Making India_Ernst and Young
Pratik Chawla
 
Sourajit Aiyer - Business & Money UK - Will the Indian Elephant dance again, ...
Sourajit Aiyer - Business & Money UK - Will the Indian Elephant dance again, ...Sourajit Aiyer - Business & Money UK - Will the Indian Elephant dance again, ...
Sourajit Aiyer - Business & Money UK - Will the Indian Elephant dance again, ...
South Asia Fast Track
 
Economic Times Global Business Summit: Sights and Substance
Economic Times Global Business Summit: Sights and SubstanceEconomic Times Global Business Summit: Sights and Substance
Economic Times Global Business Summit: Sights and Substance
Kiran Shaw
 

Tendances (20)

Make in india - The Way Ahead Class 12 Economics Project
Make in india - The Way Ahead Class 12 Economics ProjectMake in india - The Way Ahead Class 12 Economics Project
Make in india - The Way Ahead Class 12 Economics Project
 
Foreign Direct Investment
Foreign Direct InvestmentForeign Direct Investment
Foreign Direct Investment
 
India budget 2015 pdf.pdf1
India budget 2015   pdf.pdf1India budget 2015   pdf.pdf1
India budget 2015 pdf.pdf1
 
Doing Business in India
Doing Business in IndiaDoing Business in India
Doing Business in India
 
Indian budget 2020: An Economic Perspective
Indian budget 2020: An Economic PerspectiveIndian budget 2020: An Economic Perspective
Indian budget 2020: An Economic Perspective
 
Small industries devlopment bank of india (sidbi)1234
Small industries devlopment bank of india (sidbi)1234Small industries devlopment bank of india (sidbi)1234
Small industries devlopment bank of india (sidbi)1234
 
Ease of doing business in india
Ease of doing business in indiaEase of doing business in india
Ease of doing business in india
 
Presentation on government policies for small
Presentation on government policies for smallPresentation on government policies for small
Presentation on government policies for small
 
Make in india
Make in indiaMake in india
Make in india
 
Real estate - Making India_Ernst and Young
Real estate - Making India_Ernst and YoungReal estate - Making India_Ernst and Young
Real estate - Making India_Ernst and Young
 
Sourajit Aiyer - Business & Money UK - Will the Indian Elephant dance again, ...
Sourajit Aiyer - Business & Money UK - Will the Indian Elephant dance again, ...Sourajit Aiyer - Business & Money UK - Will the Indian Elephant dance again, ...
Sourajit Aiyer - Business & Money UK - Will the Indian Elephant dance again, ...
 
ppt for govt. schemes and agenices for SSI
ppt for govt. schemes and agenices for SSIppt for govt. schemes and agenices for SSI
ppt for govt. schemes and agenices for SSI
 
Economic Times Global Business Summit: Sights and Substance
Economic Times Global Business Summit: Sights and SubstanceEconomic Times Global Business Summit: Sights and Substance
Economic Times Global Business Summit: Sights and Substance
 
Corporate Governance and Industrial Policy
Corporate Governance and Industrial Policy Corporate Governance and Industrial Policy
Corporate Governance and Industrial Policy
 
71-77
71-7771-77
71-77
 
FICCI's Voice (April 2015)
FICCI's Voice (April 2015)FICCI's Voice (April 2015)
FICCI's Voice (April 2015)
 
Gujarat Vibarant
Gujarat VibarantGujarat Vibarant
Gujarat Vibarant
 
Policy of the government Regarding Small Industries and Providing Guidance
Policy of the government Regarding Small Industries and Providing GuidancePolicy of the government Regarding Small Industries and Providing Guidance
Policy of the government Regarding Small Industries and Providing Guidance
 
Ghaziabad Industrial Policy
Ghaziabad  Industrial Policy Ghaziabad  Industrial Policy
Ghaziabad Industrial Policy
 
Roles of small scale industries in india
Roles of small scale industries in india Roles of small scale industries in india
Roles of small scale industries in india
 

En vedette

Cmmaao resource-commitment-matrix-pmi-pmp
Cmmaao resource-commitment-matrix-pmi-pmpCmmaao resource-commitment-matrix-pmi-pmp
Cmmaao resource-commitment-matrix-pmi-pmp
vishvasyadav45
 
Ekošampon tiande cz
Ekošampon tiande czEkošampon tiande cz
Ekošampon tiande cz
Liza Alypova
 
無題プレゼンテーション13
無題プレゼンテーション13無題プレゼンテーション13
無題プレゼンテーション13
s1200017
 
Mission vishvas-resume template-5
Mission vishvas-resume template-5Mission vishvas-resume template-5
Mission vishvas-resume template-5
vishvasyadav45
 
Cmmaao pmi-resume template-17
Cmmaao pmi-resume template-17Cmmaao pmi-resume template-17
Cmmaao pmi-resume template-17
vishvasyadav45
 
Project management certification program
Project management certification programProject management certification program
Project management certification program
vishvasyadav45
 
Mission vishvas-resume template-8
Mission vishvas-resume template-8Mission vishvas-resume template-8
Mission vishvas-resume template-8
vishvasyadav45
 
Pmp pmi-resume template1
Pmp pmi-resume template1Pmp pmi-resume template1
Pmp pmi-resume template1
vishvasyadav45
 
Counseling Client Presentation
Counseling Client PresentationCounseling Client Presentation
Counseling Client Presentation
Lauren Franco
 
Fa102 a project
Fa102 a projectFa102 a project
Fa102 a project
MWinke1
 
Будь лидером! (Сергей Архипенков)
Будь лидером! (Сергей Архипенков)Будь лидером! (Сергей Архипенков)
Будь лидером! (Сергей Архипенков)
Ontico
 

En vedette (20)

Abstracts of the workshop, Interrogating Change: Central Asia between Timeles...
Abstracts of the workshop, Interrogating Change: Central Asia between Timeles...Abstracts of the workshop, Interrogating Change: Central Asia between Timeles...
Abstracts of the workshop, Interrogating Change: Central Asia between Timeles...
 
Cmmaao resource-commitment-matrix-pmi-pmp
Cmmaao resource-commitment-matrix-pmi-pmpCmmaao resource-commitment-matrix-pmi-pmp
Cmmaao resource-commitment-matrix-pmi-pmp
 
RE/MAX Realty Review - July 2013
RE/MAX Realty Review - July 2013RE/MAX Realty Review - July 2013
RE/MAX Realty Review - July 2013
 
Ekošampon tiande cz
Ekošampon tiande czEkošampon tiande cz
Ekošampon tiande cz
 
無題プレゼンテーション13
無題プレゼンテーション13無題プレゼンテーション13
無題プレゼンテーション13
 
Mission vishvas-resume template-5
Mission vishvas-resume template-5Mission vishvas-resume template-5
Mission vishvas-resume template-5
 
Cmmaao pmi-resume template-17
Cmmaao pmi-resume template-17Cmmaao pmi-resume template-17
Cmmaao pmi-resume template-17
 
Tandm
TandmTandm
Tandm
 
CII Economy Matters, August-September 2014
CII Economy Matters, August-September 2014CII Economy Matters, August-September 2014
CII Economy Matters, August-September 2014
 
Slideshare
SlideshareSlideshare
Slideshare
 
Project management certification program
Project management certification programProject management certification program
Project management certification program
 
Economy Matters: November - December Issue
Economy Matters: November - December IssueEconomy Matters: November - December Issue
Economy Matters: November - December Issue
 
Mission vishvas-resume template-8
Mission vishvas-resume template-8Mission vishvas-resume template-8
Mission vishvas-resume template-8
 
Ontology alignment – is PROV-O good enough?
Ontology alignment – is PROV-O good enough?Ontology alignment – is PROV-O good enough?
Ontology alignment – is PROV-O good enough?
 
Pmp pmi-resume template1
Pmp pmi-resume template1Pmp pmi-resume template1
Pmp pmi-resume template1
 
Economy Matters September- October 2014
Economy Matters September- October 2014 Economy Matters September- October 2014
Economy Matters September- October 2014
 
Counseling Client Presentation
Counseling Client PresentationCounseling Client Presentation
Counseling Client Presentation
 
Fa102 a project
Fa102 a projectFa102 a project
Fa102 a project
 
Будь лидером! (Сергей Архипенков)
Будь лидером! (Сергей Архипенков)Будь лидером! (Сергей Архипенков)
Будь лидером! (Сергей Архипенков)
 
Sigdalurinn mikli
Sigdalurinn mikli Sigdalurinn mikli
Sigdalurinn mikli
 

Similaire à Economy Matters, August - September 2013

Similaire à Economy Matters, August - September 2013 (20)

Economy Matters, Oct-Nov 2013
Economy Matters, Oct-Nov 2013Economy Matters, Oct-Nov 2013
Economy Matters, Oct-Nov 2013
 
CII Economy Matters, September-October 2013
CII Economy Matters, September-October 2013CII Economy Matters, September-October 2013
CII Economy Matters, September-October 2013
 
CII - Confederation of Indian Industry Annual Report -2014
CII - Confederation of Indian Industry Annual Report -2014CII - Confederation of Indian Industry Annual Report -2014
CII - Confederation of Indian Industry Annual Report -2014
 
Emerging Paradigm for India's Manufacturing Sector
Emerging Paradigm for India's Manufacturing Sector Emerging Paradigm for India's Manufacturing Sector
Emerging Paradigm for India's Manufacturing Sector
 
CII Policy Watch, June 2014 : Accelerating Growth, Creating Employment
CII Policy Watch, June 2014 : Accelerating Growth, Creating EmploymentCII Policy Watch, June 2014 : Accelerating Growth, Creating Employment
CII Policy Watch, June 2014 : Accelerating Growth, Creating Employment
 
smallscaleindustries-170219083220 (3).pdf
smallscaleindustries-170219083220 (3).pdfsmallscaleindustries-170219083220 (3).pdf
smallscaleindustries-170219083220 (3).pdf
 
Msme Sector in India
Msme Sector in IndiaMsme Sector in India
Msme Sector in India
 
FICCI's Voice - August 2015
FICCI's Voice - August 2015FICCI's Voice - August 2015
FICCI's Voice - August 2015
 
ASSOCHAM Bulletin September (1).pdf
ASSOCHAM Bulletin September (1).pdfASSOCHAM Bulletin September (1).pdf
ASSOCHAM Bulletin September (1).pdf
 
Make in india
Make in indiaMake in india
Make in india
 
FICCI's Voice (February 2016)
FICCI's Voice (February 2016)FICCI's Voice (February 2016)
FICCI's Voice (February 2016)
 
CII Policy Watch [on] Manufacturing Sector
CII Policy Watch [on] Manufacturing SectorCII Policy Watch [on] Manufacturing Sector
CII Policy Watch [on] Manufacturing Sector
 
Indian Century-Relaunching The Indian Story.
Indian Century-Relaunching The Indian Story.Indian Century-Relaunching The Indian Story.
Indian Century-Relaunching The Indian Story.
 
The time to ‘Make in India’ is NOW
The time to ‘Make in India’ is NOWThe time to ‘Make in India’ is NOW
The time to ‘Make in India’ is NOW
 
CII Policy Watch: Manufacturing
CII Policy Watch: ManufacturingCII Policy Watch: Manufacturing
CII Policy Watch: Manufacturing
 
Deloitte budget 2022 23 expectations
Deloitte budget 2022 23 expectationsDeloitte budget 2022 23 expectations
Deloitte budget 2022 23 expectations
 
CII Policy Watch on Innovation
CII Policy Watch on InnovationCII Policy Watch on Innovation
CII Policy Watch on Innovation
 
FICCI's Voice | July 2015
FICCI's Voice | July 2015FICCI's Voice | July 2015
FICCI's Voice | July 2015
 
FICCI Voice (December 2015)
FICCI Voice (December 2015)FICCI Voice (December 2015)
FICCI Voice (December 2015)
 
FICCI Voice (Jaunuary 2016)
FICCI Voice (Jaunuary 2016)FICCI Voice (Jaunuary 2016)
FICCI Voice (Jaunuary 2016)
 

Plus de Confederation of Indian Industry

CII Whitepaper India Cyber Risk & Resilience Review 2018
CII Whitepaper India Cyber Risk & Resilience Review 2018CII Whitepaper India Cyber Risk & Resilience Review 2018
CII Whitepaper India Cyber Risk & Resilience Review 2018
Confederation of Indian Industry
 
Multilateral Newsletter March-April 2018
Multilateral Newsletter March-April 2018Multilateral Newsletter March-April 2018
Multilateral Newsletter March-April 2018
Confederation of Indian Industry
 
CII-NITI Aayog's 'Cleaner Air Better Life Initiative'
CII-NITI Aayog's 'Cleaner Air Better Life Initiative'CII-NITI Aayog's 'Cleaner Air Better Life Initiative'
CII-NITI Aayog's 'Cleaner Air Better Life Initiative'
Confederation of Indian Industry
 

Plus de Confederation of Indian Industry (20)

Multilateral Newsletter May 2018 Edition
Multilateral Newsletter May 2018 Edition Multilateral Newsletter May 2018 Edition
Multilateral Newsletter May 2018 Edition
 
Economy Matter - June 2018
Economy Matter - June 2018Economy Matter - June 2018
Economy Matter - June 2018
 
Composite Water Management Index - A Tool for Water Management
Composite Water Management Index - A Tool for Water Management Composite Water Management Index - A Tool for Water Management
Composite Water Management Index - A Tool for Water Management
 
Transition to GST: A year into the system
Transition to GST: A year into the systemTransition to GST: A year into the system
Transition to GST: A year into the system
 
CII Whitepaper India Cyber Risk & Resilience Review 2018
CII Whitepaper India Cyber Risk & Resilience Review 2018CII Whitepaper India Cyber Risk & Resilience Review 2018
CII Whitepaper India Cyber Risk & Resilience Review 2018
 
SME - The Game Changers
SME - The Game ChangersSME - The Game Changers
SME - The Game Changers
 
Ease Of Doing Business - Reforms in Maharashtra - May 2018
Ease Of Doing Business - Reforms in Maharashtra - May 2018 Ease Of Doing Business - Reforms in Maharashtra - May 2018
Ease Of Doing Business - Reforms in Maharashtra - May 2018
 
Multilateral Newsletter March-April 2018
Multilateral Newsletter March-April 2018Multilateral Newsletter March-April 2018
Multilateral Newsletter March-April 2018
 
Economy Matters - May 2018
Economy Matters - May 2018Economy Matters - May 2018
Economy Matters - May 2018
 
CII Commuique May 2018
CII Commuique May 2018CII Commuique May 2018
CII Commuique May 2018
 
Ease of Doing Business
Ease of Doing Business Ease of Doing Business
Ease of Doing Business
 
Broadband 2022: Unlocking a Trillion Dollar Digital Economy
Broadband 2022: Unlocking a Trillion Dollar Digital EconomyBroadband 2022: Unlocking a Trillion Dollar Digital Economy
Broadband 2022: Unlocking a Trillion Dollar Digital Economy
 
Indian Industry's Inclusive Footprint in South Africa
Indian Industry's Inclusive Footprint in South Africa Indian Industry's Inclusive Footprint in South Africa
Indian Industry's Inclusive Footprint in South Africa
 
Policy Watch March 2018
Policy Watch March 2018Policy Watch March 2018
Policy Watch March 2018
 
India meets Britain Tracker
India meets Britain Tracker India meets Britain Tracker
India meets Britain Tracker
 
Economy Matters April 2018
Economy Matters April 2018Economy Matters April 2018
Economy Matters April 2018
 
CII Communique April 2018
CII Communique April 2018CII Communique April 2018
CII Communique April 2018
 
CII-NITI Aayog's 'Cleaner Air Better Life Initiative'
CII-NITI Aayog's 'Cleaner Air Better Life Initiative'CII-NITI Aayog's 'Cleaner Air Better Life Initiative'
CII-NITI Aayog's 'Cleaner Air Better Life Initiative'
 
Annual CSR Tracker 2017
Annual CSR Tracker 2017Annual CSR Tracker 2017
Annual CSR Tracker 2017
 
CII IWN - EY Report - The Future is HERe
CII IWN - EY Report - The Future is HEReCII IWN - EY Report - The Future is HERe
CII IWN - EY Report - The Future is HERe
 

Dernier

Al Mizhar Dubai Escorts +971561403006 Escorts Service In Al Mizhar
Al Mizhar Dubai Escorts +971561403006 Escorts Service In Al MizharAl Mizhar Dubai Escorts +971561403006 Escorts Service In Al Mizhar
Al Mizhar Dubai Escorts +971561403006 Escorts Service In Al Mizhar
allensay1
 
unwanted pregnancy Kit [+918133066128] Abortion Pills IN Dubai UAE Abudhabi
unwanted pregnancy Kit [+918133066128] Abortion Pills IN Dubai UAE Abudhabiunwanted pregnancy Kit [+918133066128] Abortion Pills IN Dubai UAE Abudhabi
unwanted pregnancy Kit [+918133066128] Abortion Pills IN Dubai UAE Abudhabi
Abortion pills in Kuwait Cytotec pills in Kuwait
 
Quick Doctor In Kuwait +2773`7758`557 Kuwait Doha Qatar Dubai Abu Dhabi Sharj...
Quick Doctor In Kuwait +2773`7758`557 Kuwait Doha Qatar Dubai Abu Dhabi Sharj...Quick Doctor In Kuwait +2773`7758`557 Kuwait Doha Qatar Dubai Abu Dhabi Sharj...
Quick Doctor In Kuwait +2773`7758`557 Kuwait Doha Qatar Dubai Abu Dhabi Sharj...
daisycvs
 
Jual Obat Aborsi ( Asli No.1 ) 085657271886 Obat Penggugur Kandungan Cytotec
Jual Obat Aborsi ( Asli No.1 ) 085657271886 Obat Penggugur Kandungan CytotecJual Obat Aborsi ( Asli No.1 ) 085657271886 Obat Penggugur Kandungan Cytotec
Jual Obat Aborsi ( Asli No.1 ) 085657271886 Obat Penggugur Kandungan Cytotec
ZurliaSoop
 
!~+971581248768>> SAFE AND ORIGINAL ABORTION PILLS FOR SALE IN DUBAI AND ABUD...
!~+971581248768>> SAFE AND ORIGINAL ABORTION PILLS FOR SALE IN DUBAI AND ABUD...!~+971581248768>> SAFE AND ORIGINAL ABORTION PILLS FOR SALE IN DUBAI AND ABUD...
!~+971581248768>> SAFE AND ORIGINAL ABORTION PILLS FOR SALE IN DUBAI AND ABUD...
DUBAI (+971)581248768 BUY ABORTION PILLS IN ABU dhabi...Qatar
 
Mifty kit IN Salmiya (+918133066128) Abortion pills IN Salmiyah Cytotec pills
Mifty kit IN Salmiya (+918133066128) Abortion pills IN Salmiyah Cytotec pillsMifty kit IN Salmiya (+918133066128) Abortion pills IN Salmiyah Cytotec pills
Mifty kit IN Salmiya (+918133066128) Abortion pills IN Salmiyah Cytotec pills
Abortion pills in Kuwait Cytotec pills in Kuwait
 

Dernier (20)

Putting the SPARK into Virtual Training.pptx
Putting the SPARK into Virtual Training.pptxPutting the SPARK into Virtual Training.pptx
Putting the SPARK into Virtual Training.pptx
 
Al Mizhar Dubai Escorts +971561403006 Escorts Service In Al Mizhar
Al Mizhar Dubai Escorts +971561403006 Escorts Service In Al MizharAl Mizhar Dubai Escorts +971561403006 Escorts Service In Al Mizhar
Al Mizhar Dubai Escorts +971561403006 Escorts Service In Al Mizhar
 
unwanted pregnancy Kit [+918133066128] Abortion Pills IN Dubai UAE Abudhabi
unwanted pregnancy Kit [+918133066128] Abortion Pills IN Dubai UAE Abudhabiunwanted pregnancy Kit [+918133066128] Abortion Pills IN Dubai UAE Abudhabi
unwanted pregnancy Kit [+918133066128] Abortion Pills IN Dubai UAE Abudhabi
 
Marel Q1 2024 Investor Presentation from May 8, 2024
Marel Q1 2024 Investor Presentation from May 8, 2024Marel Q1 2024 Investor Presentation from May 8, 2024
Marel Q1 2024 Investor Presentation from May 8, 2024
 
Power point presentation on enterprise performance management
Power point presentation on enterprise performance managementPower point presentation on enterprise performance management
Power point presentation on enterprise performance management
 
Horngren’s Cost Accounting A Managerial Emphasis, Canadian 9th edition soluti...
Horngren’s Cost Accounting A Managerial Emphasis, Canadian 9th edition soluti...Horngren’s Cost Accounting A Managerial Emphasis, Canadian 9th edition soluti...
Horngren’s Cost Accounting A Managerial Emphasis, Canadian 9th edition soluti...
 
Uneak White's Personal Brand Exploration Presentation
Uneak White's Personal Brand Exploration PresentationUneak White's Personal Brand Exploration Presentation
Uneak White's Personal Brand Exploration Presentation
 
Quick Doctor In Kuwait +2773`7758`557 Kuwait Doha Qatar Dubai Abu Dhabi Sharj...
Quick Doctor In Kuwait +2773`7758`557 Kuwait Doha Qatar Dubai Abu Dhabi Sharj...Quick Doctor In Kuwait +2773`7758`557 Kuwait Doha Qatar Dubai Abu Dhabi Sharj...
Quick Doctor In Kuwait +2773`7758`557 Kuwait Doha Qatar Dubai Abu Dhabi Sharj...
 
Jual Obat Aborsi ( Asli No.1 ) 085657271886 Obat Penggugur Kandungan Cytotec
Jual Obat Aborsi ( Asli No.1 ) 085657271886 Obat Penggugur Kandungan CytotecJual Obat Aborsi ( Asli No.1 ) 085657271886 Obat Penggugur Kandungan Cytotec
Jual Obat Aborsi ( Asli No.1 ) 085657271886 Obat Penggugur Kandungan Cytotec
 
!~+971581248768>> SAFE AND ORIGINAL ABORTION PILLS FOR SALE IN DUBAI AND ABUD...
!~+971581248768>> SAFE AND ORIGINAL ABORTION PILLS FOR SALE IN DUBAI AND ABUD...!~+971581248768>> SAFE AND ORIGINAL ABORTION PILLS FOR SALE IN DUBAI AND ABUD...
!~+971581248768>> SAFE AND ORIGINAL ABORTION PILLS FOR SALE IN DUBAI AND ABUD...
 
Falcon Invoice Discounting: Unlock Your Business Potential
Falcon Invoice Discounting: Unlock Your Business PotentialFalcon Invoice Discounting: Unlock Your Business Potential
Falcon Invoice Discounting: Unlock Your Business Potential
 
How to Get Started in Social Media for Art League City
How to Get Started in Social Media for Art League CityHow to Get Started in Social Media for Art League City
How to Get Started in Social Media for Art League City
 
Paradip CALL GIRL❤7091819311❤CALL GIRLS IN ESCORT SERVICE WE ARE PROVIDING
Paradip CALL GIRL❤7091819311❤CALL GIRLS IN ESCORT SERVICE WE ARE PROVIDINGParadip CALL GIRL❤7091819311❤CALL GIRLS IN ESCORT SERVICE WE ARE PROVIDING
Paradip CALL GIRL❤7091819311❤CALL GIRLS IN ESCORT SERVICE WE ARE PROVIDING
 
HomeRoots Pitch Deck | Investor Insights | April 2024
HomeRoots Pitch Deck | Investor Insights | April 2024HomeRoots Pitch Deck | Investor Insights | April 2024
HomeRoots Pitch Deck | Investor Insights | April 2024
 
Arti Languages Pre Seed Teaser Deck 2024.pdf
Arti Languages Pre Seed Teaser Deck 2024.pdfArti Languages Pre Seed Teaser Deck 2024.pdf
Arti Languages Pre Seed Teaser Deck 2024.pdf
 
Mifty kit IN Salmiya (+918133066128) Abortion pills IN Salmiyah Cytotec pills
Mifty kit IN Salmiya (+918133066128) Abortion pills IN Salmiyah Cytotec pillsMifty kit IN Salmiya (+918133066128) Abortion pills IN Salmiyah Cytotec pills
Mifty kit IN Salmiya (+918133066128) Abortion pills IN Salmiyah Cytotec pills
 
Falcon Invoice Discounting: Empowering Your Business Growth
Falcon Invoice Discounting: Empowering Your Business GrowthFalcon Invoice Discounting: Empowering Your Business Growth
Falcon Invoice Discounting: Empowering Your Business Growth
 
Lucknow Housewife Escorts by Sexy Bhabhi Service 8250092165
Lucknow Housewife Escorts  by Sexy Bhabhi Service 8250092165Lucknow Housewife Escorts  by Sexy Bhabhi Service 8250092165
Lucknow Housewife Escorts by Sexy Bhabhi Service 8250092165
 
BeMetals Investor Presentation_May 3, 2024.pdf
BeMetals Investor Presentation_May 3, 2024.pdfBeMetals Investor Presentation_May 3, 2024.pdf
BeMetals Investor Presentation_May 3, 2024.pdf
 
Buy Verified TransferWise Accounts From Seosmmearth
Buy Verified TransferWise Accounts From SeosmmearthBuy Verified TransferWise Accounts From Seosmmearth
Buy Verified TransferWise Accounts From Seosmmearth
 

Economy Matters, August - September 2013

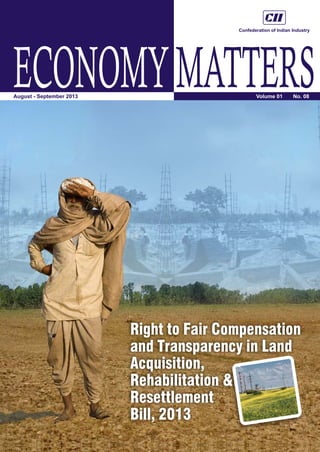
  • 1. ECONOMYMATTERS Right to Fair Compensation and Transparency in Land Acquisition, Rehabilitation & Resettlement Bill, 2013 Volume 01 No. 08August - September 2013
  • 2.
  • 3. Our major neighboring economies- Sri Lanka, Bangladesh, Pakistan and Nepal - too are facing the heat as both global slowdown and country specific factors have stunted their domestic economic growth. The Sri Lankan economy bounced back strongly after the end of the civil war, but has not been immune to the global headwinds. Bangladesh has been fast emerging as a manufacturing hub in view of its low labour cost. Pakistan, on the other hand, finds itself embroiled in the worst ever fiscal deterioration due to inefficient performance of various government sector enterprises and the mounting cost of maintaining internal security in the country. Nepal is facing the classic macroeconomic dilemma of low growth and high inflation. Going forward, the growth outlook in these economies will be contingent upon the pace of recovery of the advanced economies and theirinternaldomesticresilience. The domestic scenario looks equally challenging at present, with the first quarter GDP numbersconfirmingthatwearenotoutofthewoodsasyet.Withmonsoonsbeingnormal, a good agricultural performance coupled with rise in rural wages would help bolster rural demand. But, that by itself is not adequate, when the other indicators are all southward bound. There are no visible signs of investment pick up as investor sentiments continue to be very low. A weak rupee, tight liquidity, high cost of funds, procedural delays, etc are all cominginthewayofaninvestmentrevival.AcoordinatedeffortfromtheGovernmentand the RBI is required to ensure that this vicious cycle is broken. Hastening disinvestment of public sector units, ensuring coal supplies to the power sector, promoting competition in the mining sector and ensuring speedy implementation of Delhi Mumbai Industrial Corridor (DMIC), all of which require non-legislative action, would be seen as positive developments. The Right to Fair Compensation, Resettlement, Rehabilitation and Transparency in Land Acquisition Bill 2013 will be a milestone since it is the first ever attempt to combine Resettlement of Project Affected People and their Rehabilitation (R&R) along with land acquisition. Besides, the new Bill provides a prominent role for Government in land acquisition process for the Industry, which is a very welcome step. Industry however continuesto have apprehensionson some of the key provisionsof the Bill. These pertainto compensation package and R&R entitlements; Consent Clause; Acquisition of Irrigated Multi-Crop Land; Retrospective Applicability of the Bill; Return of Un-utilised Land etc. Besides, the process of land acquisition, as proposed in the new Bill is highly complex and time taking, stretching up to a minimum of 56 Months. While the objective should be improving quality of life of affected families post land acquisition, it is imperative to streamline the land acquisition mechanism in the country in a manner that balances the interestsofaffectedfamilieswithindustryaffordability. Chandrajit Banerjee Director-General, CII 1 AUGUST-SEPTEMBER 2013 FOREWORD
  • 4. DISCLAIMER Copyright©2013byConfederationofIndianIndustry(CII),Allrightsreserved. Nopartofthispublicationmaybereproduced,storedin,orintroducedintoaretrievalsystem,ortransmittedinanyformorby any means (electronic, mechanical, photocopying, recording or otherwise), without the prior written permission of the copyright owner. CII has made every effort to ensure the accuracy of information presented in this document. However, neitherCII noranyofitsofficebearersoranalystsoremployeescanbeheld responsibleforanyfinancialconsequencesarising outoftheuse ofinformationprovidedherein.However,incaseofanydiscrepancy,error,etc., samemayplease be broughtto thenoticeofCIIforappropriatecorrections. Published by Confederation of Indian Industry (CII), The Mantosh Sondhi Centre; 23, Institutional Area, Lodi Road, New Delhi- 110003(INDIA), Tel:+91-11-24629994-7,Fax:+91-11-24626149;Email:info@cii.in;Web:www.cii.in 2ECONOMY MATTERS TheConfederationofIndianIndustry(CII)workstocreateandsustainanenvironmentconducivetothedevelopmentofIndia, partneringindustry,Government,andcivilsociety,throughadvisoryandconsultativeprocesses. CII is a non-government, not-for-profit, industry-led and industry-managed organization, playing a proactive role in India's development process. Founded over 118 years ago, India's premier business association has over 7100 members, from the private as well as public sectors, including SMEs and MNCs, and an indirect membership of over 90,000 enterprises from around257nationalandregionalsectoralindustrybodies. CII charts change by working closely with Government on policy issues, interfacing with thought leaders, and enhancing efficiency, competitiveness and business opportunities for industry through a range of specialized services and strategic globallinkages.Italsoprovidesaplatformforconsensus-buildingandnetworkingonkeyissues. Extending its agenda beyond business, CII assists industry to identify and execute corporate citizenship programmes. Partnerships with civil society organizations carry forward corporate initiatives for integrated and inclusive development across diverse domains including affirmative action, healthcare, education, livelihood, diversity management, skill development,empowermentofwomen,andwater,tonameafew. The CII Theme for 2013-14 is Accelerating Economic Growth through Innovation, Transformation, Inclusion and Governance. Towards this, CII advocacy will accord top priority to stepping up the growth trajectory of the nation, while retaining a strong focus on accountability, transparency and measurement in the corporate and social eco-system, building a knowledge economy,andbroad-basingdevelopmenttohelpdeliverthefruitsofprogresstoall. With63offices,including10CentresofExcellence,inIndia,and7overseasofficesinAustralia,China,Egypt,France,Singapore, UK, and USA, as well as institutional partnerships with 224 counterpart organizations in 90 countries, CII serves as a reference pointforIndianindustryandtheinternationalbusinesscommunity. ABOUT CII Research The CII Research team regularly tracks economic, political and business developments within India and abroad to comment on theemergingeconomicscenariofortheIndiancorporatesector.Ittrackspolicydevelopments,offerscomprehensiveanalysis of industries and comments on and analyzes the economic climate through its regular publications– Economy Matters, BusinessOutlookSurveyand,FortnightlyEconomicUpdates. Wehavein-houseexpertiseinprovidingthemostcomprehensive,in-depth,unbiasedandincisiveanalysisandforecastsonthe Indian economy and various sectors. CII Research is also well versed and well equipped to offer customized research based consultancy services on any theme. It has been catering to the needs of various stakeholders including industries, business houses and government providing meaningful insights about the prevailing trends, outlook on likely future trends, factors behind these trends, existing government policies and policy recommendations with an objective to help stakeholders in better understanding of the issues at hand. The objective of CII Research is to assist stakeholders in taking more informed and strategicdecisionswithduefocusontheattainmentofshorttermaswellaslongtermgoals. Formoredetailsandtoadvertise inourproducts,writetousatecoresearch@cii.in
  • 5. CONTENT Cover Story The passage of Land Acquisition Bill by both Houses of Parliament has brought little cheer to the industry as there are concerns on some of its provisions.Cost of land acquisition is likely to increase by 3-3.5 times, making industrial projects unviable and raising costs intheoveralleconomy.Wediscuss the key provisions of the new Bill andhowitwouldbringoutabouta change in the existing scenario in thismonth’sSpecialArticle. 3 AUGUST-SEPTEMBER 2013 Inside This Issue Executive Summary.................................................................04 GDP Forecasts Scaled Down for 2013-14.......................07 T A X E S Global Trends 08 Deciphering Trends in the Major South Asian Economies Domestic Trends GDP, IIP, Inflation & External Sector 15 Taxation Draft Safe Harbour Rules - Do they Bridge or Widen the Taxpayer-Exchequer Divide? 22 Sector in Focus Capital Goods 27 Special Article Right to Fair Compensation and Transparency in Land Acquisition, Rehabilitation & Resettlement Bill, 201334 Corporate Performance Industry Under Pressure as Growth Dips Further 24 Economy Monitor ................................................................... 43 Special Feature Green Manufacturing: The Next Big Opportunity 40
  • 6. GlobalTrends DomesticTrends CorporatePerformance ThelargeSouthAsianeconomies(ex-India),viz,SriLanka, Bangladesh, Pakistan and Nepal are facing varied sets of problems precipitated as a result of the global slowdown and country specific factors. The Sri Lankan economy has bounced back strongly after the end of the civil war, but has not been immune to global headwinds. Bangladesh has been fast emerging as a manufacturing hub in view of its low labour cost. Pakistan on the other hand is facing mounting difficulties in the wake of sharp increase in fiscal deficit coupled with internal security strife. The smallest economy of the region, Nepal on the other hand is facing the classic macroeconomic dilemma of low growth and high inflation. Going forward, the growth outlook in these economies will be contingent upon the pace of recovery of the advanced economies and their internaldomesticresilience. GDP growth moderated to its more than four-year low of 4.4 per cent in the first quarter GDP growth dropped to a four-year low of 4.4 per cent of the current fiscal as compared to 4.8 per cent in the quarter before. This is the lowest quarterly growth rate since March 2009, when the global financial crisis was at its peak. The downslide was drivenbyaweakindustrialperformance,whichslippedto a its multi-year low. Inflation on the other hand has continued to accelerate, rising to 6.1 per cent in August 2013mainlyduetohighfoodprices.Ontheexternalfront, improvementintheglobalscenariohasprovidedafillipto exports growth, which accelerated to 13 per cent in August 2013, while imports contracted due to subdued demandintheeconomyandimpactofaweakRupee. The deepening economic slowdown, rising interest rates, tight liquidity, declining investments and depreciating rupee are slowly taking a toll on India Inc's financial performance with majority of companies witnessing a decline in net profits for the past few quarters. The corporateresultsattheendoffirstquarter(April-June)of the current fiscal painted a rather gloomy picture as the financial performance of Indian companies deteriorated. While revenues plummeted sharply, corporate sector continued to pull expenses down against the backdrop of a clouded economic outlook. However, the reduction in expenditure costs was not large enough to provide to cushion the bottom-line of the firms. Consequently, there was de-growth witnessed in profit-after-tax (PAT) on an aggregate basis in the first quarter of 2013-14. Margins, bothnetandgrosssawandeteriorationinthequartertoo, reflecting the fall in profitability. Our analysis is based on the financial performance of balanced panel of 2,701 firms (extractedonAugust29,2013). Capital goods sector is of strategic importance for the Indian economy. Being large and diverse in nature and playing a critical role in production process, the sector has high multiplier effect on the overall growth of the economy. The sector not only determines the pace of economicexpansionbut also gets influenced by the same. However, the negative growth recorded by the capital goods sector over the last two years is a matter of concern. Declining production in the sector was reflected intheimportsofcapitalgoodstoo,whichwitnessedsharp increase over the last decade or so, supported by a relatively low rate of customs duty in the range of 0.0-7.5 per cent. Poor performance of the sector has much to do withthelowcostcompetitivenessofthesector,whichhas magnified in the face of the economic slowdown. While revival of manufacturing growth is critical for capital goods sector, healthy growth performance of capital goodssectortoocanhelptherevivalprocess. The passage of Land Acquisition bill by both Houses of Parliamenthasbroughtlittlecheertotheindustryasthere are concerns on some of the provisions of the Bill. Cost of land acquisition is likely to increase by 3-3.5 times, making industrial projects unviable and raising costs in the overall Indianeconomy.TheBillwouldalsoleadtomajordelaysin theprocessofLandAcquisitionastakingtheconsentof80 per cent of affected families for Private Sector and 70 per cent of affected families for Public Private Partnership (PPP) Projects under 'Public Purpose' in the Bill would make the process of obtaining consent a very long drawn out process. Further, retrospective applicability of the Bill would severely affect the on-going industry projects as re- starting the entire land acquisition process would lead to avoidable delays and consequent cost over-runs. CII however does appreciate the holistic nature of the Bill and role of government in acquiring land. However, at a time when major projects are stalled and India's global competitiveness is eroding, a more facilitative land acquisition process would have helped long-term growth andrestoreinvestorsentiments. Sector in Focus: Capital Goods SpecialArticle EXECUTIVE SUMMARY 4ECONOMY MATTERS
  • 7.
  • 8. ECONOMYMATTERS n n n Keeps readers abreast of global & domestic economic developments Monthly Journal of top management of 8000 companies Read by CII Members, Thought Leaders, Diplomats, Policy Makers, MPs and other decision makers The Facts n n n n n n Domestic Trends Corporate Performance Sector in Focus Special Article Economy Monitor Global Trends The Coverage CII invites full-page* Advertisements for this flagship document at an attractive rate of Rs 50,000 per issue and Rs 5 lakh for 12 issues. For more details, Please Contact: Confederation of Indian Industry The Mantosh Sondhi Centre, 23, Institutional Area, Lodi Road, New Delhi- 110003 (INDIA) Tel : +91-011-24629994-7, Fax: +91-011-24626149; Email: Ecoresearch@cii.in Dr. Danish A. Hashim, Director- Economic Research
  • 9. GDP FORECAST GDP Forecasts Scaled Down for 2013-14 (y-o-y%) Old Forecasts New Forecasts BNP Paribas 5.2 3.7 HSBC 5.5 4.0 Goldman Sachs 6.4 4.0 Standard Chartered 5.1 4.1 Nomura 5.0 4.2 JP Morgan 5.5 4.7 Macquarie 6.2 5.3 CRISIL 5.5 4.8 RBI 5.7 5.5 PM Economic Advisory Council 6.4 5.3 CII 6.0-6.4 5.3-5.8 7 AUGUST-SEPTEMBER 2013
  • 10. Deciphering Trends in the Major South Asian Economies below trend performance by the agriculture and services sectors, which grew at 2 per cent and 4.3 per cent, respectively. Services sector is the most dominant sector of the Sri Lankan economy, having a share of above 50 per cent in the total GDP, followed by industry at around 30 per cent and agriculture constituting the remaining. The sharp deceleration witnessed in agriculture was due to the drop in production of rubber due to lower global prices and unfavourable rainfall for tapping activities. Amongst the services sector, transport & communication and hotels & restaurant sectors grew by 9.5 per cent and 18.6 per cent respectively. SriLanka S GDPGrowth ri Lanka's GDP in the first quarter (January-March) of the current year grew at 6.0 per cent as compared to 8.0 per cent in the same quarter of the last year. The subdued performance was underpinned by a GLOBAL TRENDS 8ECONOMY MATTERS (y-o-y%) 1Q:2011 1Q:2012 1Q:2013 Agriculture -4.4 12.0 2.0 Industry 11.1 10.8 10.7 Services 9.5 5.8 4.3 OverallGDP 8.0 8.0 6.0 Source: Department of Census & Statistics, Government of Sri Lanka Yearly GDP growth rate in Sri Lanka (January-December)
  • 11. the same period last year. Looking ahead, inflation is expected to remain in single-digit during the remainder of 2013, and in mid-single digits in 2014. Considering the subdued inflationary pressures prevalent in the economy currently, the Monetary Board in its meeting, th heldon15 August2013,wasoftheviewthatthecurrent monetary policy stance is appropriate, and therefore, decided to maintain the Repurchase rate and the Reverse Repurchase rate of the Central Bank of Sri Lanka unchanged at 7.00 per cent and 9.00 per cent, respectively. Inflation The prudent demand management policies along with favourable supply conditions have resulted in a continued low inflation environment in Sri Lanka. Inflationhasremainedat singledigitlevels for4 and half years with headline inflation (year-on-year), as measured by the Colombo consumers' price index (base: 2006/07=100) CCPI for first seven months of 2013 standing at 7.5 per cent as compared to 6.7 per cent in 3.8 6.3 12 10 8 6 4 2 0 Jan-12 Mar-12 May-12 Jul-12 Sep-12 Nov-12 Jan-13 Mar-13 May-13 Jul-13 CPI Inflation in Sri Lanka (y-o-y %) Source: Department of Census & Statistics, Government of Sri Lanka On the exchange rate front, following the general trend of depreciation against the US dollar of the other major currencies in the region, the Sri Lankan Rupee too fell to a near 10-month low in August 2013 due to dollar demand by importers and capital outflows. The rupee has fallen around 4 per cent since June 7, 2013 as foreign investors pulled out of Sri Lankan bonds and other emerging market assets due to a rise in U.S. treasury yields. Trade Intheexternalsector,merchandiseexportsinJune2013 showed some turnaround, recording a positive year-on- year growth after the decline observed in the past 15 months. The cumulative performance in merchandise trade depicts a salutary 7.1 per cent decline in the trade deficit for the first six months of 2013. Earnings from tourism and workers' remittances have continued to improve, while the financial inflows have been substantialinthefirsthalfoftheyear. key factor behind this was slower growth in agriculture, which according to these provisional numbers has slowed from 3.1 per cent in 2011-12 to 2.2 per cent in 2012- 13. This was largely due to the base effect of two consecutive years of record growth, lower output due to the falling price of paddy/rice and also due to weather-related disruptions. Yet, the industrial growth, which is the sector most affected by access to timely credit,isestimatedat9.0percentin2012-13,higherthan the 8.9 per cent in 2011-12, driven in large part by faster growth of construction and small scale industries. On Bangladesh GDPGrowth In 2012-13 (July-June), Bangladesh economy was faced with the challenges of rising inflation and balance of payments pressures stemming largely from a sudden surgeinoilimports. Accordingly,theGDPfortheannual year came in lower at 6.0 per cent as compared to 6.2 per cent in the previous fiscal. Growth was also lower than the previous five-year average of 6.2 per cent. A 9 AUGUST-SEPTEMBER 2013
  • 12. fiscal, Bangladesh Bank (Central Bank of Bangladesh) forecasts that the output growth is unlikely to deviate significantly from the last ten year average of 6.2 per cent. the other hand, growth of services sector marginally slowed down to 5.7 per cent in 2012-13 from 5.9 per cent in 2011-12 as the retail and wholesale trade sectors were particularly affected. Looking ahead to the current (y-o-y%) 2010-11 2011-12 2012-13(P) Agriculture 5.1 3.1 2.2 Industry 8.2 8.9 9.0 Services 6.2 6.0 5.7 OverallGDP 6.7 6.2 6.0 Source: Bangladesh Bank Note: P- Provisional GDP Growth Rate in Bangladesh in Fiscal Year (July-June) using the 1995-96 base. The risks to the inflation target stem partly from likely wage increases, in both the public and private sectors, which will further add to existing aggregate demand pressures. Consequently, the expected monetary stance of the Central Bank of Bangladesh for the second-half of the current fiscal (July-December 2013) states maintaining the repo rates and reserve requirement ratios unchanged following the 50 bps rate cut in January 2013, in addition to bringing down average inflation to 7 per cent (using the 1995-96base). Inflation Average inflation, using the 1995-96 base year, has been declining steadily over the past fifteen months, from a peak of 10.9 per cent in February 2012 to 7.7 per cent in June 2013. This decline was driven by a steady fall in point-to-point food and non-food inflation until October 2012 when food inflation bottomed out at 5.6 per cent. Since then, food inflation has begun to rise and in June 2013 came in at 8.5 per cent. For the current fiscal, the inflation target announced in the Budget is 7.0 per cent, 10.6 7.7 11 10 9 8 7 Jun-12 Jul-12 Aug-12 Sep-12 Oct-12 Nov-12 Dec-12 Jan-13 Feb-13 Mar-13 Apr-13 May-13 Jun-13 CPI Inflation in Bangladesh (y-o-y%) Source: Bangladesh Bank 2012-13, partly reflecting the significant fall in food import demand, lower petroleum imports as well as slower demand for imports related to manufacturing output. The capital account shows that foreign direct investment is projected to have increased from US$1.2 billion in 2011-12 to US$1.3 billion in 2012-13. Remittances remain an important source of foreign capital for the Trade In the external sector, the current account balance (CAB) continued to be in surplus of US$2004 million in 2012-13,onthebackofincreasinginflowsofremittances, continued buoyant export expansion, and declining imports. Import growth continued to remain sluggish in 10ECONOMY MATTERS
  • 13. appreciated 2.6 per cent between January 1st-June 30th 2013 and real exchange rate data indicates a marginal impact on export competitiveness. However, Central Bank's interventions in the foreign exchange market have limited this loss significantly by slowing the appreciationoftheTaka. country. Remittances have been buoyed by larger numbersofBangladeshiworkersmovingabroadin2011- 12 as well as real wage growth in the Middle East followingthe'ArabSpring'events. The Central Bank has been also working to rein in the excessive volatility in the exchange rate. The Taka (US$million) 2010-11(Actual) 2011-12(P) 2012-13(Estimation) CurrentAccountBalance -1549 151 2004 CapitalAccount 642 469 535 FinancialAccount 514 785 2347 OverallBalance -656 494 4886 Source: Bangladesh Bank Note: P- Provisional Bangladesh's Balance of Payments growth rate for the past five years has remained as low as 3 per cent, which is alarming when compared to the 2.1percentgrowthinthepopulation.Performanceofall the three sub-sectors, viz, agriculture, industry and services remained subdued during the year. For the current fiscal, government is targeting 4.4 per cent GDP growth. Though the new government that came in May 2013 is expected to provide some clarity on the political front, power shortages and security conditions continuetobestrongimpedimentstogrowth. Pakistan GDPGrowth Embroiled in an acute energy crisis since the last many years, Pakistan economy continues to face challenges on all fronts. The data for the GDP in Pakistan, which is releasedonanannualbasis,showsthatfor2012-13(July- June),theGDPgrewbymerely3.6percentascompared to the annual plan target of 4.3 per cent. The average 2012-13 2011-12 Growth(y-o-y%) Shares(%) Contribution(%) Growth(y-o-y%) Agriculture 3.3 21.4 0.7 3.5 Industry 3.5 20.9 0.7 2.7 Services 3.7 57.7 2.1 5.3 OverallGDP 3.6 100 3.6 4.4 Source: State Bank of Pakistan GDP Growth in Pakistan (July-June) impactofthedepreciationofthePakistaniRupee.Inthe latest budget the government has announced an increase of 1 percentage point in the General Sales Tax (GST),from16percentto17percent,andchangesinthe tax structurefor some goods & services. In addition, the government is considering a phase-wise upward adjustment in electricity tariff. Therefore, there is a risk Inflation Inflation continues to remain high, with July 2013 CPI inflation reading coming at a 10-month high of 8.3 per cent as compared to 9.6 per cent in the same month of last year mainly due to rise in food prices and adverse 11 AUGUST-SEPTEMBER 2013
  • 14. economy, the State Bank of Pakistan (SBP) chose to cut its policy rate by 50 bps, to 9 per cent in its policy review held on June 24th, 2013, thus giving more weight to the declininggrowthprospects. that average inflation for the current fiscal could exceed the announced target of 8 per cent for the year. Notwithstanding, the rising inflationary pressures in the FiscalDeficit Another significant challenge facing the economy is the rising fiscal deficit. The centre fiscal deficit for 2012-13 is estimated to be 8.8 per cent (of GDP), which is nearly twicetheinitialtargetof 4.7 per cent. The source of deviation is structural and well known - low tax revenues due to absence of meaningful tax reforms and continuation of untargeted subsidies without comprehensively addressing the energy sector problems. The high inefficiency of the public sector enterprises (PSEs) is worth highlighting in this context. For the current year, the federal government has announcedaprovisionalfiscaldeficitestimateof6.3per cent. 12.3 8.3 14 12 10 8 6 4 May-12 Jun-12 Jul-12 Aug-12 Sep-12 Oct-12 Nov-12 Dec-12 Jan-13 Feb-13 Mar-13 Apr-13 May-13 Jun-13 Jul-13 CPI Inflation in Pakistan (y-o-y%) Source: State Bank of Pakistan 12ECONOMY MATTERS 1980s 1990s 2000s FY11 FY12 FY13 E 7.0 6.8 4.7 6.6 8.5 8.8 Fiscal Deficit (as a % of GDP) in Pakistan Source: State Bank of Pakistan Note: E- Estimated Trade On the external front, the exports from Pakistan during 2012-13 stood at US$24.5 billion, marginally higher than US$23.6 billion recorded in 2011-12. Energy shortages and slow economic growth in developed world economieswerethemajorreasonsbehindtherelatively slow expansion in exports. Almost all the exports earnings originated from textile manufactures, as the country's exports are concentrated in a few items like cotton & cotton manufactures, leather, rice and few others. Imports in to the country were recorded at US$44.9 billion during 2012-13. The trade deficit, hence, during 2012-13 amounted to US$20.4 billion as against the US$21.3 billion deficit recorded during the same periodoflastyear. On the exchange rate front, the Pakistani Rupee continues to be battered against the US$. The Rupee droppedtoafreshall-timelowof103.47perUSdollaron August 21, 2013, a depreciation of over 9 per cent on an annual basis. The widening current account deficit,
  • 15. slipped to 1.6 per cent in 2012-13 as compared to 3.0 per cent in the previous year. The services sector in 2012-13, however, expanded by 6.0 per cent, much higher than 4.5 per cent last year. Nepal's economy has been embroiled in a major political crisis, with the elections now being postponed to November 2013. The country has been without a parliament for more than a year now, after major political parties missed yet another deadline to write a constitution and reach a consensus on the structure of the government. The political paralysis has deeply affected the economy. The strong factor for Nepal's economy has been the remittances sent by its residents staying outside; which constitutes roughly 22 per cent of the country's gross domestic product. Nepal GDPGrowth According to the preliminary estimates of the Central Bureau of Statistics (CBS), the Real GDP is estimated to have grown by 3.6 per cent in 2012-13 compared, lower than 4.5 per cent in the previous year. The deceleration in growthwas underpinnedby subdued performanceby theagricultureandindustrialsector.Agriculturegrewby a tepid 1.3 per cent mainly due to unfavourable monsoonswhichledtodecreaseintheproduceofmajor crops. Due to various structural bottlenecks, including energy shortage, industrial labour relation and delay in adopting a full-fledged budget, industrial growth (y-o-y%) 2011-12 2012-13(P) Agriculture 4.9 1.2 Industry 3.0 1.6 Services 4.5 6.0 OverallGDP 4.5 3.6 Source: Nepal Rastra Bank Note: P- Provisional GDP Growth in Nepal (fiscal year starting mid-July) Inconclusion,fromtheanalysisofthemajorSouthAsian economies, it emerges that they too are facing headwinds emanating from the tough global macroeconomic scenario. Out of the four major economies of South Asia, Pakistan appears to be in the most precarious state, troubled by deteriorating law and order, energy deficiencies, high inflation and fiscal deficit, and dip in the external aid. The currencies of all the four economies have witnessed sharp depreciation in the last few months, in line with the evolving global developments. Going forward, the growth outlook in these economies will be contingent upon the pace of recovery of the advanced economies and their internal domesticresilience. Inflation Annual average inflation based on consumer price index wasestimatedat9.9percentin2012-13,comparedto8.3 per cent in the previous year. Additional pressure on inflation has emerged as a result of a number of factors such as decline in food production due to unfavorable weather, weak supply situation, energy crisis, devaluation of Nepalese currency, increase in the price of petroleum products and Indian inflation. The monetary policy formulated by the Central Bank of Nepal for the current fiscal, adopted an accommodative policy stance to facilitate higher economic growth of 5.5 per cent during the year by making adequate provisions ofcreditalongwithcontaininginflationat8percent. excessive government borrowing from State Bank, absenceofforeigninflows,increasingoilimports,lackof foreign investment and repayments to the International Monetary Fund are the prominent reasons behind the constantdepreciationofPakistaniRupee. 13 AUGUST-SEPTEMBER 2013
  • 16. 14ECONOMY MATTERS OtherMajorGlobalDevelopmentsduringtheMonth 1. US GDP in the second quarter of 2013 was revised upwards to 2.5 per cent on an annualised basis as compared to initially estimated 1.7 per cent. Expansion in the second quarter - faster than the annualized growth rate in the first quarter of 1.1 per cent - was driven by gains in consumer spending, exports, private inventory investment,non-residentialfixedinvestmentandresidentialfixedinvestment. 2. In US, non-farm payrolls (NFP) increased by 169K in August 2013, lower than market expectations of an increase of 180K. Meanwhile, total job addition for July was revised lower from 162K to 104K, while that for Junewasrevisedfrom188Kto172K. 3. Real GDP in Euro Area posted a growth of 0.3 per cent on q-o-q basis in the second quarter of 2013, marking its first expansion since third quarter of 2011. In y-o-y terms though, GDP contracted 0.5 per cent, slower than a contractionof1.0percentinthepreviousquarter. 4. Real GDP in UK posted a growth of 0.7 per cent on q-o-q basis - revised up from previously estimated 0.6 per cent - in second quarter of 2013, as against a growth of 0.3 per cent in the previous quarter. In y-o-y terms also, GDPincreased1.5percentlastquarter,markingthehighestgrowthsincefirstquarterof2011. 5. Headline inflation softened in UK for the second consecutive month to 2.7 per cent in August 2013, as against 2.8 per cent in the previous month. Core inflation, on the other hand, was unchanged at 2.0 per cent last month.The deceleration in inflation was primarily due to lower contribution by 'transport' and 'clothing & footwear'sectors,whilearisein'furniture&householdservices'partiallyoffsetthedeceleration. 6. The Bank of England (BoE) kept its policy rate unchanged at 0.5 per cent and the quantum of Asset Purchase th Facility(APF)wasalsoretainedatGBP375billioninitsmonetarypolicymeetingheldon5 September2013. 7. Government's Purchasing Managers Index (PMI) in China increased to 51.0 in August 2013, up by 0.7 percentagepointmonth-on-month,andpositionedabovethethresholdfor11consecutivemonths.
  • 17. DOMESTIC TRENDS GDP Slows Down to 4-Year Low unexpected, as the monthly index of industrial production (IIP) numbers had pre-empted this weakness by posting a contraction to the tune of 1.1 per centinthefirstquarter. Thefullyeargrowthinthelastfiscalwasatadecadelow of 5 per cent. At the beginning of this fiscal it seemed as though the economy had bottomed out and that there would be some recovery during the course of this year. However, the first quarter print has effectively dashed any such hopes and it does not seem as though the growthcycle hasseen the troughyet as the next quarter islikelytobeonaweakerfootingtoo. GDP growth dropped to a four-year low of 4.4 per cent in the first quarter of the current fiscal as compared to 4.8 per cent in the quarter before. This is the lowest quarterly growth rate since March 2009, when the global financial crisis was at its peak. The downslide was driven by a weak industrial performance, which slipped to multi-year lows. This was however not 5.4 5.2 4.7 4.8 4.4 1QFY13 2QFY13 3QFY13 4QFY13 1QFY14 Growth in GDP at Factor cost (y-o-y%) Source: CSO 15 AUGUST-SEPTEMBER 2013
  • 18. 16ECONOMY MATTERS lows in March 2009. This is particularly worrying as it is a proxy of consumption expenditure and contributes more than 25 per cent to overall GDP. In contrast, community, social & personal spending which is regarded as a proxy for government spending grew at its highest pace since the September 2009 quarter. However, it might be difficult to sustain this high government spending as slowing growth is having an adverse impact on tax revenues and the depreciating rupee is raising the subsidy burden of the government. In the first quarter alone, the actual fiscal deficit was almost half of the budgeted deficit for the entire fiscal year. For the remaining quarters, it looks increasingly likely that the government will have to cut back expenditure sharply from budgeted levels to maintain itsfiscaldeficittarget(4.8percentofGDP). The area under cotton, another important kharif crop, has surged by 7.3 per cent to 108.5 lakh heactares (lh), and this bodes well for the textile industry. In 2012-13, domesticcottonoutputhaddeclinedfourpercentto34 million bales owing to a drought in the main cotton producing states of Gujarat and Maharashtra. This had also impacted cotton exports last year. Further, the coverage of coarse cereals went up by 20.1 per cent to 163.1 lh. This has positive implications for the domestic poultryindustry. Kharif crop output touched an all-time high of 131.3 million tonnes in 2011-12. But kharif production had fallen in 2012-13 because of the drought in Karnataka, Maharashtra, Gujarat and Rajasthan. Timely sowing this year will ensure crops get adequate time to mature. The higher kharif output this year is expected to cool food inflationaswell. From the supply-side, agriculture growth came in at a one-year high of 2.7 per cent in the first-quarter of the current fiscal as compared to 1.4 per cent in the previous quarter. The performance of the sector is expected to improve further in the coming quarters aided by a good monsoon this fiscal and expectation of record-high food grain production this year. In fact agriculture sector's performanceisexpectedtobekeycontributortooverall growth this year. In contrast, industrial sector growth slumped to a low of 0.2 per cent, the lowest point second only to contraction in March 2009. Amongst its sub-sectors, manufacturing sector contracted by 1.2 per cent, while mining & quarrying continued to remain in theredterritoryinthereportingquarter. Any meaningful revival cannot afford to by-pass the crucial manufacturing sector, given its importance in employment creation; hence bold steps by the policymakers to revive the sector's fortunes are the need of the hour. Growth in the labour intensive sector of construction was a mere 2.8 per cent in the June quarter. Second quarter is usually a seasonally weak quarter for construction and the trend is likely to continue. The sector is possibly reflecting the sharp cut in government's plan expenditure towards the end of last year and the near halting of private investment projects. Services sector grew at the same clip as last fiscal, at 6.6 per cent and has been almost flat for 3 consecutive quarters now. However, the dynamics within the services component has changed significantly for the worse. The trade, hotels, transport and communication sector came in at a low of 3.9 per cent next only to its (y-o-y%) 2QFY13 Q3FY13 Q4FY13 Q1FY14 GDP at factor cost 4.4 Agriculture 2.7 Industry 0.2 Services 6.6 -2.8 -1.2 2.8 3.7 3.9 8.9 9.4 5.2 4.7 4.8 1.7 1.8 1.4 1.3 2.5 2.7 7.6 6.7 6.6 Mining & quarrying 1.7 -0.7 -3.1 Manufacturing 0.1 2.5 2.6 Construction 3.1 2.9 4.4 Electricity, gas & water supply 3.2 4.5 2.8 Trade, hotels, transport & communication 6.8 6.4 6.2 Financing, insurance, real estate & business services 8.3 7.8 9.1 Community, social & personal services 8.4 5.6 4.0 Source: CSO GDP Break-Up from Supply-Side
  • 19. providing the biggest boost to expenditure GDP was government spending, which came in at 10.5 per cent. But as mentioned earlier, this trend might not be sustained in the future. Exports and imports were fairly muted and clocked -1.2 per cent and 0.7 per cent respectively. It seems as though the government's export promotion measures will take some more time topanout. From the demand-side, the situation remains weak and GDP notched 2.4 per cent in the April-June 2013 quarter as compared to 3.0 per cent in the previous quarter. The primary source of concern was the sharp slowdown in consumption growth, which came in at a dismal 1.6 per cent, which is the lowest print on record for this GDP series. In corroboration of the fact that the investment cycle in the economy is faltering, gross fixed capital formation contracted by 1.2 per cent. The component Source: CSO GDP Break-Up from Demand-Side Outlook CII is disappointed with the dismal performance of the first quarter GDP data which showed further deceleration in the economic growth. In particular, the near stagnation in the manufacturing sector is worrying at a time when policy makers are keen to raise the share of this sector in the economy. In view of the downside risks to growth, we havenowrevisedourGDPgrowthforecastdownwardtoarangeof5.3-5.8percentforthecurrentfiscal.Inorderto lift the economy out of the current quagmire, that all policy levers should be used to drive a revival in the economy. Project clearances should be hastened, implementation of the manufacturing policy should begin by identifying specificzoneswhereindustrycaninvestandinterestratesshouldbereduced. improvementinIIPgrowthwasnotentirelyunexpected as core sector (which constitutes close to 38 per cent of the total index) had grown at 3.1 per cent during the month.The positivesequential momentumwas evident from the 3.8 per cent growth in the seasonally-adjusted month-on-month (SA m-o-m) series in July 2013. However, on a cumulative basis, for the first four monthsofthefiscal,IIPcontractedby0.2percent. In an encouraging sign, index of industrial production grew by 2.6 per cent in July 2013 after remaining in negative territory for two consecutive months. The turnaround was mainly driven by a positive trend in the manufacturing growth rate. The print for June has also been revised upward to -1.8 per cent from -2.2 per cent earlier. However, it should be noted that the Industrial Growth Picks Up in July 2013 Jul-12 Sep-12 Nov-12 Jan-13 Mar-13 May-13 Jul-13 -0.1 2.6 10 5 0 -5 y-o-y% SA m-o-m% IIP Growth Rebounds in July 2013 Source: CSO (y-o-y%) 2QFY13 Q3FY13 Q4FY13 Q1FY14 GDP at market prices 2.4 1.6 10.5 -1.2 -1.2 0.7 2.5 4.1 3.0 Private Consumption 3.5 4.2 3.8 Govt. Consumption 6.9 2.2 0.6 Fixed Investment 1.1 4.5 3.4 Exports 5.0 -3.5 -0.6 Imports 9.5 4.2 3.3 17 AUGUST-SEPTEMBER 2013
  • 20. 18ECONOMY MATTERS the previous month. The sector recorded positive growth after remaining in the negative territory for threeconsecutivemonths.Consumergoodscontinueto remain in negative territory for the third consecutive month, primarily on account of consumer durables. Overall consumer goods sector showed de-growth to the tune of 0.9 per cent in July 2013 as compared to -1.9 per cent in the previous month. The continued poor performance by consumer durables in the last eight months, wherein it remained in the negative territory, is amatterofconcernasitiswidelyregardedasaproxyfor consumption growth. Non-durables on the other hand continued to show a robust performance, growing by 6.8 per cent in July 2013 as compared to 5.7 per cent in thepreviousmonth. On the sectoral front, manufacturinggrew at a relatively robust 3 per cent, as compared to two previous consecutive months of negative growth. As per the industry classification, of the 22 industries, 11 showed positive growth, mainly led by electrical machinery, wearing apparel, luggage & footwear and tanning of leather products. In contrast, regulatory and environmental issues continued to plague the mining sector, as it contracted by 2.3 per cent in July 2013. Electricity sector, meanwhile, showed a strong rebound of 5.2 per cent after the surprise stagnant growth last month. Ontheusebasedfront,themostsignificantsurprisewas onthecapitalgoodsfront,whichgrewbyaconsiderable 15.6 per cent in July 2013 as compared to -5.8 per cent in Apr-July Weight July-12 May-13 Jun-13 July-13 FY13 FY14 General 1000.0 -0.1 -2.8 -1.8 -0.2 -0.2 Manufacturing 755.3 0.0 -3.6 -1.7 -0.6 -0.2 Mining 141.6 -3.5 -5.9 -4.3 -2.0 -4.0 Electricity 103.2 2.8 6.2 0.0 5.5 3.9 Use-Based Basic 456.8 1.0 -0.9 -1.5 2.7 0.2 Capital 88.3 -5.8 -2.6 -5.8 -16.8 1.8 Intermediates 156.9 0.1 1.0 1.3 0.6 1.8 Consumer Goods 298.1 0.7 -7.1 -1.9 3.1 -2.0 -Durables 84.6 0.8 -18.4 -10.4 6.1 -12.0 -Non durables 213.5 0.6 3.0 5.7 0.6 6.8 2.6 3.0 -2.3 5.2 1.7 15.6 2.4 -0.9 -9.3 6.8 Source: CSO Sectoral Growth (y-o-y, %) Outlook CII is happy to note the return of industrial growth to the positive terrain in July 2013, which marks a break from the pasttwomonthsofnegativegrowth.Thisiswelcome,thoughitistooearlytopresumethatarecoveryisunderway. However, manufacturing sector has been performing below its potential for quite some time now, hence well- thought-outshortandmediumtermactionplansareneededtoacceleratethegrowthmomentumofthesector.
  • 21. WPI Inflation Accelerates on Higher Food Prices High fruits & vegetable prices coupled with high inland- fish prices drove the primary food inflation sharply up to 18.2 per cent as compared to 11.9 per cent in the last month. Consequently, primary inflation increased to 11.7 per cent in the reporting month as compared to 9 per cent in the month before despite sharp deceleration in its non-food and mineral sub components. Fuel inflation on the other hand remained stable at 11.3 per cent in August 2013. Encouragingly, non-food manufacturing inflation, which is widely regarded as the proxy for demand-side pressures in the economy came down to 1.9 per cent from 2.4 per cent in the month before. Total manufacturing inflation too stood at 1.9 per cent during themonth. HeadlineWPI-basedinflationclimbedto6-monthhighof 6.1percentinAugust2013ascomparedto5.8percentin the previous month mainly on account of spiralling food prices. Total food inflation (primary + manufacturing) accelerated sharply to 12.4 per cent in August 2013 as compared to 9.5 per cent in the month before. The average inflation for the first five months of the fiscal stands at 5.3 per cent as compared to 7.6 per cent in the same period last year. The sequential momentum of seasonally-adjusted month-on-month series also showedpickup.CombinedCPIinflationforthemonthof August 2013 stood at 9.52 per cent as compared to 9.64 percentinthepreviousmonth. General 100.0 8.0 5.2 5.8 7.6 5.3 Primary 20.1 11.2 8.8 9.0 10.3 8.1 - Food 14.3 9.3 10.3 11.9 10.4 11.0 -Non-Food 4.3 14.1 7.7 5.5 8.8 5.3 -Minerals 1.5 18.1 1.3 -2.4 12.3 -4.1 Fuel 14.9 8.7 7.5 11.3 10.5 9.2 -Petrol 1.1 9.5 -6.9 1.2 10.5 -0.9 -High Speed 4.7 0.5 23.4 26.3 5.0 23.8 Diesel Manufacturing 65.0 6.4 2.9 2.8 5.6 2.9 -Food 10.0 9.3 6.4 5.0 6.9 5.4 -Non-food 55.0 5.8 2.2 2.4 5.4 2.4 April-Aug Weight Aug-12 Jun-13 July-13 Aug-13 FY13 FY14 6.1 11.7 18.2 1.1 -7.2 11.3 3.2 27.6 1.9 1.7 1.9 Source: Office of Economic Advisor Sectoral Components of Inflation Outlook While on the one hand, high food prices drove inflation higher during the month, non-food manufacturing (core) inflation subsided further. This has complicated the task of the Central Bank further as there is clear evidence of abatement of demand-side pressures, which makes the case for a rate cut to spur growth, but on the other hand, supply-side issues have driven total inflation higher. We would urge the RBI to cut rates as it is well known that monetarypolicyisnotaneffectivetoolforcurbinginflationcausedduetosupply-sidebottlenecks. 19 AUGUST-SEPTEMBER 2013
  • 22. 20ECONOMY MATTERS Trade Deficit Narrows on Sharp Spurt in Exports Growth Meanwhile, the cumulative value of exports for the period April-August FY2014 came in at US$124.4 billion, higher than US$119.7 billion recorded during same period last year. Imports contracted by 0.7 per cent in August 2013, lower than a decline of 6.2 per cent in July 2013, mirroring the continued subdued domestic demand in the economy, impact of imports getting costlierinthewakeofdepreciatingrupeeagainsttheUS dollar and the curtailed imports of non-productive items like gold. Imports also contracted in month-over-month terms, printing US$37.1 billion in August as against USD$38.1billioninJuly. Exports stabilised further in August 2013, as global demand improved. Imports declined reflecting the slow domestic demand scenario, thus resulting in narrowing of the monthly trade deficit. However, these may be early days still to pass any judgement on the sustainability of the exports momentum in the months tocome. In August 2013, exports were valued at US$26.1 billion, up a robust 13 per cent as compared with same period last year. This is the highest monthly increase this fiscal and augurs well for the future economic prospects. 11.8 13.0 28.8 -0.7 40 30 20 10 0 -10 -20 Jan/12 Feb/12 Mar/12 Apr/12 May/12 Jun/12 Jul/12 Aug/12 Sep/12 Oct/12 Nov/12 Dec/12 Jan/13 Feb/13 Mar/13 Apr/13 May/13 Jun/13 Jul/13 Aug/13 y-o-y% Exports Imports Source: Ministry of Commerce External Sector Performance Oil imports were higher by 17.9 per cent on a y-o-y basis. Non-oil imports declined by 10.4 per cent-standing at US$21.9billionduringthemonth. As exports rose and imports fell during the month, the tradedeficitnarrowedtoUS$10.9billionfromadeficitof US$12.3 billion in July. On a cumulative basis, trade deficit came in at US$73.4 billion in April-August FY14, slightly lower than a deficit of US$74.7 billion during the sameperiodinFY13. Within imports, oil and related products accounted for US$15.1 billion worth of imports in August 2013 as compared to US$12.7 billion in the previous month. The higher oil import bill is attributable to the high international oil prices during the month due the ongoing geopolitical tensions in Syria. The Indian crude oil basket price rose to US$110.1/bbl in late August as comparedtoUS$105/bblinJulyandUS$101.0/bblinJune. Outlook Going ahead, exports are likely to find some support amidst signs of economic recovery in both the US and the Euro zone. Besides, a weaker Rupee is also likely to aid exports. However, on the negative side, elevated crude oil prices poseriskstotheoilimportbill.
  • 23. v v v v v v Services projected to grow at 6.6 per cent in 2013-14 asagainst7.1percentin2012-13. WPI inflation by end March 2014 will be around 5.5 percentasagainsttheaverageof7.4percentin2012- 13and5.7percentatendMarch2013. Current Account Deficit projected at US$70 billion (3.8 per cent of GDP) in 2013-14 against an estimated US$88.2billion(4.8percentofGDP)in2012-13. NetCapitalflowsprojectedatUS$61.4billion(3.4per cent of GDP) in the current year against an estimated US$89.4 billion in the last fiscal, the second highest leveltodate. Investment and Savings rate projected at 34.7 per centand31percentofGDPrespectivelyin2013-14. Some of the measures suggested by the council to improve economic conditions in the medium to long term include improving manufacturing capabilities, lowering current account deficit and encouraging foreigninvestmentamongstothermeasures. Initsrevisedeconomicforecastforthecurrentfiscal,PM Economic Advisory Council (PMEAC) lowered its GDP forecast from 6.4 per cent to 5.3 per cent. Though growth has been revised downwards, it is still higher than the 5 per cent growth posted last year. As per the council, the main reasons for the higher forecast in the current year is the sharp increase in agriculture output coupled with expected pick-up in growth of other sectors also in the second half of the year owing to slew of policy measures announced in the last couple of months. Following are the key highlights from the council'sotherforecasts: Agriculture projected to grow at 4.8 per cent in 2013- 14 as against 1.9 per cent in 2012-13 owing to a good monsoon which had a huge positive impact on sowingactivity. Industry projected to grow at 2.7 per cent in 2013-14 as against 2.1 per cent in 2012-13. Manufacturing sectorprojectedtogrowat1.5percentinthecurrent fiscalasagainst1percentinthelastfiscal. v v PMEAC Cuts GDP Forecast to 5.3 per cent Dr. Raghuram Rajan Takes Over as the New RBI Governor view that it is mainly the supply constraints that have unleashed the forces of inflation, especially in food. As the governor has appropriately emphasized on a policy that will promote inclusive growth and development, it is even more critical to address the supply bottlenecks throughawellcoordinatedmonetaryandfiscalpolicy. With a view to encourage investors to take positions domestically and provide depth and profits to our economy, CII welcomes the intention of the new RBI governor to steadily liberalize the domestic market, and ease the restrictions on investment and positions taking. This will also help the country by way of boosting confidenceofforeigninvestorsintheIndianeconomy. CII is also happy that the new governor will be taking several steps to help the households, who remain vulnerable to the vagaries of the market. Among these important measures, the decision of RBI to issue Inflation Indexed Savings Certificates linked to the CPI New Index to retail investors by end-November 2013, is welcomeandisinlinewith CIIrecommendations. CII welcomes the new governor and is confident that he will take the necessary pro-reform measures in the months to come in order to re-invigorate growth in the economyandkeeptheinflationaryexpectationslow. Dr. Raghuram Rajan assumed charge as rd the 23 Governor of the Reserve Bank of India on September 4, 2013. Prior to this, he was the Chief Economic Advisor, Ministry of Finance, Government of India and the Eric J. Gleacher Distinguished Service Professor of Finance at the UniversityofChicago'sBoothSchool.Between2003and 2006, Dr. Rajan was the Chief Economist and Director of Research at the International Monetary Fund. The new governor takes over at a very critical stage for the economy which saw Rupee touching historic lows in addition to the perceived fiscal dominance over monetary policy in recent times. Covering these critical areas in his maiden speech, Dr. Rajan, expressed confidence that monetary policy, in coordination with fiscal policy, will not only be able to address the macro economic issues facing the country currently but will also provide platform for sustaining the high growth withinclusivenessinmediumtolongterm. Dr. Rajan rightly recognized the need for taming inflationary expectations by taking measures based on the understanding of the dynamics of originating sources like the value of currency, supply-side constraints and demand pressures. CII has been of the 21 AUGUST-SEPTEMBER 2013
  • 24. 22ECONOMY MATTERS Draft Safe Harbour Rules – Do They Bridge or Widen the Taxpayer-Exchequer Divide? The Safe Harbour rules (the rules) were released in draft form by the Central Board of Direct Taxes (the CBDT) on 14 August 2013. After considering comments from various stakeholders, the final rules have been issued on 18 September 2013. The rules cover the following categories/sectors of transactions and prescribe the belowmentionedsafeharbourmargins/prices: Software development and IT-enabled services - Cost plus mark-up of 20 per cent (provided the value of such transactions does not exceed INR 500 crores i.e. INR 5 billion); cost plus mark-up of 22 per cent mark in other cases, i.e. above INR 500 crores; the draft rules had proposed a threshold limit of INR 100 crores, i e taxpayers having transactions above INR 100 crores werenoteligiblefortheSafeHarbour Knowledge Processes Outsourcing (KPO services) - Cost plus mark-up of 25 per cent; in the draft rules the same was proposed as 30 per cent with an upper limit eligibilitythresholdofINR100crores. Contract Research & Development (R&D) relating to software development and generic pharmaceutical drugs - Cost plus mark-up of 30 per cent and 29 per cent respectively; same as the margins proposed in the draft rules Transfer Pricing (TP) has emerged as one of the key focal points of high-pitched tax litigation in India. While outsourcing/captive units have experienced significantTP adjustmentsto theirprofitmargins,Indian parent companies have suffered adjustments on their intra-groupfinancingarrangements. The Finance (No. 2) Act, 2009 had introduced Safe Harbour Provisions in order to reduce the uncertainty faced by the taxpayers in India. The provisions were also intended to provide clarity and guidance on the quantity of taxable profits that should be earned in India as per the arm's length principle. Safe Harbour is a mechanism under which the tax authorities accept the transfer prices declared by taxpayers without undertaking detailed audit, in certain circumstances. Safe harbour provisions generally intend to confer benefits like compliancerelief,administrativesimplicityandcertainty on the taxpayers and tax administrators. While this helps the tax payers in reducing compliance cost, tax authorities can focus their limited resources on bigger andmorecomplextransactions. T A X E S TAXATION
  • 25. The rules have prescribed different margins for services viz., software development, ITeS, KPO, contract R&D, etc. A noteworthy aspect is that service providers bearing insignificant risk are only eligible to opt for the rules. The factors mentioned for identification of taxpayers with 'insignificant risk', inter-alia, includes performance of economically significant functions, provisionsoffunds/capitalandownershipofintangibles by foreign principal, etc. Hence, distinction in mark-up percentage between various services, presumably on the basis of high-end vs. low-end nature of activities, could lead to enhancing disputes on characterisation of taxpayers. The mark-up percentages prescribed in the rules may not meet the taxpayers' expectations (based on industry average margin trends and prevalent commercial rates) and opting for the prescribed margins under the rules may overshadow the expected benefits. Similarly, the safe harbour interest rate for loans would range from 11 per cent to 13 per cent (applying the SBI base rate as on 30 June 2013), which clearly is on a higher side. Also, the margin provided for auto components industry, which in particular has been going through a challenging phase, appears high. Since several rulings of the Income tax Appellate Tribunals have accepted lower percentage of mark-up or interest tobe atarm'slength,theratesspecified intherulesmay notfindfavourwiththetaxpayers. Whilst the step by the CBDT is a positive move, it is expected that the revenue authorities during audits, APA/MAP negotiations will not consider the safe harbor margins. An issuance of a binding circular clarifying that safe harbour rates should be strictly applied only to taxpayers who opt for the rules and should not be generically extended to other assessees (who do not opt for the rules) would provide a sense of relief to taxpayers.Thereisnodoubtthatthereleaseofthelong- awaitedSafeHarbourrulesisastepintherightdirection and the certainty and administrative convenience offered by the rules would be an additional incentive that will increase the attractiveness of India as an investmentjurisdiction. Manufacture and export of core and non-core auto components - Cost plus mark-up of 12 per cent and 8.5 percentrespectively;sameasthedraftrules Interest on loans sourced in Indian Rupees extended to Wholly-Owned non-resident subsidiaries (WOS) - State Bank of India (SBI) base rate plus 150 basis points for loans up to INR 50 crores and, SBI base rate plus 300 basis points for loans exceeding INR 50 crores i.e. INR 0.5billion. Guarantee fee on explicit corporate guarantees on behalf of WOS - 2 per cent per annum where the amount guaranteed does not exceed INR 100 crores i.e. INR 1 billion and 1.75 per cent in case the amount guaranteed exceeds INR 100 crores and the credit rating of the WOS is of adequate to highest safety as carried out by an agency registered with the Securities and Exchange BoardofIndia. The issuanceof detailed Safe Harbourrules is a welcome measure. The removal of upper threshold limits for eligibility of opting for safe harbour rules will give an opportunity to taxpayers at large to opt for the rules. As regards the period, application of the rules for five years (instead of 2 years as in the draft rules) is another positive development. It is expected that the rules would help overcome immense potential TP litigation andcreateanamicabletaxenvironment. However, the rules in final form also have certain issues aswereinthedraftrules.Therulesrequirethetaxpayers opting for Safe Harbour to comply with the detailed requirements relating to TP documentation. Such compulsion would defeat the key benefit of reduced compliance burden. Once a certain mark-up for a specified service is acceptable to the tax authorities, maintaining detailed documentation thereafter may, at bestbeofacademicimportance. The final rules only cover R&D for software developmentandgenericpharmaceuticaldrugs,leaving out other sectors such as R&D for active pharmaceutical ingredients, chemicals, agriculture, etc. Further, the rules only cover loans/guarantee provided by taxpayer to/for WOS and cover only rupee-sourced loans, thus, havingrestrictedapplicability. This articlehas beencontributedby Tarun Arora, Senior Director, Shuchi Ray, Director, DeloitteToucheTohmatsuIndia Pvt.Ltd. and Manmeet Vij, SeniorManager,DeloitteHaskins&Sells.ViewsexpressedinthearticlearethoseoftheauthorsandnotnecessarilyofCII. 23 AUGUST-SEPTEMBER 2013
  • 26. 24ECONOMY MATTERS CORPORATE PERFORMANCE Industry Under Pressure as Growth Dips Further The analysis factors in the financial performance during the first quarter of 2013-14 of a balanced panel of 1664 manufacturing companies (excluding oil and gas companies) and 1037 service firms extracted from the th AceEquitydatabaseason29 August2013. Growth in net sales on an aggregate basis stood at a measly 4.8 per cent at the end of first quarter of the current year, as compared to a healthy 12.2 per cent in the same quarter a year ago. The growth of net sales for manufacturing firms moderated sharply to 0.2 per cent during the quarter as compared to 12.7 per cent in the same quarter a year ago. Firms in the services sector, on the other hand, fared somewhat better, with their net sales growing at a much higher pace of 12.6 per cent as compared to 11.4 per cent during the comparable time- period of last year. The low net sales of firms are reflectiveofthelackofampledemandintheeconomy,a scenario that has been persistent for quite some time now. The deepening economic slowdown, rising interest rates, tight liquidity, declining investments and depreciating rupee are slowly taking a toll on India Inc's financial performance with majority of companies witnessing a decline in net profits for the past few quarters.Thecorporateresultsattheendoffirstquarter (April-June)of the currentfiscal painted a rathergloomy picture as the financial performance of Indian companies deteriorated. A scanty 4.4 per cent GDP growth in the reporting quarter worsened the cause, even as the RBI tightened its purse strings in a bid to stem the downfall in Rupee. While the growth in expenditure costs stood somewhat curbed, fading growth of net sales and contraction in PAT added to the prevalentgloom.
  • 27. the corresponding period of last year. Interestingly, growth in interest costs decelerated sharply to 10.0 per cent in the reporting quarter as against 29.0 per cent in the same quarter of 2012-13. In a reflection of slowing production, growth in raw materials cost contracted by 5.7 per cent in the reporting quarter as compared to a positivegrowthof10.5percentseeninthesamequarter oflastyear. Totalexpenditure,onanaggregatebasis,deceleratedto 3.5 per cent in the reporting quarter as against a growth of 16.5 per cent in the corresponding period of 2012-13. This came as a breather and fairly cushioned the severe impact of lower net sales growth during the quarter. Amongst the various components of total expenditure, the growth in wages & salaries stood at 14.7 per cent in thefirstquarterascomparedto15.1percentrecordedin GrowthinNetSales(y-o-y%) Aggregate Manufacturing Services FY13Q1 12.2 12.7 11.4 FY13Q2 9.9 8.8 11.8 FY13Q3 7.0 6.5 7.9 FY13Q4 4.5 2.1 9.1 FY14Q1 4.8 0.2 12.6 Source: Ace Equity database & CII calculations Growth in Net Sales (y-o-y%) Growth in Expenditure (y-o-y%) 10.5 -5.7 15.1 14.7 29.0 10.0 FY13Q1 FY13Q2 FY13Q3 FY13Q4 FY14Q1 FY13Q1 FY13Q2 FY13Q3 FY13Q4 FY14Q1 FY13Q1 FY13Q2 FY13Q3 FY13Q4 FY14Q1 Services & Raw Materials Wages & Salaries Interest Payments Source: Ace Equity database & CII calculations correspondingquarteroflastyear. On an aggregate basis, PAT declined by 5.9 per cent in the April-June 2013 quarter as compared to a growth of 3.2 per cent in the same quarter of last fiscal. Growth in operating profits (profits earned from a firm's core business operations excluding investments and the effects of depreciation, interest and taxes) on an aggregate basis saw moderation to 5.1 per cent in the April-June, 2013 quarter as compared to a growth 11.3 per cent in the first quarter of last year. PAT growth decelerated at a much faster rate than growth in operating profits due mainly to high interest rates prevailingintheeconomy. While moderation in growth of expenditure has to some extent mitigated the impact of the current bout of economic crisis characterized by falling growth in net sales, the reduction was not large enough to provide cushion to the bottom-line of the firms. Consequently, there was de-growth witnessed in profit-after-tax (PAT) on an aggregate basis in the first quarter of 2013-14. The sharpest contraction in PAT growth was seen in manufacturing sector firms, which saw its PAT declining by12.6percentinthefirstquarterofthecurrentfiscalas compared to a contraction of 14.5 per cent in the same quarter of last year. For the services sector, PAT growth moderated to 0.7 per cent in the reporting quarter as against a growth of 29.3 per cent seen in the 25 AUGUST-SEPTEMBER 2013
  • 28. 26ECONOMY MATTERS Growth in PAT (y-o-y%) Manufacturing Services Aggregate Manufacturing Services Aggregate FY13Q1 FY13Q2 FY13Q3 FY13Q4 FY14Q1 Growth in PBDIT (y-o-y%) Source: Ace Equity database & CII calculations FY13Q1 FY13Q2 FY13Q3 FY13Q4 FY14Q1 3.2 20.1 9.9 -5.9 40 20 0 -20 -12.6 11.3 13.3 6.0 0.1 5.1 and thus also on aggregate basis in the reporting quarter. The fall in margins mirrored the sharp decline in profitability that the firms have had to confront in the reportingquarter. Our analysis shows that both net margin (ratio of PAT and net sales) and gross margins (ratio of PBDIT and net sales) fell across manufacturing as well as service firms, Gross Margin Net Margin Source: Ace Equity database & CII calculations Manufacturing Services Aggregate 20.3 20.6 19.4 19.9 20.4 FY13Q1 FY13Q2 FY13Q3 FY13Q4 FY14Q1 Manufacturing Services Aggregate FY13Q1 FY13Q2 FY13Q3 FY13Q4 FY14Q1 8.4 9.1 7.9 8.1 7.6 some moderation in expenditure costs. Net sales and PAT growth, however, continue to remain a sore point, indicating that there is still a long way to go before revivalinaggregatedemandgainstraction. Overall,theanalysisoftheresultsobtainedsofarreveals that there seems be no news to cheer for the India Inc amidst this weak macroeconomic scenario, except for 30 15 0 -15 40 20 0 20 10 0
  • 29. Capital Goods Production Trend in Capital Goods Sector Analyzing the yearly performance of the capital goods segment, below table shows a sharp moderation in growthofthesectorsince2007-08(JulytoJune).Owing to the global financial crisis, the growth in capital goods sector plunged from 48 per cent in 2007-08 to 4 per cent in 2008-09. With the quick turnaround of the economy, growth prospects for the sector improved in the next two years. However, the sector went in for a sharp contraction in 2011-12 (-9 per cent) and 2012-13 (-2.2 per cent). The negative growth recorded by the sector over the last two years is a serious concern and its revival is crucial for the economy to resume its high growth trajectory. It is interesting to note that all sub-sectors of the capital goods segment have witnessed rapid deterioration in growth performance over the last two years. Machinery & equipment, which is an important indicator of the health of the other sectors of economy, has recorded contraction over two consecutive years. Given that it playsacrucialroleinupscalingthepaceoftheeconomy, directly and indirectly, every effort should be made to reversethedowntrendinthissector. Introduction apital goods sector is of strategic importance for the Indian economy. Being large and diverse in nature and playing a critical role in production process, the sector has high multiplier effect on the overall growth of the economy. The sector not only determines the pace of economic expansion but also gets influenced by the same. As the demand for the sector's output is derived from the demand for other sectors of the economy, its own performance provides an important clue to the future. By analyzing the recent trends in production and imports of lead components of capital goods sector, one can, therefore, explain the growthprospectsofrelatedsectorsoftheeconomyand alsocommentontheneedforpolicyintervention,ifany. While the performance of capital goods sector is generally considered as a barometer of the growth prospectsoftheeconomygoingforward,italsohelpsto assess the need for encouraging efficiency and production of the sector to encourage demand from its endusers. C SECTOR IN FOCUS 27 AUGUST-SEPTEMBER 2013
  • 30. 28ECONOMY MATTERS automobile sector in slow track. While efforts can be made to revive the automobile production by direct policy intervention, it would also be helpful to enhance the cost competitiveness of "other transport equipment" to attract additional demand from its end users. Similarly, sharp growth deterioration witnessed by 'other transport equipment' signifies the downtrend in theautomobilesector,anotherengineofgrowthforthe economy. Slowing income growth, rising fuel prices, uncertainty relating to growth recovery and high credit cost have been among the major factors keeping the Year Machinery & Office, accounting & Electrical machinery Radio, TV and Other Capital equipment n.e.c. computing machinery & apparatus n.e.c. communication transport Goods equipment & equipment (Aggregate) apparatus 2007-08 19.6 6.3 183.8 87.5 -0.7 48.1 2008-09 -8.4 -11.3 33.0 15.7 4.9 4.1 2009-10 25.0 5.2 -0.6 18.4 31.4 10.4 2010-11 20.3 9.3 11.2 7.4 22.0 15.0 2011-12 -1.9 -3.8 -30.3 10.5 9.0 -9.1 2012-13 -7.4 -17.2 20.3 -2.9 1.1 -2.2 Average 7.9 -1.9 36.2 22.8 11.3 11.1 Source: CSO Average Annual Growth in IIP of Capital Goods Sector (July to June, y-o-y%) manufacturing sector plotted against the corresponding IIP for capital goods since June 2007. Production growth in capital goods sector, which constitutes less than 9 per cent share in overall weights in IIP, has moved in tandem with the overall growth of manufacturing index. Being the derived nature of demand for capital goods, its growth trend, in general, has preceded that of manufactured goods. In below figure, it can be seen that production growth of capital goods sector assumed a sharp downward spiral during June 2007 to Nov 2009, and the growth in manufacturingsectorfollowedsuitwithatimelag.After this, the capital goods sector exhibited a vigorous recovery till June 2011, albeit with a large volatility, coinciding with high growth performance of the manufacturing sector. Capital goods sector since July 2011haslargelystayedinnegativezones,bringingtohalt theexpansioninmanufacturingoutput. Sharp moderation in growth of 'Radio, TV and Communication equipment & apparatus' over the last two years is again the result of economic slowdown led by fall in demand. The fate of the sector largely depends upon the measures that could help in revival of demand for durables. The negative growth of 'office, accounting & commuting machinery' sector over the last two years is indicative of slowing business activities, and could mirrordecliningjobprospectsaswell. Interrelationship between Capital GoodsandManufacturingSectors The production performance of capital goods sector is directly linked to the growth performance of the manufacturing sector. Close relationship between the two sectors of the economy is discernible from the monthly Index of Industrial Production (IIP) for
  • 31. especially true for the period of 2000s, when manufacturing sector recorded robust performance, supported by the elevated growth of capital imports. This is where there is a scope for domestic capital goods sectortofillthegap. Showing large dependence on imports of capital goods, the growth in manufacturing output has also moved closely with the growth in imports of capital goods (see below figure). Whenever there was high growth registered by the manufacturing sector, it was backed by large imports of capital goods and vice versa. This is Monthly Growth in Capital Goods and Manufacturing IIP since June 2007 70 56 42 28 14 0 -14 -28 Jun-07 Sep-07 Dec-07 Mar-08 Jun-08 Sep-08 Dec-08 Mar-09 Jun-09 Sep-09 Dec-09 Mar-10 Jun-10 Sep-10 Dec-10 Mar-11 Jun-11 Sep-11 Dec-11 Mar-12 Jun-12 Sep-12 Dec-12 Mar-13 Jun-13 Manufacturing Capital goods Source: CSO 50 40 30 20 10 0 -10 -20 -30 -40 1989-90 1990-91 1991-92 1992-93 1993-94 1994-95 1995-96 1996-97 1997-98 1998-99 1999-00 2000-01 2001-02 2002-03 2003-04 2004-05 2005-06 2006-07 2007-08 2008-09 2009-10 2010-11 2011-12 2012-13 Manf. Output Imports of Capital Goods Yearly Growth in Capital Goods Imports and Manufacturing Output since 1989-90 (%) Source: CSO billion in 2001 to US$79 billion in 2012. Even as the domestic production of capital goods sector has witnessed contraction in the last two years, imports of capital goods managed to maintain growth momentum and grew by an average of 12 per cent per year in the last twoyears.Relativelylowprotectionagainstimportsand growing pressure on the part of exporters to reduce prices in the wake of global slowdown could be among TrendinImportsofCapitalGoods In keeping with the pace of overall economic growth and lack of development of domestic capital goods sector, the imports of capital goods have witnessed sharpincreaseoverthelastdecadeorso,supportedbya relativelylowrateofcustomsdutyintherangeof0.0-7.5 percent.Theimportsjumpedupby10timesfromUS$7.9 29 AUGUST-SEPTEMBER 2013
  • 32. 30ECONOMY MATTERS value of rupee against US dollar plunges to record new lows on regular basis. Further, the import duty could be raised to the WTO base rate to regulate unnecessary importslikehasbeendoneforgold. the major reasons that allowed imports to maintain its momentum. In the wake of widening current account deficit,whenthegovernmentandRBIaremakingallout effortstocurbavoidableimports,hugeimportofcapital goods is causing a drain on foreign reserves, even as the these two items together constitute less than 22 per cent of total imports, overall expansion in imports of capital goods continue to remain healthy. Three largest sub-sectors of capital goods imports - electrical equipment, telecommunication equipments, and industrial equipments - constituting half of the total importsofcapitalgoodsin2012-sawimportsgrowingin double-digits, which could mean good prospects of growthinendusersofthesesectors. Interestingly, majority of the capital goods sub-sectors haveshownconsistentandhealthygrowthinimportsin recent years; even over the last two years when economic growth in the country moderated substantially (see below table). The only sectors exhibiting poor growth performance in imports since 2007 are Railway/Tramway equipment (-5.7 per cent), and industry special machine (3.8 per cent). Given that 7.9 10.3 14.7 19.8 28.2 40.8 47.9 64.6 58.1 63.8 76.7 79.0 2001 2002 2003 2004 2005 2006 2007 2008 2009 2010 2011 2012 Trend in Imports of Capital Goods (US$, billion) Source: UN Comtrade Year Power Industry Metal Industrial Office/data Telecom Electrical Road Railway/ Total generating special working equipment proc ms etc equipment vehicles tramway Capital equipment machine machinery machines equipment equipment Goods 2007 3.1 6.9 2.5 6.8 4.2 9.9 6.5 1.9 6.1 47.9 2008 4.0 8.3 3.5 9.2 4.5 7.3 7.6 3.2 17.2 64.6 2009 3.9 6.8 2.5 7.7 4.3 11.6 9.9 2.7 8.7 58.1 2010 4.9 7.1 2.8 9.5 5.3 13.6 9.4 4.0 7.2 63.8 2011 6.1 8.9 3.6 12.2 6.8 14.6 14.1 5.0 5.2 76.7 2012 6.0 8.5 4.0 12.2 7.6 13.5 13.7 5.0 8.6 79.0 Avg 14.8 3.8 7.8 12.1 13.4 11.5 17.2 20.6 -5.7 9.3 Annual Growth (%) Source: UN Comtrade Trend in Imports of Major Components of Capital Goods Sector (US$, billion)
  • 33. India's sources of capital goods imports are concentratedin just a few countries.This is evident from the fact that just the top ten sources contributed nearly 80 per cent of capital goods imports in 2012-13; of these, the top 5 countries - China, Germany, Japan, US, and Korea Rep. - accounted for 63 per cent of the total imports of capital goods. China is by far the largest exporterofcapitalgoodstoIndia. India is heavily dependent upon the imports of capital goods for meeting the domestic demand. This is evident from the fact that imports constituted 29 per cent of domestic demand for capital goods in 2010-11. Earth moving equipment, machine tools, metallurgical machinery and textiles machinery are sub-sectors that are particularly weak in self reliance with 48 to 87 per centdemandbeingmetbyimports. Electrical equipment 17.3% Telecomms etc equipment 17.1% Industrial equipment nes 15.4% Railway/tramway equipmnt 10.8% Industry special machine 10.8% Office/dat proc machines 9.6% Metalworking machinery 5.1% Road vehicles 6.3% Power generating equipmt 7.5% Sectoral Share of Capital Goods Imports (2012) Source: UN Comtrade China 31% Germany 9% Japan 8%United States 8% Korea, Rep. 7% Singapore 4% Italy 3% Malaysia 3% Thailand 3% France 3% Others 21% Composition of Imports of Capital Goods from Top-10 Countries (2012) Source: UN Comtrade 31 AUGUST-SEPTEMBER 2013
  • 34. 32ECONOMY MATTERS This raises a pertinent question: why should we not make attempts to cut imports of capital goods by encouraging its domestic production, which would not only help in saving foreign exchange but also create much needed value addition and employment within the economy. This is especially critical in the context of sharperodingvalueofrupeeagainsttheUSdollarwhich is going to impact the imports of capital goods adversely. In order to ensure the sector's progressive development and to drive it to the next level of growth, there are numbers of measures that need to be taken, asmentionedinthefollowingsection. Measures to Boost Domestic Capital GoodsSector o Leverage domestic demand - To leverage large domestic demand that exists in India, there is a need for developing significant collaboration between usersandproducersofcapitalgoodssector. o Harmonize tax, duty structures, and FTAs - Indian capital goods manufacturers are affected by current duty structure that has created an unequal playing field between domestically manufactured goods and imported goods. Further, in certain cases, Free Trade Agreements (FTAs) are also being exploited to the disadvantage of domestic capital goods manufacturers.ExportsfromcountriessuchasChina are routed through these FTA countries to secure greater advantage over local manufacturers. There is, therefore, a need harmonize tax and duty structureandensurethatFTAsdon'tinflictinjuriesto thedomesticcapitalgoodssector. o Addressing the issue of inverted duty structure - In the current duty structure for intermediate and finished goods, there are certain anomalies, which at times, make the domestic capital goods costlier. At the same time, import duty on finished goods turns out to be lower in many instances, thereby creating an advantage for imports over domestic production. Such cases exist in various capital goods segments, callingforurgentpolicyattention. o Restricting imports of second hand machinery - There is a need to curb the large imports of second hand machinery in several sectors in India, including machine tools and textile machinery. Policy needs to be shaped to limit import of second hand equipment toprovideimpetustolocalmanufacturing. o Bridging the technology gap and increasing the depth of capabilities of domestic capital goods manufacturers-Indiancapitalgoodssectorneedsto plan and invest in developing the "next generation" products in order to shorten the prevailing technology gap between domestic manufacturers andforeignplayers. Imports Domestic Split of Demand between Imports and Domestic Production (2010-11) th Source: Report of the Working Group on Capital Goods & Engineering Sector for the 12 Five Year Plan, October 2011 9% 24% 26% 31% 35% 48% 51% 71% 87% 29% 91% 76% 74% 69% 65% 52% 49% 29% 13% 71% Process plant equipment Engineering Goods Heavy Electrical Equipment Dies, Moulds and Tools Plastic Machinery Textile Machinery Earth Moving Equipment Machine Tools Metallurgical Machinery Overall O demand met by imports ver 50 per cent
  • 35. Conclusion The negative growth recorded by the capital goods sector over the last two years is a matter of concern. To blame the economic slowdown alone for the same would be incorrect as the imports of capital goods in the country have continued to remain buoyant. Poor performance, therefore, has much to do with the low cost competitiveness of the sector, which has magnified in the face of the economic slowdown. While revival of manufacturing growth is critical for capital goods sector, its healthy growth performance too can help the revival process. This is especially true in the backdrop of the sharp erosion in value of rupee against the US dollar, which is going to impact the importsofcapitalgoodsinthecountryadversely,besidesaddingtotheproblemofcurrentaccountdeficit. To make the domestic capital goods sector competitive, it is critical that we provide the right mix of fiscal incentives, infrastructure and skilled personnel and develop domestic capabilities across the value chain in the sector. Measures such as rationalizing the local tax structure, reducing the cost of credit, time bound fiscal incentives, putting check on avoidable imports of second hand machinery, addressing the issue of inverted duty structure, and facilitating skill development facilities for a competent workforce would go a long way in helping thesector. 33 AUGUST-SEPTEMBER 2013 Global Taxation Summit 2013 The topics to be deliberated at the Summit would broadly include: International & Domestic Tax Developments –Lessons and Learning for India Key Current and Emerging Transfer Pricing Audit Issues in India Alternate Dispute Resolution – Challenges & Way Forward BEPS – Emerging Trends in Developed and Emerging Markets Indirect Tax Issues including CENVAT, Service Tax and State VAT v v v v v Ms. Jessy Rajji Confederation of Indian Industry; 23 Institutional Area; Lodhi Road New Delhi 110 003. Tel : 91-11-24690715 /24629994 – 7; Fax : 91-11-24615693 Email : jessy.rajji@cii.in CII is organizing a day long Global Taxation th Summit 2013 on 20 November, 2013 at Hotel Taj Palace, New Delhi. Mr. Sumit Bose, Secretary - Revenue, Ministry of Finance, has kindly agreed to be the Chief Guest at the Summit. The Summit would also have the benefit of the views of senior government officers, tax experts from India and abroad and industry. You are invited to participate in the Summit. For registration and sponsorship opportunities, please contact:
  • 36. 34ECONOMY MATTERS SPECIAL ARTICLE Right to Fair Compensation and Transparency in Land Acquisition, Rehabilitation and Resettlement Bill, 2013 Over a period of time, land acquisition has emerged as a critical constraint in India's industrialization, given pressures on limited land-mass for multiple uses. In order to remove the impediments to land acquisition, itisessentialthatitmusttakeplaceinamannerthatfully protects the interests of land-owners and also of those whose livelihoods depend on the land being acquired. Under our Constitution, land is a State subject but land acquisition is a Concurrent subject. So far, the basic law governing the land acquisition process has been the Land Acquisition Act, 1894. Although it has been amended from time to time, it is painfully evident that thebasiclawhasbecomearchaic.Againstthisbackdrop, review of the outdated Land Acquisition Act of 1894 in the country could not have come at a more appropriate time. After passage from both the Houses of the Parliament, the "Right to Fair Compensation and Transparency in Land Acquisition, Rehabilitation and Resettlement Bill, 2013" is currently awaiting the assent of the President of India and will become a new law within next three months. In this article we discuss the key provisions of the new bill and how it would bring aboutachangeintheexistinglandacquisitionscenario. Some of the key provisions of the new legislation, which hasbeenpassedbytheParliamenton6September,2013 arelistedbelow: TheBillprovidesforanexpandeddefinitionofpublic purpose that includes infrastructure projects, including: (i) all activities listed by the Government as infrastructure projects in its notification dated March 27, 2012, excluding private hospitals, private educational institutions and private hotels; (ii) projects related to agriculture, agro-processing, cold storage facilities; (iii) industrial corridors or mining activities, national investment and manufacturing zones as designated in the National Manufacturing Policy; (iv) Government administered or Government aided educational and research institutions; (v) sports, health care, transport or space program projects; and (vi) any other infrastructural facilities notified by the Central Government after tabling the notification in the Parliament. KeyProvisions vDefinitionofPublicPurpose -Key Provisions of the New Legislation
  • 37. Further, public purpose also includes acquisition of land for use by: (a) Public-Private Partnership Projects (PPPs), where ownership of land continues to vest with the Government; and (b) private companies,forthepurposesmentionedabove. The new legislation requires the concerned Government to conduct a Social Impact Analysis (SIA) prior to every acquisition of land. The SIA has to be conducted in consultation with the Panchayat at the village level and at the Municipality or municipalcorporationattheurbanlevel. Further, the SIA has to be completed within six monthsfromthedateofitscommencementandwill take into account, amongst other factors, the social impact of the project on the overall costs of the project vis-a-vis the benefits of the project. The SIA report will be made available in the local language at the offices of the Panchayat, Municipality as the casemaybe. The SIA will be evaluated by an Expert Group, which has to look at whether the project serves any public purpose; or the social costs and adverse social impacts outweigh the potential benefits. It is required to submit its recommendation within two monthsofitsconstitution. The provisions of this Act relating to consent shall apply when the appropriate Government acquires landforthefollowingpurposes,namely:- (a) For public private partnership projects, where theownershipofthelandcontinuestovestwith theGovernment,forpublicpurposeand (b) for private companies for public purpose, provided that in the case of acquisition for- (i) Private companies, the prior consent of at lest eighty per cent of affected families; and (ii) Public Private Partnership projects, the prior consent of at least seventy per cent of affected families shall be obtained through a process as may be prescribed by the appropriate Government. The process of obtaining the consent shall be carried out along with the Social Impact Analysis(SIA)study. vSocialImpactAnalysis(SIA) vConsentforLandAcquisition vCompensationtoLandOwners vRehabilitation & Resettlement (R&R) Entitlements As per the new legislation, the market value of the acquiredlandshallbebasedonthe (i) market value specified in the Indian Stamp Act for the registration ofsaledeeds;or (ii) average of the top 50 per cent of all the sale deeds in the similar type of land situated in the vicinity; whichever is higher. Once the market value is computed, it shall be multiplied by a factor (1-2) for rural areas, based on the distance of the said land from urban areas. Once the total compensation is arrived at, the Collector shall impose a 100 per cent Solatium on it for both rural as well as urban areas. Further, the Collector shall award an amount at the rate of 12 per cent per annum on the market value from the period commencing from date of publication of the SIA till the date of the award of the Collector or the date of takingpossessionoftheland,whicheverisearlier. One of the key provisions of the new legislation is that families owning the land or whose livelihood is affected as a result of land acquisition shall be entitled for a specified R&R package, which has been elaborated in the Schedule II. Affected family insuchcaseswouldinclude- (i) A family whose land or other immovable propertyhasbeenacquired; (ii) A family which does not own any land but a member or members of such family may be agricultural labourers, tenants including any form of tenancy or holding of usufruct right, share-croppers or artisans or who may be working in the affected area for three years prior to the acquisition of the land, whose primary source of livelihood stand affected by theacquisitionofland; (iii) The Scheduled Tribes and other traditional forest dwellers that have lost any of their forest rights recognised under the Scheduled Tribes and Other Traditional Forest Dwellers (Recognition of Forest Rights) Act, 2006 due to acquisitionofland; (iv) Family whose primary source of livelihood for three years prior to the acquisition of the land is dependent on forests or water bodies and 35 AUGUST-SEPTEMBER 2013
  • 38. 36ECONOMY MATTERS vAdditional Compensation to Original land Owner vProcessofLandAcquisition vReturnofUnutilizedLand vAcquisition of Irrigated Multi Cropped Land vLeasingofLand Bill stipulates that 40 per cent of appreciated land value (profit) should be shared with original land owners in cases where - Any land more than the threshold stipulated by the State Government which has been purchased through private negotiations on or after 5 September 2011 and acquired by the Government within three (3) years of commencement of this Bill; and whenever the ownership of any land acquired under this Act is transferred to any person for consideration, without any development having taken place on such land in proportion to the value at which the landwasacquiredwithinaperiodof5yearsfromthe date of acquisition. For both the cases, benefit shall accrue only on the first sale or transfer that occurs aftertheconclusionoftheacquisitionproceedings. The entire process of land acquisition, starting from Social Impact Analysis (SIA) to possession of land by the concerned Collector (after ensuring full payment of compensation as well as rehabilitation and resettlement entitlements are paid or tendered to the entitled persons) would take a minimum time of56months(see Table1). The New Bill stipulates that any acquired land, if not used for 5 years should be returned to owner or to the State Land Bank in case the land owner does not return the original compensation, as the case may be. The new legislation stipulates certain limits on acquisition of Multi-Cropped Land to be determined by the appropriate Government considering the relevantStatespecificfactorsandcircumstances. The new legislation permits the State Government to exercise the option of taking the land on lease insteadofacquiringtheland. includes gatherers of forest produce, hunters, fisher folk and boatmen and such livelihood is affectedduetoacquisitionofland; (v) A member of the family who has been assigned land by the State Government or the Central Government under any of its schemes and such landisunderacquisition; (vi) A family residing on any land in the urban areas for preceding three years or more prior to the acquisition of the land or whose primary source of livelihood for three years prior to the acquisition of the land is affected by the acquisitionofsuchland; The Bill provides that R&R will be mandatory in case of private purchase of land above a certain threshold, which shall be determined by individual State Governments after considering the relevant state specific factors. Further, it is also stipulated that it is mandatory to file an application with the concerned Collector before acquisition of such land, notifying him of - (a) intent to purchase; (b) purpose for which such purchase is being made; and (c) particularsoflandstobepurchased. No land use change shall be permitted in such cases if rehabilitation and resettlement is not complied withinfull. The proposed Bill has a provision of Retrospective in cases where - (i) notification has been issued but no award under Section 11 of the L.A. Act 1894 has been made; (ii) an award under Section 11 on the L.A. Act of 1894 has been made 5 years or more prior to the commencement of this New Bill but the physical possession of the land has not been taken or the compensation has not been paid; and (iii) more than 50 per cent of land owners have not accepted the compensation. vResettlement & Rehabilitation (R&R) in caseofPrivatePurchaseofLand vRetrospective Applicability of the New Bill
  • 39. 37 AUGUST-SEPTEMBER 2013 Q.Do you think the proposed Bill will raise the cost of acquiringland?Ifyes,byhowmuch? Q. Apart from the cost, what is industry's view on the process of land acquisition as stipulated in the new Bill? A. As per the proposed provisions in the new Bill, CII estimates predict that cost of land acquisition in the countryislikelytoincreaseby3-3.5times. At a time when economy is trying to recover from the slowdown and National Manufacturing Policy (NMP) has set an ambitious target of creating 100 million jobs by 2025, enhanced cost of land acquisition could severely affect the viability of industrial projects acrosstheboardanderodecompetitivenessofIndian manufacturingsector. We in CII had suggested that since the proposed formula in the new Bill to calculate market value of thelandalreadyhas'Multiplier'totake careofunder- valuation of land, 'Solatium' should be dropped and if at all it has to be retained, it should be reduced from the proposed 100 per cent to 30 per cent. Similarly, R&R provisions should have been worked out separately for each category of affected families, depending upon their losses, with the ultimate objective of improving their quality of lives, post land acquisition. A. The process of land acquisition, starting from the Social Impact Analysis (SIA) up to the possession of the Land by the Collector, as proposed in the new Bill is highly complex and time taking, stretching up to a minimum of 56 Months. This elaborate process needs tobesimplifiedbyeithereliminatingfewprocessesor Q. Do you think the proposed Right to Fair Compensation and Transparency in Land Acquisition, Rehabilitation and Resettlement Bill, 2013 is a step in therightdirection? A. We in CII have always believed that India has and can have enough land for all its requirements - Agricultural, Industrial & Domestic, provided they are used judiciously and 'Supply' is managed efficiently. It is in this background that review of the archaic Land Acquisition Act of 1894 has come at a very appropriatetime. Right to Fair Compensation and Transparency in Land Acquisition, Rehabilitation and Resettlement Bill, 2013, which is currently awaiting President's formal approvalisamilestonesinceitisthefirsteverattempt to combine Resettlement of project affected people and their Rehabilitation (R&R) with land acquisition. Thisbecomesevenmoreimportantinthewakeofthe fact that last decade has witnessed several cases of land acquisition, especially in Government projects where compensation to the project affected people has not been fair and resettlement and rehabilitation measures for the affected people have not been proper. Besides, the fact that Government would continue to acquire land for the Industry, as proposed in the new legislation, is heartening as we have always maintained that Government should have a prominent role in land acquisition as agglomerating land from numerous owners is not a task which corporate sector can do effectively, especially in the absence of proper land records and small & scattered land-holdingsinthecountry. Mr B Muthuraman Chairman, CII National Task Force on Land Acquisition Past President, CII and Vice Chairman, Tata Steel Limited CII View Point LARR Bill: A Step Forward, Yet Industry Has Concerns
  • 40. 38ECONOMY MATTERS adversely affect Industries that, by nature, grow in phases. Instead, we had suggested for a 'Land Use Plan' framework and align return of land with it, which can be monitored by the Chief Secretary of the concernedStateonacase-to-casebasis. A. Digitization of Land Records: Over decades, the land records have been maintained & upgraded manually onad-hocbasiswithhardlyanyfocusonaccuracyand authenticity. Archaic and un-authentic land records are the biggest pit-falls and road-blocks in land acquisition & disbursement of compensation. To streamline and bring transparency, CII strongly recommends speedy digitization of land records by state Government and the availability of these records on-line. The digitization of land records, across all States, over a specified time period, with comprehensive scrutiny would help make land records transparent, tamper-proof and facilitate detailed planning of land use for industrial, agricultureandresidentialdevelopment. Zoning of Land: Simultaneously with digitization, CII alsorecommendsex-antezoningoflandsoastohave aclearmapping,identificationandsegregationofthe land for various purposes, over a 100 - 150 year horizon. Updating, digitization and zoning of land records will be key for achieving success in the processofsystematicdevelopmentofindustrialland. Set up State Land Bank Corporations: CII recommends setting up of dedicated Institutions for acquiring fallow, barren and unproductive as well as other Lands, ex-ante, for Industrial purposes, as a transparent and viable solution to the problem. The job of these State Land Bank Corporations would be to scientifically acquire large tracts of non-cultivable and other lands, develop them as Land Banks for the future and have a transparent mechanism to pass themontotheprivatesector. Q.Does CII have other suggestions for successfully resolving the issue of Land Acquisition in the long run? making them simultaneous, with an objective to facilitate an acquisition within a minimum time line of 2years. A. Industry has specific concerns and suggestions on some of the key provisions of the proposed new Bill. First, though Government would continue to acquire land for Private Sector and PPP Projects, mandatory consent requirement from affected families - 80 per cent and 70 per cent for private sector & PPP respectively appears to be very high and continues to be a cause of concern. The process of obtaining consent as provided in the new Bill in itself is long drawn out, goes through various stages, taking up to several years. We in CII had suggested that consent provision should be limited to 60 per cent of the land owners. Second, providing for R&R entitlements to affected families in cases of direct acquisition of land from the owners above a certain threshold, to be determined bytheStates,couldalsohavebeenavoided.Assellers would have already bargained for the premium on land value in cases of direct purchase, we had suggested laying down of suitable R&R entitlements onlyforaffectedfamilieswholosetheirlivelihoodasa resultofsuchlandacquisition. Third, retrospective applicability of the new legislation under certain cases has also raised Industry apprehensions. To avoid delays and consequent cost escalation, CII had maintained right from the beginning that where land acquisition notification under section 11 of LA Act 1894 has already been issued and the process of award initiated, land acquisition process should be continuedandnotstartedafresh. Fourth, the provision as per the new Bill stipulating return of the unutilized land after 5 years to owner or totheStateLandBank(SLB),asthecasemaybecould Q.What are some of the other concerns regarding the newBill?
  • 41. 39 AUGUST-SEPTEMBER 2013 Process (Sequential) Detail Minimum Stipulated Time Social Impact Analysis (SIA) Preparation of Social Impact Analysis(SIA) 6 Months in consultation with the concerned Panchayat, Municipality or Municipal Corporation Multi-disciplinary Expert Group Appraisal of SIA by an independent multi- 2 Months disciplinary Expert Group constituted by the appropriate Government Preliminary Notification Publication of Preliminary Notification along 12 Months with the details of land to be acquired and determination of market value of land Publication of Declaration Appropriate Government to publish the 12 Months declaration after Requiring Body deposits the amount & examining of any objections Award Collector shall make the award 12 Months Corrections to Awards Clerical or Arithmetical Corrections to 6 Months Awards by Collector Possession of Land Collector shall take possession of land 3 Months for the (after ensuring full payment of compensation compensation and a period as well as rehabilitation and resettlement of 6 Months for the entitlements are paid or tendered to the monetary part of R&R entitled persons) entitlements Table 1: Minimum Stipulated Time Frame under Various Processes