1. Female
Subjects: Overweight and moderately obese men and women ages 18-85 years old with a BMI greater
than 28 were eligible for this study. Individuals with serious diseases (other than comorbidities of
obesity) were excluded. In addition, people with weight changes greater than 5 kg within the previous
six months were excluded. This study was approved by the University of Michigan Institutional
Review Board (IRB Number: HUM00030088)
Intervention: Subjects were prescribed a diet low in calories (800-1200 kcal, depending upon size,
sex and dietician’s judgment) and are expected to exercise for at least 150 minutes per week. They meet
weekly with dieticians for the first four weeks, monthly for the next three months, and then every three
months after that. The dieticians help to emphasize caloric intake and eliminate food dense in calories.
In addition, the subjects use meal substitutes four to fourteen times weekly until a 15% weight loss is
achieved.
Statistical analyses: After compiling data from these tests, Student’s t-tests were performed to assess
changes from the baseline to post weight-loss, and Pearson correlations were completed to determine
associations between variables of interest. Significance was determined as p<0.05.
ABSTRACT
Weight loss is accompanied by a loss of lean muscle mass and subsequent
decrease in resting metabolic rate (RMR). The extent of decline in RMR in obese
individuals following weight loss is uncertain, as is its precise relationship to lean
muscle loss and fitness. The purpose of this study is to identify the relationship of
lean muscle mass, fitness and RMR in obese adults both before and after weight
loss. The physical and metabolic characteristics (age, sex, body composition, VO2
max, RMR) of obese subjects participating in an intensive weight maintenance
program were measured at baseline, and then after losing 15% of their body
weight (~3 months). VO2 max was assessed via treadmill test and body
composition was measured via dual-energy x-ray absorptiometry (DXA). RMR,
fitness and body composition were examined before and after weight loss to
determine how weight loss affects resting metabolic rate, and the extent to which
lean body mass and fitness influence these alterations. Identifying the nature of
these relationships will permit tailoring of weight loss interventions to maximize
results.
METHODS RESULTS (cont.)
CONCLUSIONS
BIBLIOGRAPHY
1. Schwartz, A., and E. Doucet. "Relative changes in resting energy expenditure
during." Obesity Reviews 11 (2010): 531-547. Print.
2. Bryner, R W, et al. “Effects of resistance vs. aerobic training combined with an 800 calorie liquid diet on lean body
mass and resting metabolic rate.” Journal of the American College of Nutrition 18 (1999): 115-21. PubMed. Web. 15
Feb. 2012. <http://www.ncbi.nlm.nih.gov/pubmed/10204826>.
3. Geliebter, A, et al. “Effects of strength or aerobic training on body composition, resting metabolic rate, and peak
oxygen consumption in obese dieting subjects.” The American Journal of Clinical Nutrition 66 (1997): 557-63.
PubMed. Web. 15 Feb. 2012. <http://www.ncbi.nlm.nih.gov/pubmed/9280173>.
Although there are significant positive relationships between lean mass and resting
energy expenditure at both baseline and post weight-loss, the changes in each were
not correlated, suggesting that additional factors influence resting energy
expenditure following weight-loss. Future research should seek to identify these
factors.
PURPOSE AND HYPOTHESIS
Metabolic Changes:
As individuals lose weight, several metabolic changes occur. Although a decline
in resting metabolic rate is usually observed, researchers have not demonstrated
the extent of this decline (1). Since weight loss results from an imbalance in
energy intake and expenditure, the metabolism adjusts to this reduction. As a
result, it uses fewer calories in order to maintain basal metabolic functions.
Resting Metabolic Rate:
The resting metabolic rate (RMR) serves as a measure of the energy that an
individual uses to maintain normal functions. It essentially predicts the number of
calories that a subject would burn if they were to lie still for twenty-four straight
hours. This number decreases as individuals lose weight. The goal of the project is
to analyze this relationship and to determine how it is affected by fitness and body
composition.
The purpose of this study was to determine how weight loss via a very low calorie
diet affects resting metabolic rate, and the extent to which lean body mass and
fitness influence these alterations. We hypothesized that a greater decrease in
weight would result in a greater decline in resting metabolic rate. In addition,
decreases in lean mass and increases in fitness levels should augment the degree of
this decline.
Weight Loss and Resting Metabolic Rate in Obese Adults
Cook Welch1, Heidi B. IglayReger1, PhD, Amy E. Rothberg2, MD, PhD, Charles F. Burant2, MD, PhD,
Paul M. Gordon1, PhD, MPH, FACSM
1Laboratory for Physical Activity and Exercise Intervention Research, Department of Physical Medicine and Rehabilitation;
2Department of Internal Medicine, Division of Metabolism, Endocrinology and Diabetes
Fitness:
An individual’s activity level
may affect the relationship
between RMR and weight loss
(2,3). Their fitness can be
measured by a VO2 max test,
which measures the maximal
amount of oxygen consumed
during peak exercise and is an
accurate marker for
cardiorespiratory fitness.
Individuals with higher level of
fitness display a higher VO2
max.
Body Composition:
In addition to fitness level, an individual’s body composition may explain some
patterns seen with RMR and weight loss (3). As individual’s lose weight, they
shed both fat and lean mass. Lean mass requires more energy to maintain, so the
observed decline in resting metabolic rate may be more closely related to the loss
of muscle mass.
RESULTS
Resting
Metabolic
Rate
Fitness
Caloric
Intake
Lean
Mass
Figure 1. Factors that contribute to RMR
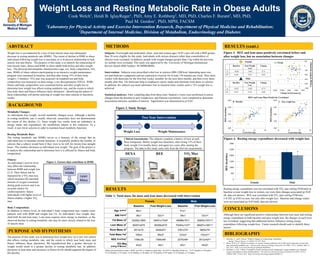
Figure 3. REE and lean mass positively correlated before and
after weight loss, but no association between changes
Table 1: Total mass, fat mass and lean mass decreased with intervention
Female Male
Baseline Post Weight-Loss Baseline Post Weight-Loss
Age (years)
1
48±1 51±1
BMI (kg/m)
2
38±1 32±1b 39±1 33±1b
Fat Mass (g)
3
53292±1800 39441±1534b 49088±1611 32825±1531a,b
Lean Mass (g)
3
50207±979 46256±972b 70240±1107a 66297±1061a,b
Bone Mass (g)
3
2913±75 3048±81b 3761±75a 3805±75a
Total Mass (kg)
3
106±4 89±2b 123±2a 103±2a,b
REE (kcal/day)
4
1796±39 1595±40b 2275±49a 2012±42a,b
VO2 Max
(ml/kg FFM/min)
5 43±2 45±1 42±1 45±2b
Weight MaintenanceBACKGROUND
Figure 2. Study Design
Weight Loss
Two Year Intervention
DEXA REE VO2 Max
Clinical Assessments: The subjects complete a battery of tests at each
three timepoints. Before weight loss (baseline), after losing 15% of their
body weight (3-6 months later), and again two years after starting the
program. The data in this study came only from the first two assessments.
Weight Maintenance
Values are presented as mean ± SEM. ap<0.05 vs. female at same time. bp<0.05 vs. baseline within sex. 1n=37 females, n=42 males.
2n=33 females, n=37 males. 3n=32 females, n=38 males. 4n=34 females, n=39 males. 5n=32 females, n=35 males.
Figure 4. Resting energy expenditure decreased with weight loss
0
500
1000
1500
2000
2500
3000
Female Male
*
*
REE(kcal/day)
Male
Baseline Post-Weight
Loss
Change
p <0.05 <0.05 0.71
R2 0.59 0.30 0.04
Baseline Post-Weight
Loss
Change
p <0.05 <0.05 0.71
R2 0.48 0.47 0.05
REE and Lean Mass Positively Correlated
1000
1500
2000
2500
3000
30 50 70 90
Thousands
1000
1500
2000
2500
3000
30 50 70 90
B. Baseline C. Post weight-loss
REE(kcal/day)
REE(kcal/day)
Lean mass (kg)Lean mass (kg)
-1000
-800
-600
-400
-200
0
200
-14000 -10000 -6000 -2000 2000
A. Change
Change in lean mass (g)
ChangeinREE(kcal/day)
Resting energy expenditure was not correlated with VO2 max (ml/kg FFM/min) at
baseline or post weight-loss in women, nor were their changes associated (p>0.05
all, data not shown). REE was correlated with VO2 max (ml/kg FFM/min;
r=0.385, p<0.05) in men, but only after weight loss. Baseline and change values
were not associated (p>0.05 both, data not shown).