1. F l o r i d a S t a t e U n i v e r s i t y P a g e | 1
Bloomin’
Brands
NYSE: BLMN,
BLMN US
Sector: Service
Industry: Restaurant (Casual)
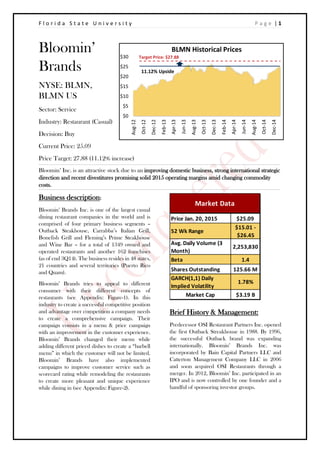
Decision: Buy
Current Price: 25.09
Price Target: 27.88 (11.12% increase)
Bloomin’ Inc. is an attractive stock due to an improving domestic business, strong international strategic
direction and recent divestitures promising solid 2015 operating margins amid changing commodity
costs.
Business description:
Bloomin’ Brands Inc. is one of the largest casual
dining restaurant companies in the world and is
comprised of four primary business segments –
Outback Steakhouse, Carrabba’s Italian Grill,
Bonefish Grill and Fleming’s Prime Steakhouse
and Wine Bar – for a total of 1349 owned and
operated restaurants and another 162 franchises
(as of end 3Q14). The business resides in 48 states,
21 countries and several territories (Puerto Rico
and Quam).
Bloomin’ Brands tries to appeal to different
consumer with their different concepts of
restaurants (see Appendix: Figure-1). In this
industry to create a successful competitive position
and advantage over competition a company needs
to create a comprehensive campaign. Their
campaign consists in a menu & price campaign
with an improvement in the customer experience.
Bloomin’ Brands changed their menu while
adding different priced dishes to create a “barbell
menu” in which the customer will not be limited.
Bloomin’ Brands have also implemented
campaigns to improve customer service such as
scorecard rating while remodeling the restaurants
to create more pleasant and unique experience
while dining in (see Appendix: Figure-2).
Brief History & Management:
Predecessor OSI Restaurant Partners Inc. opened
the first Outback Streakhouse in 1988. By 1996,
the successful Outback brand was expanding
internationally. Bloomin’ Brands Inc. was
incorporated by Bain Capital Partners LLC and
Catterton Management Company LLC in 2006
and soon acquired OSI Restaurants through a
merger. In 2012, Bloomin’ Inc. participated in an
IPO and is now controlled by one founder and a
handful of sponsoring investor groups.
$0
$5
$10
$15
$20
$25
$30
Aug-12
Oct-12
Dec-12
Feb-13
Apr-13
Jun-13
Aug-13
Oct-13
Dec-13
Feb-14
Apr-14
Jun-14
Aug-14
Oct-14
Dec-14
BLMN Historical Prices
Target Price: $27.88
11.12% Upside
Price Jan. 20, 2015 $25.09
52 Wk Range
$15.01 -
$26.45
Avg. Daily Volume (3
Month)
2,253,830
Beta 1.4
Shares Outstanding 125.66 M
GARCH(1,1) Daily
Implied Volatility
1.78%
Market Cap $3.19 B
Market Data
2. F l o r i d a S t a t e U n i v e r s i t y P a g e | 2
The decision by BLMN to host their first analyst day since their IPO may be prudent in the long run as
Chairman and CEO of the Board, Elizabeth Smith, revisited their Revitalization Plan (introduced Q4 2009)
offering specific guidance and focus on targeted international growth, operational productivity, and overall
organizational effectiveness. Elizabeth Smith has been at BLMN since November 2009, and leads the Brand
Presidents who together combine extensive food & beverage operational experience with proven industry
leadership ability. Strategic changes in hiring a new Outback International President, Pat Murtha, as well as
Digital and Chief Information Officer, Donagh Herilhy, Chief Development Officer Suk Singh, and Chief
Global Supply Chain Officer, Juan Guerro, to target international expansion and margin protection through
stronger supply chain management, could aid in meeting 2015 guidelines and estimates. Recognized as only
one of two Casual Dinning Restaurant’s on Fortune 500’s Most Admired Companies, BLMN will look to
leverage its experienced field team and entrepreneurial regional management culture in order to grow comp
profitability and scale.
Industry Overview & Competitive Positioning
Competing in an industry with $683.4 billion
dollar in sales Bloomin’ Brands has approximately
.64% of the market share. The restaurant industry
relies heavily on location and the ability to have
presence in every geographical market without
cannibalizing sales. The industry is fragmented and
mature which affects the margins of the firms
competing. There are 990,000 restaurant locations in
the United States. Customer loyalty is very hard to
acquire and creating brand image and differentiation is
difficult in an industry primarily driven by prices. For
2014, sales of the casual dining segment grew .8% in
comparison to a negative growth of .1% in 2013. 2014
was a successful year for the industry.
Main competitors similar to Bloomin’ Brands
in size are Darden Restaurants with sales of 6.4B,
Brinker International with sales of 2.9B, The
cheesecake Factory with sales of 1.95B and Buffalo
Wild Wings with sales of 1.45B. Besides these big
competitors there are smaller cap firms and locally
owned restaurants that compete for the local markets.
Larger firms take advantage of economies of scale for
cheaper products, centralized supply chains and also
centralized oversight and management. Locally owned
restaurants offer more specialized menus. Due to
changing consumer patterns, consumers are looking
for locally sourced meats and seafood and locally
grown produce. Small owner restaurants can satisfy
these trends better.
Sales are dependent on the state of the
economy and consumer trends. The state of the
economy is very important for the restaurant industry
since the demand for the services is highly elastic. On
average a household spends $2,678 per year at
restaurants. Income is the No.1 driver of household
spending since households that earn $70,000+ account
for 1/3rd
of all U.S households, but more than ½ of total
restaurant spending. According to the Restaurant Performance Index, which tracks the health of the restaurant
Quick
Service
27%
Casual
Dining
32%
Other
41%
Food-Service Market
Breakdown
$43 $120 $239 $397
$587 $683
1
Restaurant Industry Sales
In billions of current
dollars
1970 1980 1990 2000 2010 2014
3. F l o r i d a S t a t e U n i v e r s i t y P a g e | 3
industry, the industry is healthy and future outlooks are positive. In December 2014 the index was in 103.
Regarding this index, anything above 100 shows industry expansion.
Investment Summary
Signs of strength
We issue a BUY recommendation on Bloomin’ Brands, Inc. with a year-end 2015 target price of $27.88, with
upside potential towards our bull case price of $37.08, giving investors potential upside return of 11.12% and 47.79%,
respectively.
Reasons for Upside Potential:
Significant margin improvement opportunities. A 100 basis point improvement from productivity and
efficiency gains in COGS throughout the projection period increases the stock price in our base case model
to $32.51, a 16.6% increase.
Potential for high same-store sales in Brazil to capture a larger percentage of the total revenues, which
currently are 86% domestically driven.
Geographically diversified source of cash flows, potentially decreasing the risk profile of BLMN.
BLMN is concentrated in strong hands with 98% of shares held by institutions, of which Bain Capital is
the largest shareholder at 30% of float held.
Improving capital structure allowing fiscal flexibility, and improvements in risk management.
BLMN Improving Domestically
After poor 2Q14 growth, management’s focus on their core competencies resulted in 3Q14 comps of 4.8%, 4.8%
and 2.6% at Outback, Flemings, and Bonefish, respectively. Increasing levels of domestic discretionary income
(fueled in part by reduced gas prices) promise to further boost customer traffic and industry-wide sales. Many
economists believe that even though during the 2014 holiday season a reduction in oil prices did not evolve into
more spending, it is a matter of time until consumer start spending their oil savings in other services.
BLMN Displaying Technology & Innovation
According to the National Restaurant Association, most restaurants will begin using technology to reach out to
clients. The use of social media will be beneficial for companies. Many brands have been trying to implement the
use of technology to enhance the consumer experience. A successful application of technology is expected to
improve consumer satisfaction and sales.
Bloomin’ Brands through their R&D division have established a 12 month pipeline of new menus. Bloomin’ Brands
can successfully and quickly introduce new items and menus to satisfy consumer trends. For example Bloomin’
Brands have introduced under 600 calories items which respond to the trend of healthier eating and lifestyles.
BLMN Rolling Out the Lunch Menu
Outback and Carrabba’s now offer weekday lunches, a growing revenue stream, in 59% and 54% of their domestic
locations, respectively. These figures are up from 56% and 51% (2Q14) and 26% and 28% (3Q13). In 2Q2015
Outback Steakhouse is expected to roll out their brand new lunch menu. Bloomin’ Brands tested the new menu by
offering the options only on weekends. The menu options were directed at minimizing the impact of sale
cannibalization. The upcoming launch is expected to increase sales and improve restaurant comps. Bloomin’ Brands
plans to launch a media campaign and service model along with the new menu.
BLMN Relocating and Remodeling
One of the keys for customer loyalty is geographic location. With the new relocation programs through the software
Bloomin’ Brands acquired, the company expects to lift sales of the dinner menu and introduce at the same time the
lunch menu. Around 100 restaurants will be relocated in the upcoming year to reduce cannibalization and increase
sales/geographic reach. All brands will also undergo remodeling phases - Bloomin’ Brands has pledged to renovate
10% of locations annually. Outback already internally remodeled all locations and is now working to remodel the
exteriors. We feel that the reinvestment of capital into existing stores while maintaining strategic expansion plans is
a sign of healthy business operations.
4. F l o r i d a S t a t e U n i v e r s i t y P a g e | 4
BLMN Expanding Bonefish
The main way for food service brands to increase growth is by opening new locations. Bloomin’ Brands new
expansion campaign will have Bonefish Grill as their flagship Brands. Currently there are 201 locations of Bonefish
and Bloomin’ Brands goal is 300 nationally. This will be a key growth opportunity for Bloomin’ Brands since the
company will be able to reach out to many different markets.
BLMN Moving Globally with a Strong Strategic Direction
A highly competitive U.S. market has driven the attention of the big firms internationally. Bloomin’ Brands has
Outback Steakhouse locations in China, South Kore, Brazil and Mexico.
CEO Elizabeth Smith stated that Korean restaurants are in an “aggressive battle for market share with an increased
reliance on discounting”. Accordingly, out of the 36 locations that Bloomin’ Inc. closed/are closing in 4Q14/1Q15,
34 are in South Korea. We applaud this decision, as many of the restaurants selected to close have continued to
provide negative or limited cash flows. This divestment will free management’s time and capital to pursue expansion
in more attractive economies.
Bloomin’ Brand also has a position in Brazil and is one of the pioneers in entering the Brazilian market. Sixteen
locations are planned to open in Brazil in early 2015 (adding to a base of 48). Sao Paulo is the second largest pizza
consumer in the world after New York. Pizza, pasta and steak/seafood are 3 of the top 5 most popular menu items
for this city.
.
BLMN Divesting/Portfolio Optimization
As an additional precaution, Bloomin’ Inc. has recently sold both corporate jets and has divested itself of the Roy’s
brands. We see these actions as indicative of a healthy management desire to cut unnecessary operating costs. We
also foresee an additional possible upside in out years as a result of real estate monetization (Bloomin’ Inc. plans on
leasing all property going forward). Leasing stores will weigh on store level margins, but if management can sell its
real estate and either pay down debt or buyback stock, they may boost shareholder value.
Valuation Summary
In order to arrive at our base case target price of $27.88,
we used a Discounted Cash Flow model utilizing a Free
Cash Flow to the Firm approach.
Unlevered FCFF DCF with Bear, Base, and Bull
Case.
Dynamic WACC using a bottom up CAPM and
bottom up Beta approach.
Terminal Value Calculated using Exit Multiple
Method and Perpetuity Growth Method.
Our bull case target price of $37.08 is based on higher
than expected sales from BLMN’s international capital
investment in Brazil and China as well as relocations of
many domestic stores for optimization of sales. Sales grow
at almost double the rate of the base case for each of the
forecast years, except for the terminal year in which sales
grow at 3%, the same as in the base case.
Recommendation Criteria Price Range
Jan. 20, 2015 Price $25.09
10%+ Upside Price
Above
$27.60
BUY
10% Downside to 10%
Upside Price
$22.58-
$27.60
HOLD
10%+ Downside Price
Below
$22.58
SELL
Base Case $27.88 $5,105.80
Bear Case $16.79 $3,960.50
Valuation DCF
Bull Case $37.08
EV
$6,295.70
5. F l o r i d a S t a t e U n i v e r s i t y P a g e | 5
Our bear case target price of $16.79 assumes the
downside of 0% sales growth in every year of the
projection period. This is based on the potential for
emerging market recessions in China and inflationary
pressures in Brazil that could cause a systemic market
crisis in both of BLMN’s main expansionary target
markets. We assume that the negative growth in these
countries will be offset by growth domestically, thereby
arriving at 0% sales growth.
Taxes in all three models are set to the marginal US
corporate tax rate of 39.1%, assuming all firms will
eventually have to remit earnings to their home country.
Free Cash Flow to Firm Model
We evaluated BLMN using a 3-Stage Discounted Cash
Flow Analysis. A Free Cash Flow to the Firm (FCFF)
model was chosen for a few reasons. First the firm is
highly levered with market value of debt totaling more
than $2.5 Billion (including PV of Capital Leases and
Purchase Obligations). This high leverage is not
expected to continue ad infinitum and thus we chose
the target Market Value of Debt-to-Equity for the
industry of 28% as a guiding point as to what the firm’s
capital structure will look like in the future. Currently
BLMN has a Market Value of Debt to Market Value of
Equity of 82.1%. Management has made it clear in the
most recent 10-Q and First Analyst Investor Day that
they plan to reduce their debt structure going forward
and to fund expansion CapEx through FFO. The main
drivers of this model are EBITDA Margin, growth in
sales, reduction in COGS margin, and the dynamic
WACC structure, driven by decreasing future leverage,
which decreases the levered beta and the CAPM
portion in calculating the Cost of Capital.
Revenue
Revenues were forecasted using a 3-Stage model. In the
first stage sales growth was estimated at 7% for the next
2 years.
7% growth was derived from a combination of analyst
expectations, management expectations, and the strong
adherence towards international expansion. Growth
from 2011 to 2013 was in the 3%-4% range. 2014 was a
year of exceptional historical growth relatively speaking,
due mostly to the new units opened in Brazil, and a
revitalization of domestic units through relocations,
menu revamps, and the introduction of lunch menus at
some locations. The initial high growth period is
supported by our expected growth for Outback in Brazil and the introduction of a second concept (Carrabbas)
in Sorocaba, Brazil during 1H 2015. Sales from 2017-2019 will decrease on average by approximately 125
0%
2%
4%
6%
8%
2012 2013 2014 2015 2016 2017 2018 2019
Sales Growth Forecast
7.10%
7.20%
7.30%
7.40%
7.50%
7.60%
7.70%
2014 2015 2016 2017 2018 2019
WACC
7.50%
8.00%
8.50%
9.00%
9.50%
10.00%
10.50%
2014 2015 2016 2017 2018 2019
CAPM
$0.00
$10.00
$20.00
$30.00
$40.00
BLMN Potential Price
Range
$37.08
(+48%)
$27.88
(+11%)
$16.79
(-33%)
6. F l o r i d a S t a t e U n i v e r s i t y P a g e | 6
basis points a year to end at 3% growth in 2019. Growth
will decrease to this level by 2019 due to loss of market
share and competition.
Depreciation
We assume that BLMN will continue to depreciate its
assets similar to rates in the historical estimation period
from 2011 to 2013. Depreciation in these years was 4%,
3.89%, and 3.97% of sales, respectively. In the
forecasted period deprecation remains an average of the
historical estimation period of 4%.
Margins
Historical Gross Profit margins hover in the 39-40%
range. Gross profit will continue to be driven by
productivity increases, subdued commodity inflation,
and lower labor expenses in foreign countries such as
Brazil and China. BLMN’s Management forecast
commodity inflation to be in the 4-6% range for 2015,
which will be slightly offset by increased sales growth.
Therefore, we have kept Gross Profit margin in the
forecast period at 40%, a slight increase over the average
historical due to decreasing labor costs and productivity
gains outweighing commodity price inflation. Our
metric for Gross Profit differs from what is reported in
the 10K because we include Labor expenses as part of
Cost of Sales, whereas BLMN does not include Labor
expenses as part of cost of sales to calculate gross profit.
EBITDA margins are one of the more important
drivers for the firm as a whole, due to the fact this metric
really shows the value employees add to the operation,
as it is free of debt and before interest, taxes,
depreciation, and amortization. EBITDA margin in the
historical period of 2011-2013 grew at a CAGR of 6.2%.
We expect EBITDA to grow at a CAGR of 3.5% in the
forecast period; 2015-2019 and EBITDA margins to
stay relatively flat at 9.2% of sales.
Selling, General & Administrative (SG&A) Expense Growth
Currently, SG&A is held constant at 30.8% of sales, slightly higher than 2013 due to increased advertising
expenses from a new rollout of a lunch menu as well as new product rollouts.
Interest Expenses
As per the amended credit agreement in the most recent 10Q, OSI has two securitized loans with a revolving
credit facility on Term loan A. The total amount authorized is $1.125 billion, of which $940 million has been
used. Interest for Term Loan A is set at 75 to 125 basis points over base rate which is the highest of 3 separate
proxy rates. Currently, this rate is at 2.16%. Term Loan B is set at 3.50%. Other related interest from CMBS
loans totaling $473.5 million have varying rates. The first mortgage loan has five fixed-rate components and a
floating rate component. The fixed rate component bears interest from 2.37% to 6.81% annually. The floating
rate component is equal to the 30-day LIBOR plus 2.37%. The First Mezzanine Loan totaling $85.4 million
bears interest at 9.00% per annum, and the Second Mezzanine Loan totaling $86.2 million bears interest at
11.25% per annum.
9.00%
11.25%
Collaterlized Term Loan B
First Mortgage Loan
Floating Rate Component
of CMBS
3.50%
4.07%
30-Day LIBOR
+ 2.37%
Fixed Rate Component of
CMBS
2.37% - 6.81%
First Mezzanine Loan
Second Mezzanine Loan
BLMN Debt Financing
Loan Type
Synthetic Cost of Debt
Collateralized Term Loan A
6.22%
Rate
2.16%
0%
2%
4%
6%
8%
10%
12% 2011
2012
2013
2014E
2015E
2016E
2017E
2018E
2019E
EBITDA MARGIN
7. F l o r i d a S t a t e U n i v e r s i t y P a g e | 7
Cost of Capital
Cost of Capital was estimated at a target rate of 7.57% by 2019. We used a dynamic WACC in estimating the
hurdle rate due to the fact that the capital structure should change significantly towards the industry average
during the forecasting period. WACC was 7.43%, 7.51%, 7.56%, 7.58%, and 7.57%, during 2015-2019,
respectively. Cost of debt was estimated synthetically through a country and company default premium. To
estimate country default risk, we calculated the proportion sales in respective foreign countries, then multiplied
that by the default premium in excess of the mature market Equity Risk Premium of 5% (United States). This
ended up adding 22 basis points to the total cost of debt of 6.22%. We then added company default spread of
1.30% which was found through the interest coverage ratio of 3.04. Another approach is to just use the interest
coverage ratio, which hovers between 2 and 3. We then compare that to its respective credit rating level, which
tends to be in the BB range, which has a spread of 4% in excess of the risk free rate. The average unlevered
Beta for the 67 firms in the Restaurant sample space was 0.94.
We calculated the Equity Beta for 2015 to be 1.41. Interestingly, if we run a regression on BLMN using
4,000+ firms in the CRSP index, the stock trades closer to its unlevered Beta at 1.01. This means the market
is not as concerned with the debt and is likely supported by investor expectations of stability in future Operating
Income and free cash flow to service debt and other expenses.
Dividend Policy
BLMN announced on December 16, 2014 that they would implement a 24-cent per share dividend in 2015.
This would yield about 1% per annum at current share prices and cost the company $30 million. We do not
include dividends in the calculation of share price in our DCF as management can reinvest the announced
dividends if it decides to do so.
Capital Expenditures (CAPEX)
Capital Expenditures will mainly be driven by unit store
growth both domestically and internationally.
Financial Analysis
Future Earnings and Volatility
While BLMN just posted negative quarterly net
income of $11.44 million, it should stabilize in the
coming year. BLMN has grown net income in 2010
from $52.97 million to $208 million in 2013. We
expect earnings to increase as revenues rise as BLMN
is in the middle of expanding into higher growth
emerging markets and committed to a domestic
revitalization campaign. Due to a strong historical
presence in Brazil and the entrance of another concept,
we expect to see net income stabilize in the coming
year. We expect earnings margin to average 3.06% in
the 2015-2019 forecast period. We’ve therefore
estimated an EPS of $1.25 for 2015, which slowly rises
to $1.91 by 2019; an 11.11% CAGR.
Furthermore, as can be witnessed in the above daily
Exponentially Weighted Moving Average (EWMA),
using a lambda (JPMorgan RiskMetrics decay factor of
.94), we find that the price history is quite sensitive to
6.59%
0%
2%
4%
6%
8%
1
37
73
109
145
181
217
253
289
325
361
397
433
469
Constant vs EWMA
Volatility
Constant Volatility
EWMA-Volatility
53%
25%
9%
13%
2014 Estimate Capital
Expenditure Breakdown
Development/
relocations
Remodels
IT
Maintenance/
Other
8. F l o r i d a S t a t e U n i v e r s i t y P a g e | 8
earnings announcements. The EWMA chart above on
page 7 displays the most recent 504 trading days as of
Jan 16, 2015. The 6.85% spike on August 5, 2015 was
an earnings report that came in 2 cents below
expectations of 29 cents. A 3.2% CAGR expected
continual growth rate across core domestic AUVs,
continued out-performance of over 2% comp sales
over the Knapp index, and a targeted +10% increase
in their respective lunch platforms were drivers stated
at Q3 2014 Investor Conference that will lead to long-
term sustainable growth. We believe these core areas
will provide our basis for long term unit growth and
same store sales expectations.
Margin Improvement is Fundamental
COGS Margin and which drives Gross Profit margin is
what will make or break this stock. A 100 basis point
improvement in COGS (including labor cost from the
balance sheet) during the projection period from 60%
to 59% will cause our base case price to rise from $27.88
to $32.51, a 16.6% increase in share price. However,
with that said the historical period averages between 15
and 40 basis points above 60%. We assume that
efficiencies will decrease COGS to a flat rate of 60% for
the projection period.
Profitability and Value Metrics
We estimate the return on invested capital to average
7.84%. Furthermore, we estimate the Cost of Capital to
average 7.53% over the projection period. This is a key
signal that BLMN will need to invest wisely in its expansionary capital investment. So far, BLMN is downsizing
in one foreign country, South Korea. This is not a good signal, but with BLMN’s management engaged and
highly experienced in the market it plans to expand the most in (Brazil) in addition to introducing a second
concept internationally for the first time, we expect sales growth to remain as strong as 2014.
On an EV to EBITDA basis, BLMN trades at a multiple of 12x, which trades slightly below the 67 restaurants
in the industry of 12.96; therefore suggesting BLMN could be slightly undervalued.
7.0%
7.5%
8.0%
8.5%
2014 2015 2016 2017 2018 2019 2020
Profitability
Return on Capital Cost of Capital
0%
1%
2%
3%
4%
5%
6%
7%
2013 2012 2011
Capex as % Rev
Annual
Historical Period CAGR Projection Period
2011 2012 2013 ('11 - '13) 2014 2015 2016 2017 2018 2019
EBIT 213.456 181.137 225.357 6.25% 259 246.6562 261.4555 275.8356 286.869 295.4751
(Implied Interest) -83.38 -86.64 -74.77 -83.49 -70.78 -58.07 -45.37 -32.66 -19.95
130.076 94.495 150.584 175.5099 175.874 203.3813 230.4693 254.2107 275.5247
1- Effective Tax Rate 83% 83% 83% 83% 83% 83% 83% 83% 83%
Net Income 107.96 78.43 124.98 145.67 145.98 168.81 191.29 210.99 228.69
% margin 2.81% 1.97% 3.03% 3.30% 3.12% 3.40% 3.65% 3.87% 4.07%
Shares Outstanding 106 114 125.66 126 124 124 124 124 124
CAGR
EPS $1.02 $0.69 $0.99 $1.10 $1.18 $1.36 $1.54 $1.70 $1.84 11.88%
Price $25.32 $25.32 $25.32 $25.32 $25.32 $25.32 $25.32 $25.32 $25.32
Earnings Yield 4.02% 2.72% 3.93% 4.34% 4.65% 5.38% 6.09% 6.72% 7.28%
BLMN EPS
is expected
to increase.
9. F l o r i d a S t a t e U n i v e r s i t y P a g e | 9
BLMN margins are below the Industry Average
Understanding BLMN’s Primary Cost Drivers
Investment Risks
However, the following risks remain present when considering the company:
Carrabba’s may continue to lose money.
The only underperforming segment (again), with 3Q14 comps of -1.2%, was Carrabba’s. Management admits
that their 2014 menu revamp fell short and tells us to expect limited-time-offers until a new 2H15 menu.
However, there is a strong possibility that until a major segment re-haul, Carrabba’s will continue to offsetting
the positive cash flows from other business segments. Due to the continuing underperformance, we suggest
minimizing Carrabba’s’ domestic capital investments without changing the current international expansion
plans.
Lunch offerings may cannibalize dinner traffic.
Despite year-over-year increases in lunch traffic and management’s acknowledgment that some degree of
dinner traffic “cannibalization” is inevitable, they insist that it is not a major issue. We mostly agree, especially
since Carrabba’s needs as much foot traffic as possible.
Rising competition from other industries, such as grocery markets.
Carrabba’s management admits that major potential competition to the entire restaurant industry are grocery-
stores. The rising popularity of prepared grocery-store meals will likely continue to take business away from
Misc
Food
24%
Produce
12%
Breads &
Oils
7%
Dairy &
Cheese
8%
Shell &
Seafood
11%
Other
Meats
5%
Chicken
5%
Beef
28%
Food and Beverage Break-
down
Marketing
4%
G&A/Other
10%
Occupancy
13%
Utilities
3%
Fixed
Labor
18%
Restaurant,
Operating
Costs
7%
Restaurant,
Labor
12%
Food and
Beverage
33%
Cost Structure Break-down
Company Ticker Market Cap LTM EBITDA EV LTM EV/EBITDA LTM EBITDA/Sales
Bloomin' Brands BLMN 3.14B 425,870.00$ 4.41B 10.4 9.72%
Texas Roadhouse, Inc TXRH 2.42B 186,250.00$ 2.41B 12.9 12.02%
Darden Restaurants, Inc DRI 7.94B 642,600.00$ 8.83B 13.7 10.01%
Brinker International, Inc EAT 3.86B 431,460.00$ 4.69B 10.9 14.73%
Ruth's Hospitality Group RUTH 498.83M 49,470.00$ 525.35M 10.6 11.84%
Buffalo Wild Wings Inc BWLD 3.52B 235,770.00$ 3.42B 14.5 16.26%
The Cheesecake Factory Incorporated CAKE 2.49B 233,360.00$ 2.57B 11.0 11.97%
Famous Dave's of Ameirca DAVE 192.43M 19,140.00$ 203.66M 10.6 12.68%
Bravo Brio Restaurant Group, Inc BBRG 238.24M 39,120.00$ 252.31M 6.4 9.59%
Del Frisco's Restaurant Group, Inc DFRG 541.87M 41,090.00$ 546.77M 13.3 14.00%
BJ's Restaurant, Inc BJRI 1.27B 84,260.00$ 1.28B 15.2 10.13%
Mean 2.373 217,126.36$ 11.8 12.09%
Median 2.42 186,250.00$ 11.0 11.97%
10. F l o r i d a S t a t e U n i v e r s i t y P a g e | 10
casual restaurants (an estimated 7 million visits since 2009, or about 2% per year). Due to modern consumer
convenience preferences, this rate is expected to continue to rise.
Rising labor costs as a result of domestic minimum wage hikes.
This New Year saw more minimum wage hikes than ever before, with 20 states increasing their tipped-wage
rate on New Year’s Day, including Florida and California (Bloomin’ Brands’ biggest locations). Several major
west-coast cities such as Seattle and San Francisco have proposed legislation approaching $15/hr. Whether
these increases will materially affect long-term operating margins remains to be seen.
Risks associated with the South Korean economy.
The number of casual dining restaurants built in Korea has shot up by 88% over the last six years, and sales in
Korea’s over-saturated casual dining market dropped by more than 20% in 2Q14 alone.
Risks associated with the Brazilian economy.
Many analysts do not think Brazil’s short-term prospects are favorable. GDP grew a measly .1% in 3Q14,
following the 2Q14 contraction of .6% and 1Q14 contraction of .2% as a result of structural weaknesses,
ineffective expansionary policies and a new political cycle. Temporary jobs will continue being cancelled as the
re-elected government begins to implement fiscal adjustments, imposing additional pressures on the labor
market. However, Bloomin’ Inc. management remains confident amid these statistics due to low
unemployment and a culture which is focused on regularly eating at restaurants.
Beef prices, along with other commodity prices, may rise and squeeze operating margins.
Due to a severe drought three years ago, U.S beef prices have increased significantly over the past several years.
However, beef prices have started (and we predict will continue) to fall as the result of increasing wheat prices.
We calculate 1-year and 2-year correlations of -.82 and -.79, respectively, between beef and wheat prices and
argue that farmers slaughter more cattle during times of rising cattle food prices, causing beef prices to fall (see
Appendix: Figure-5).
Uncertainty Regarding Legal Disputes
Near end 4Q14, a federal court certified a nation-wide class action lawsuit affecting over 100K employees. The
suit addresses potential minimum wage and overtime payment violations. Proceedings such as class action
lawsuits are costly, consume management’s attention, and carry the possibility of large settlement costs.
Risks associated with a high debt capital structure.
BLMN has had a historically high debt capital structure which is more than double the debt capital structure
relative to industry peers (45.1% Market Value of Debt to MV of Capital versus the industry average of
21.7%) . This is often a cause for concern to investors and the firm. However, investors are not as concerned
as can be witnessed by the regression equity beta of 1.01 (highly significant at the 1% level) versus the current
bottom-up equity beta in our DCF of 1.41. The highly levered nature of Bloomin’ has increased debt
servicing and somewhat hindered their profitability in the past. In addition, the high leverage increases the
cost of equity, thereby making the hurdle rate for equity investors higher and less attainable. Despite the high
debt servicing relative to industry peers, S&P has rated Bloomin’ at a BB rating, implying a default spread of
4% in excess of the Risk Free 10-year treasury. Furthermore, management has consistently downsized its long
term debt in the last 4 years, showing their commitment towards the eventual industry average capital
structure, which will not only decrease earnings volatility and unpredictability, but give investors confidence
that management is behaving rationally.
11. F l o r i d a S t a t e U n i v e r s i t y P a g e | 11
Appendix
Figure-1: Diversified Brand Portfolio & Company Timeline
(International
locations)
Source: BLMN Investor Reports
Figure-2: LTM Sales by Concept
Source: BLMN Investor Reports
Figure-3: Customer Value Cycle
Source: BLMN Investor Reports
Brand Locations Position in Market
66 #4
227 #1/#2
753 #1
244 #2
201 #2
August
1987:
Outback
Steakhou
se Inc.
founded
and
incorpor
ated
June
1988:
First
Outback
retail
location
opens in
Florida
October
2006:
Bloomin'
Brands
founded
by Bain
Capital
and
others
June
2007:
Bloomin'
Brands
buys OSI
through
a
leverage
d buy
out
August
2012:
Bloomin'
Brands
goes
public
through
an Initial
Public
Offering
12. F l o r i d a S t a t e U n i v e r s i t y P a g e | 12
Figure-4: Porter Analysis
Threats of New Entrants (medium)
- Considerable initial investment for new market participants. Not only the
location will need a considerable amount of capital but also the marketing
strategy needs it.
- Brand recognition is an important liability for new participants
- Very easy access to distribution channels
- Government health regulations have to be met
- No legal barriers
- New firms will face economies of scale from big participants
Threat of Substitutes (high)
- Studies have shown that consumer decisions are based partly on
the location of the restaurant
- Many competitors with similar products and menus
- Brand differentiation is hard to accomplish
- Low Customer loyalty
- Consumer trends change extremely fast
- Home cooked meals and grocery store ready to eat menus
Competitive Rivalry (high)
- No dominant firm
- Many big size firms
- Hard to create
differentiation
- Profitability margins vary
due to heavy competition
Buyer Power
(medium)
- Switching to
other products
is simple
- Industry with
very elastic
demand
- Many small
buyers since
every household
close to a
location may be
considered a
potential client
- Low importance
and necessity as
a product for
buyers
Supplier Power (low)
- Supplier power
will depend
entirely on the
size of the
business they
work with
- Bigger firms will
be able to enact
economies of
scale and
centralized
supply chains
which greatly
reduce supplier
influence
13. F l o r i d a S t a t e U n i v e r s i t y P a g e | 13
Figure-5: Relationship Between Beef and Wheat Prices
Source: Indexmundi.com
Figure-6: Changing Costs, Expenses and Income
Source: BLMN 10-K
-10.00%
-5.00%
0.00%
5.00%
10.00%
15.00%
20.00%
Dec-12
Feb-13
Apr-13
Jun-13
Aug-13
Oct-13
Dec-13
Feb-14
Apr-14
Jun-14
Aug-14
Oct-14
Dec-14
Changes in Beef and
Wheat Price Over Time
Change in Wheat Change in Beef
150
200
250
300
350
Dec-12
Feb-13
Apr-13
Jun-13
Aug-13
Oct-13
Dec-13
Feb-14
Apr-14
Jun-14
Aug-14
Oct-14
Dec-14
Beef and Wheat Price Over
Time
Wheat Price
Beef Price
2 per. Mov. Avg. (Wheat Price)
2 per. Mov. Avg. (Beef Price)
(dollars in millions):
% of Restaurant sales % % 0.1 % % % 0.3 % % % 0.2 %
(dollars in millions):
% of Restaurant sales % % 0.0 % % % -0.5 % % % 0.0 %
(in millions):
General and administrative $ 268.9 $ 326.5 $ 326.5 $ 291.1 $ 291 $ 253
(dollars in millions):
Income from operations $ 225.4 $ 181.1 $ 181.1 $ 213.5 $ 213.5 $ 168.9
% of Total revenues % % 1 % % % -1 % % % 1 %
Cost of sales
2012 2011 Change 2011 2010 Change
YEARS ENDED YEARS ENDED
DECEMBER 31, DECEMBER 31,
Cost of sales $ 1,281.00$ 1,281.00
YEARS ENDED
32.5 32.2 32.2 32
$ 1,226.10 $ 1,152.00$ 1,226.10
2012 2011 Change 2011 2010 Change
YEARS ENDED YEARS ENDED
DECEMBER 31, DECEMBER 31,
Labor and other related $ 1,117.60$ 1,157.60
YEARS ENDED
12% 15%
DECEMBER 31,
2013 2012
28.3 28.8 28.8 28.8
$ 1,094.10 $ 1,034.40$ 1,094.10
4.5 5.6 5.6 4.7
-15%
DECEMBER 31, DECEMBER 31,
2012 2011 Change 2011 2010 Change
DECEMBER 31,
2013 2012
$ 1,333.80
26%
Labor and other related expenses
General and administrative expenses
Income from operations
2012 2011 Change 2011 2010 Change
YEARS ENDED
DECEMBER 31, DECEMBER 31,
YEARS ENDED
YEARS ENDED
DECEMBER 31,
2013 2012 Change
5.5 4.5
YEARS ENDED
DECEMBER 31,
2013 2012
YEARS ENDED
$ 1,117.60
28.3 28.3
32.6 32.5
YEARS ENDED
Change
24%
Change
-18%
Change
14. F l o r i d a S t a t e U n i v e r s i t y P a g e | 14
Figure-7: Base DCF Model/Sensitivity Analysis
Operating Scenario Base
1 Year 1 Year 2 Year 3 Year 4 Year 5
Mid-Year Convention Y Historical Period CAGR CAGR
2011 2012 2013 ('11 - '13) 2014 2015 2016 2017 2018 2019 ('15 - '19)
Sales $3,841.3 $3,987.8 $4,129.2 3.7% $4,420.0 $4,729.4 $5,060.5 $5,364.1 $5,578.6 $5,746.0 5.4%
% growth NA 3.8% 3.5% 7.0% 7.0% 7.0% 6.0% 4.0% 3.0%
Cost of Goods Sold 2,320.1 2,398.7 2,491.6 2,652.0 2,837.6 3,036.3 3,218.5 3,347.2 3,447.6
Gross Profit $1,521.1 $1,589.1 $1,637.7 3.8% $1,768.0 $1,891.8 $2,024.2 $2,145.6 $2,231.5 $2,298.4 5.4%
% margin 39.6% 39.9% 39.7% 40.0% 40.0% 40.0% 40.0% 40.0% 40.0%
Expenses Before Depreciation 1,162.3 1,284.9 1,232.6 1,360.4 1,455.6 1,557.5 1,650.9 1,717.0 1,768.5
EBITDA $358.8 $304.2 $405.0 6.2% $446.0 $436.2 $466.7 $494.7 $514.5 $529.9 3.5%
% margin 9.3% 7.6% 9.8% 10.09% 9.2% 9.2% 9.2% 9.2% 9.2%
Depreciation & Amortization 153.7 155.5 164.1 187.0 187.2 200.3 212.3 220.8 227.4
EBIT $205.1 $148.7 $240.9 8.4% $259.0 $249.0 $266.4 $282.4 $293.7 $302.5 3.2%
% margin 5.3% 3.7% 5.8% 5.9% 5.3% 5.3% 5.3% 5.3% 5.3%
Taxes 80.2 58.1 94.2 101.3 97.4 104.2 110.4 114.8 118.3
EBIAT $124.9 $90.6 $146.7 8.4% $157.7 $151.6 $162.2 $172.0 $178.9 $184.2 3.2%
Plus: Depreciation & Amortization 153.7 155.5 164.1 187.0 187.2 200.3 212.3 220.8 227.4
Less: Capital Expenditures (120.9) (178.7) (237.2) (253.9) (278.7) (298.2) (316.1) (250.0) (257.5)
% margin 3.1% 4.5% 5.7% 5.9% 5.9% 5.9% 4.5% 4.5%
Less: Inc./(Dec.) in Net Working Capital 94.1 41.0 37.6 26.6 20.7
Unlevered Free Cash Flow Free Cash Flow $154.3 $105.4 $105.9 $176.3 $174.9
$27.9 Dividends $30.0 $30.0 $30.0 $30.0 $30.0
Target WACC 7.57% 0.0% Dynamic WACC 7.43% 7.51% 7.56% 7.58% 7.57% 7.5%
Discount Period 0.5 1.5 2.5 3.5 4.5
Discount Factor 0.96 0.90 0.83 0.77 0.72
Present Value of Free Cash Flow $148.9 $94.6 $88.2 $136.5 $125.9
Enterprise Value Implied Perpetuity Growth Rate
Cumulative Present Value of FCF $594.1 Enterprise Value $5,361.4 Terminal Year Free Cash Flow (2019E) $174.9
Less: Total Debt (2,256.6) WACC 7.6%
Terminal Value Less: Preferred Stock - Terminal Value $6,867.9
Terminal Year EBITDA (2019E) $529.9 Less: Noncontrolling Interest -
Exit Multiple Method 12.96x Plus: Cash and Cash Equivalents 463.4 Implied Perpetuity Growth Rate 4.8%
Terminal Value $6,867.9
Discount Factor 0.69 Implied Equity Value $3,568.2 Implied EV/EBITDA
Present Value of Terminal Value $4,767.3 Enterprise Value $5,361.4
% of Enterprise Value 88.9% Fully Diluted Shares Outstanding 128.0 LTM 9/30/2013 EBITDA 446.0
Enterprise Value $5,361.4 Implied Share Price $27.88 Implied EV/EBITDA 12.0x
Enterprise Value Implied Perpetuity Growth Rate
Exit Multiple Exit Multiple
5,361.4 12.0x 12.5x 12.96x 13.5x 14.0x 0.0 12.0x 12.5x 12.96x 13.5x 14.0x
6.6% 5,204 5,397 5,589 5,782 5,975 6.6% 3.6% 3.7% 3.8% 3.9% 4.0%
7.1% 5,097 5,285 5,474 5,662 5,850 7.1% 4.1% 4.2% 4.3% 4.4% 4.5%
7.6% 4,994 5,177 $5,361 5,545 5,729 7.6% 4.6% 4.7% 4.8% 4.9% 5.0%
8.1% 4,893 5,072 5,252 5,432 5,612 8.1% 5.1% 5.2% 5.3% 5.4% 5.5%
8.6% 4,795 4,970 5,146 5,321 5,497 8.6% 5.5% 5.7% 5.8% 5.9% 6.0%
Assumptions
Sales (% growth) NA 3.8% 3.5% 7.0% 7.0% 7.0% 6.0% 4.0% 3.0%
COGS (% sales) 60.4% 60.2% 60.3% 60.0% 60.0% 60.0% 60.0% 60.0% 60.0%
Exp Before Deprec (% of sales) 30.3% 32.2% 29.9% 30.8% 30.8% 30.8% 30.8% 30.8% 30.8%
Depreciation & Amortization (% sales) 4.0% 3.9% 4.0% 4.2% 4.0% 4.0% 4.0% 4.0% 4.0%
Capital Expenditures (% sales) 3.1% 4.5% 5.7% 5.7% 5.9% 5.9% 5.9% 4.5% 4.5%
Tax Rate 39.1% 39.1% 39.1% 39.1% 39.1% 39.1% 39.1% 39.1% 39.1%
Working Capital (% sales) (12.4%) (12.4%) (12.4%) (12.4%) (12.4%)
Bloomin' Brands Inc
Sensitivity Analysis
($ in millions, fiscal year ending December 31)
Enterprise Value Implied Equity Value
Exit Multiple Exit Multiple
5,361.4 -1.0x -0.5x 0.0x 0.5x 1.0x 3,568.2 12.0x 12.5x 13.0x 13.5x 14.0x
-1.0% 37 315 594 873 1,151 5.4% 3,685 3,889 4,092 4,296 4,499
-0.5% 51 322 594 866 1,137 5.9% 3,571 3,770 3,968 4,167 4,366
0.0% 64 329 $594 859 1,124 6.4% 3,460 3,654 $3,848 4,042 4,236
0.5% 77 336 594 853 1,111 6.9% 3,352 3,542 3,731 3,921 4,110
1.0% 90 342 594 846 1,098 7.4% 3,247 3,432 3,617 3,803 3,988
Implied Perpetuity Growth Rate
Exit Multiple Exit Multiple
0.0 -1.0x -0.5x 0.0x 0.5x 1.0x 12.0 6.5x 7.0x 13.0x 13.5x 14.0x
-1.0% 47.4% 188.5% -100.0% -40.2% -25.5% -1.0% 9.5x 10.1x 10.1x 10.7x 12.0x
-0.5% 48.3% 191.4% -100.0% -40.0% -25.1% -0.5% 9.3x 9.9x 9.9x 10.5x 11.7x
0.0% 49.3% 194.3% -100.0% -39.8% -24.8% 0.0% 9.1x 9.6x 9.6x 10.2x 11.4x
0.5% 50.2% 197.2% -100.0% -39.5% -24.5% 0.5% 8.9x 9.4x 9.4x 10.0x 11.2x
1.0% 51.1% 200.1% -100.0% -39.3% -24.2% 1.0% 8.7x 9.2x 9.2x 9.8x 10.9x
PV of Terminal Value % of Enterprise Value
Exit Multiple
0.9 6.5x 7.0x 7.5x 8.0x 8.5x
6.6% 80.8% 82.0% 83.0% 83.8% 84.6%
7.1% 81.2% 82.3% 83.3% 84.2% 85.0%
7.6% 81.2% 82.3% 83.3% 84.2% 85.0%
8.1% 80.8% 82.0% 83.0% 83.8% 84.6%
8.6% 80.1% 81.3% 82.3% 83.2% 84.0%
WACC
WACC
WACC
Implied Enterprise Value / LTM EBITDA
WACC
WACC
WACC
WACC
Bloomin' Brands Inc
Discounted Cash Flow Analysis
($ in millions, fiscal year ending December 31)
Projection Period
Implied Equity Value and Share Price
15. F l o r i d a S t a t e U n i v e r s i t y P a g e | 15
Figure-8: Bull DCF Model/Sensitivity Analysis
Operating Scenario Base
1 Year 1 Year 2 Year 3 Year 4 Year 5
Mid-Year Convention Y Historical Period CAGR CAGR
2011 2012 2013 ('11 - '13) 2014 2015 2016 2017 2018 2019 ('15 - '19)
Sales $3,841.3 $3,987.8 $4,129.2 3.7% $4,420.0 $4,950.4 $5,544.4 $6,154.3 $6,646.7 $6,846.1 9.1%
% growth NA 3.8% 3.5% 7.0% 12.0% 12.0% 11.0% 8.0% 3.0%
Cost of Goods Sold 2,320.1 2,398.7 2,491.6 2,652.0 2,970.2 3,326.7 3,692.6 3,988.0 4,107.7
Gross Profit $1,521.1 $1,589.1 $1,637.7 3.8% $1,768.0 $1,980.2 $2,217.8 $2,461.7 $2,658.7 $2,738.4 9.1%
% margin 39.6% 39.9% 39.7% 40.0% 40.0% 40.0% 40.0% 40.0% 40.0%
Expenses Before Depreciation 1,162.3 1,284.9 1,232.6 1,360.4 1,523.6 1,706.4 1,894.1 2,045.7 2,107.1
EBITDA $358.8 $304.2 $405.0 6.2% $446.0 $456.6 $511.3 $567.6 $613.0 $631.4 7.2%
% margin 9.3% 7.6% 9.8% 10.09% 9.2% 9.2% 9.2% 9.2% 9.2%
Depreciation & Amortization 153.7 155.5 164.1 187.0 195.9 219.4 243.6 263.1 271.0
EBIT $205.1 $148.7 $240.9 8.4% $259.0 $260.6 $291.9 $324.0 $349.9 $360.4 6.8%
% margin 5.3% 3.7% 5.8% 5.9% 5.3% 5.3% 5.3% 5.3% 5.3%
Taxes 80.2 58.1 94.2 101.3 101.9 114.1 126.7 136.8 140.9
EBIAT $124.9 $90.6 $146.7 8.4% $157.7 $158.7 $177.8 $197.3 $213.1 $219.5 6.8%
Plus: Depreciation & Amortization 153.7 155.5 164.1 187.0 195.9 219.4 243.6 263.1 271.0
Less: Capital Expenditures (120.9) (178.7) (237.2) (253.9) (291.7) (326.7) (362.7) (297.9) (306.8)
% margin 3.1% 4.5% 5.7% 5.9% 5.9% 5.9% 4.5% 4.5%
Less: Inc./(Dec.) in Net Working Capital 121.5 73.6 75.6 61.0 24.7
Unlevered Free Cash Flow FCFF $184.5 $144.2 $153.9 $239.4 $208.4
Dividends $30.0 $30.0 $30.0 $30.0 $30.0
Target WACC 7.57% Dynamic WACC 7.43% 7.51% 7.56% 7.58% 7.57% 7.5%
Discount Period 0.5 1.5 2.5 3.5 4.5
Discount Factor 0.96 0.90 0.83 0.77 0.72
Present Value of Free Cash Flow $178.0 $129.3 $128.2 $185.3 $150.0
Enterprise Value Implied Perpetuity Growth Rate
Cumulative Present Value of FCF $771.0 Enterprise Value $6,450.9 Terminal Year Free Cash Flow (2019E) $208.4
Less: Total Debt (2,256.6) WACC 7.6%
Terminal Value Less: Preferred Stock - Terminal Value $8,182.7
Terminal Year EBITDA (2019E) $631.4 Less: Noncontrolling Interest -
EMM Method 12.96x Plus: Cash and Cash Equivalents 552.1 Implied Perpetuity Growth Rate 4.8%
Terminal Value $8,182.7
Discount Factor 0.69 Implied Equity Value $4,746.4 Implied EV/EBITDA
Present Value of Terminal Value $5,679.9 Enterprise Value $6,450.9
% of Enterprise Value 88.0% Fully Diluted Shares Outstanding 128.0 LTM 9/30/2012 EBITDA 446.0
Enterprise Value $6,450.9 Implied Share Price $37.08 Implied EV/EBITDA 14.5x
Enterprise Value Implied Perpetuity Growth Rate
Exit Multiple Exit Multiple
6,450.9 12.0x 12.5x 12.96x 13.5x 14.0x 0.0 12.0x 12.5x 12.96x 13.5x 14.0x
6.6% 6,264 6,494 6,724 6,953 7,183 6.6% 3.6% 3.7% 3.8% 3.9% 4.0%
7.1% 6,137 6,362 6,586 6,810 7,035 7.1% 4.1% 4.2% 4.3% 4.4% 4.5%
7.6% 6,014 6,233 $6,452 6,671 6,891 7.6% 4.6% 4.7% 4.8% 4.9% 5.0%
8.1% 5,894 6,108 6,322 6,536 6,750 8.1% 5.1% 5.2% 5.3% 5.4% 5.5%
8.6% 5,777 5,986 6,195 6,405 6,614 8.6% 5.5% 5.7% 5.8% 5.9% 6.0%
Assumptions
Sales (% growth) NA 3.8% 3.5% 7.0% 12.0% 12.0% 11.0% 8.0% 3.0%
COGS (% sales) 60.4% 60.2% 60.3% 60.0% 60.0% 60.0% 60.0% 60.0% 60.0%
Exp Before Deprec (% of sales) 30.3% 32.2% 29.9% 30.8% 30.8% 30.8% 30.8% 30.8% 30.8%
Depreciation & Amortization (% sales) 4.0% 3.9% 4.0% 4.2% 4.0% 4.0% 4.0% 4.0% 4.0%
Capital Expenditures (% sales) 3.1% 4.5% 5.7% 5.7% 5.9% 5.9% 5.9% 4.5% 4.5%
Tax Rate 39.1% 39.1% 39.1% 39.1% 39.1% 39.1% 39.1% 39.1% 39.1%
Working Capital (% sales) (12.4%) (12.4%) (12.4%) (12.4%) (12.4%)
Bloomin' Brands Inc
Sensitivity Analysis
($ in millions, fiscal year ending December 31)
Enterprise Value Implied Equity Value
Exit Multiple Exit Multiple
6,450.9 -1.0x -0.5x 0.0x 0.5x 1.0x 4,746.4 12.0x 12.5x 12.96x 13.5x 14.0x
-1.0% 107 439 771 1,103 1,435 5.8% 4,766 5,004 5,242 5,480 5,719
-0.5% 124 447 771 1,095 1,418 6.3% 4,633 4,865 5,098 5,331 5,564
0.0% 140 455 $771 1,087 1,402 6.8% 4,504 4,731 $4,958 5,186 5,413
0.5% 155 463 771 1,079 1,387 7.3% 4,378 4,600 4,822 5,044 5,266
1.0% 170 471 771 1,071 1,372 7.8% 4,256 4,473 4,690 4,907 5,124
Implied Perpetuity Growth Rate Implied Enterprise Value / LTM EBITDA
Exit Multiple Exit Multiple
0.0 -1.0x -0.5x 0.0x 0.5x 1.0x 14.5 6.5x 7.0x 12.96x 13.5x 14.0x
-1.0% 47.4% 188.5% -100.0% -40.2% -25.5% 5.8% 8.7x 9.2x 15.6x 16.1x 16.6x
-0.5% 48.3% 191.4% -100.0% -40.0% -25.1% 6.3% 8.5x 9.0x 15.3x 15.8x 16.3x
0.0% 49.3% 194.2% -100.0% -39.8% -24.8% 6.79% 8.4x 8.9x 14.9x 15.4x 16.0x
0.5% 50.2% 197.2% -100.0% -39.5% -24.5% 7.3% 8.2x 8.7x 14.6x 15.1x 15.6x
1.0% 51.1% 200.1% -100.0% -39.3% -24.2% 7.8% 8.1x 8.5x 14.3x 14.8x 15.3x
PV of Terminal Value % of Enterprise Value
Exit Multiple
0.9 12.0x 12.5x 13.0x 13.5x 14.0x
5.8% 88.1% 88.5% 88.9% 89.3% 89.6%
6.3% 87.8% 88.3% 88.7% 89.0% 89.4%
6.8% 87.6% 88.0% 88.4% 88.8% 89.2%
7.3% 87.3% 87.8% 88.2% 88.6% 88.9%
7.8% 87.1% 87.5% 87.9% 88.3% 88.7%
WACC
WACC
WACC
WACC
WACC
WACC
WACC
Bloomin' Brands Inc
Discounted Cash Flow Analysis
($ in millions, fiscal year ending December 31)
Projection Period
Implied Equity Value and Share Price
16. F l o r i d a S t a t e U n i v e r s i t y P a g e | 16
Figure-9: Bear DCF Model/Sensitivity Analysis
Operating Scenario Base
1 Year 1 Year 2 Year 3 Year 4 Year 5
Mid-Year Convention Y Historical Period CAGR CAGR
2011 2012 2013 ('11 - '13) 2014 2015 2016 2017 2018 2019 ('15 - '19)
Sales $3,841.3 $3,987.8 $4,129.2 3.7% $4,420.0 $4,420.0 $4,420.0 $4,420.0 $4,420.0 $4,420.0 0.0%
% growth NA 3.8% 3.5% 7.0% - - - - -
Cost of Goods Sold 2,320.1 2,398.7 2,491.6 2,652.0 2,652.0 2,652.0 2,652.0 2,652.0 2,652.0
Gross Profit $1,521.1 $1,589.1 $1,637.7 3.8% $1,768.0 $1,768.0 $1,768.0 $1,768.0 $1,768.0 $1,768.0 0.0%
% margin 39.6% 39.9% 39.7% 40.0% 40.0% 40.0% 40.0% 40.0% 40.0%
Expenses Before Depreciation 1,162.3 1,284.9 1,232.6 1,360.4 1,360.4 1,360.4 1,360.4 1,360.4 1,360.4
EBITDA $358.8 $304.2 $405.0 6.2% $446.0 $407.6 $407.6 $407.6 $407.6 $407.6 -1.8%
% margin 9.3% 7.6% 9.8% 10.09% 9.2% 9.2% 9.2% 9.2% 9.2%
Depreciation & Amortization 153.7 155.5 164.1 187.0 174.9 174.9 174.9 174.9 174.9
EBIT $205.1 $148.7 $240.9 8.4% $259.0 $232.7 $232.7 $232.7 $232.7 $232.7 -2.1%
% margin 5.3% 3.7% 5.8% 5.9% 5.3% 5.3% 5.3% 5.3% 5.3%
Taxes 80.2 58.1 94.2 101.3 91.0 91.0 91.0 91.0 91.0
EBIAT $124.9 $90.6 $146.7 8.4% $157.7 $141.7 $141.7 $141.7 $141.7 $141.7 -2.1%
Plus: Depreciation & Amortization 153.7 155.5 164.1 187.0 174.9 174.9 174.9 174.9 174.9
Less: Capital Expenditures (120.9) (178.7) (237.2) (253.9) (260.5) (260.5) (260.5) (198.1) (198.1)
% margin 3.1% 4.5% 5.7% 5.9% 5.9% 5.9% 4.5% 4.5%
Less: Inc./(Dec.) in Net Working Capital 55.8 (4.4) 4.4 - -
Unlevered Free Cash Flow FCFF $112.0 $51.8 $60.7 $118.6 $118.6
Dividends $30.0 $30.0 $30.0 $30.0 $30.0
Target WACC 7.57% Dynamic WACC 7.43% 7.51% 7.56% 7.58% 7.57% 7.5%
Discount Period 0.5 1.5 2.5 3.5 4.5
Discount Factor 0.96 0.90 0.83 0.77 0.72
Present Value of Free Cash Flow $108.1 $46.5 $50.5 $91.8 $85.4
Enterprise Value Implied Perpetuity Growth Rate
Cumulative Present Value of FCF $382.4 Enterprise Value $4,049.5 Terminal Year Free Cash Flow (2019E) $118.6
Less: Total Debt (2,256.6) WACC 7.6%
Terminal Value Less: Preferred Stock - Terminal Value $5,283.0
Terminal Year EBITDA (2019E) $407.6 Less: Noncontrolling Interest -
EMM Method 12.96x Plus: Cash and Cash Equivalents 356.5 Implied Perpetuity Growth Rate 5.1%
Terminal Value $5,283.0
Discount Factor 0.69 Implied Equity Value $2,149.3 Implied EV/EBITDA
Present Value of Terminal Value $3,667.1 Enterprise Value $4,049.5
% of Enterprise Value 90.6% Fully Diluted Shares Outstanding 128.0 LTM 9/30/2012 EBITDA 446.0
Enterprise Value $4,049.5 Implied Share Price $16.79 Implied EV/EBITDA 9.1x
Enterprise Value Implied Perpetuity Growth Rate
Exit Multiple Exit Multiple
4,049.5 12.0x 12.5x 12.96x 13.5x 14.0x 0.1 12.0x 12.5x 12.96x 13.5x 14.0x
6.6% 3,929 4,077 4,226 4,374 4,522 6.6% 4.0% 4.1% 4.2% 4.2% 4.3%
7.1% 3,847 3,992 4,137 4,282 4,426 7.1% 4.4% 4.5% 4.6% 4.7% 4.8%
7.6% 3,767 3,909 $4,050 4,192 4,333 7.6% 4.9% 5.0% 5.1% 5.2% 5.3%
8.1% 3,690 3,828 3,966 4,104 4,243 8.1% 5.4% 5.5% 5.6% 5.7% 5.8%
8.6% 3,614 3,749 3,884 4,020 4,155 8.6% 5.9% 6.0% 6.1% 6.2% 6.3%
Assumptions
Sales (% growth) NA 3.8% 3.5% 7.0% - % - % - % - % - %
COGS (% sales) 60.4% 60.2% 60.3% 60.0% 60.0% 60.0% 60.0% 60.0% 60.0%
Exp Before Deprec (% of sales) 30.3% 32.2% 29.9% 30.8% 30.8% 30.8% 30.8% 30.8% 30.8%
Depreciation & Amortization (% sales) 4.0% 3.9% 4.0% 4.2% 4.0% 4.0% 4.0% 4.0% 4.0%
Capital Expenditures (% sales) 3.1% 4.5% 5.7% 5.7% 5.9% 5.9% 5.9% 4.5% 4.5%
Tax Rate 39.1% 39.1% 39.1% 39.1% 39.1% 39.1% 39.1% 39.1% 39.1%
Working Capital (% sales) (12.4%) (12.3%) (12.4%) (12.4%) (12.4%)
Bloomin' Brands Inc
Sensitivity Analysis
($ in millions, fiscal year ending December 31)
Enterprise Value Implied Equity Value
Exit Multiple Exit Multiple
4,049.5 -1.0x -0.5x 0.0x 0.5x 1.0x 2,149.3 12.0x 12.5x 13.0x 13.5x 14.0x
-1.0% (46) 168 382 597 811 5.4% 2,239 2,396 2,552 2,709 2,865
-0.5% (36) 173 382 591 800 5.9% 2,151 2,304 2,457 2,610 2,763
0.0% (25) 179 $382 586 790 6.4% 2,066 2,215 $2,365 2,514 2,663
0.5% (15) 184 382 581 780 6.9% 1,983 2,129 2,275 2,421 2,566
1.0% (5) 188 382 576 770 7.4% 1,902 2,045 2,187 2,330 2,472
Implied Perpetuity Growth Rate Implied Enterprise Value / LTM EBITDA
Exit Multiple Exit Multiple
0.1 -1.0x -0.5x 0.0x 0.5x 1.0x 9.1 6.5x 7.0x 13.0x 13.5x 14.0x
-1.0% 39.3% 135.2% -100.0% -37.3% -23.2% -1.0% 7.1x 7.6x 7.6x 8.1x 9.0x
-0.5% 40.2% 137.2% -100.0% -37.0% -22.9% -0.5% 6.9x 7.4x 7.4x 7.9x 8.8x
0.0% 41.0% 139.2% -100.0% -36.8% -22.5% 0.0% 6.8x 7.3x 7.3x 7.7x 8.6x
0.5% 41.9% 141.2% -100.0% -36.5% -22.2% 0.5% 6.7x 7.1x 7.1x 7.5x 8.4x
1.0% 42.7% 143.3% -100.0% -36.3% -21.9% 1.0% 6.5x 6.9x 6.9x 7.4x 8.2x
PV of Terminal Value % of Enterprise Value
Exit Multiple
0.9 6.5x 7.0x 7.5x 8.0x 8.5x
6.6% 83.4% 84.4% 85.3% 86.1% 86.8%
7.1% 83.8% 84.7% 85.6% 86.4% 87.1%
7.6% 83.8% 84.7% 85.6% 86.4% 87.1%
8.1% 83.4% 84.4% 85.3% 86.1% 86.8%
8.6% 82.8% 83.8% 84.7% 85.5% 86.3%
WACC
WACC
WACC
WACC
WACC
WACC
WACC
Bloomin' Brands Inc
Discounted Cash Flow Analysis
($ in millions, fiscal year ending December 31)
Projection Period
Implied Equity Value and Share Price
17. F l o r i d a S t a t e U n i v e r s i t y P a g e | 17
Figure-10: Capex Break-down
Figure-11: Sequential Capex Analysis
Capex by Division
in millions 2011 2012 2013 2014E
Development/relocations 14 70-75 105-120 130-135
Remodels 49 60-65 60-65 60-65
IT 12 20-25 20-25 20-25
Maintenance/Other 46 50-55 35-40 30-35
Total Guided 121 200-220 220-250 215-235
Actual/Estimate 121 178 237 220
For the Fiscal Period Ending 12/31/2014 9/28/2014 6/29/2014 3/30/2014 12/31/2013 12/31/2013 9/30/2013 6/30/2013 3/31/2013 12/31/2012 12/31/2012 9/30/2012 6/30/2012 3/30/2012 12/31/2011
Capital expenditures (Total) (174,432) (97,619) (39,313) (237,214) (71,060) (166,154) (97,150) (40,950) (178,720) (44,554) (134,166) (79,743) (34,019) (120,906)
for the period (76,813) (58,306) (39,313) (237,214) (71,060) (69,004) (56,200) (40,950) (178,720) (44,554) (54,423) (45,724) (34,019) (120,906)
Revenues 1,065,454 1,110,912 1,157,859 4,129,230 1,050,555 967,569 1,018,856 1,092,250 3,987,795 998,387 952,916 980,866 1,055,626 3,841,264
CapEx as % of Rev 16.37% 8.79% 3.40% 5.74% 6.76% 17.17% 9.54% 3.75% 4.48% 4.46% 14.08% 8.13% 3.22% 3.15%
12%
40%
10%
38%
2011 Capital
Expenditure
Breakdown
Development/relocations
Remodels
IT
Maintenance/Other
34%
30%
11%
25%
2012 Capital
Expenditure
Breakdown
Development/relocations
Remodels
IT
Maintenance/Other
53%
25%
9%
13%
2014 Est. Capital
Expenditure
Breakdown
Development/relocations
Remodels
IT
Maintenance/Other
0.00%
20.00%
40.00%
50,000
100,000
150,000
200,000
250,000
1/1/2012 1/1/2013 1/1/2014
$ofCapExinthousands
Annual Capex Analysis
Capital Expenditures capex % rev
Capex ytd rate of change Revenue ytd growth
18. F l o r i d a S t a t e U n i v e r s i t y P a g e | 18
Figure-12: Balance Sheet
Balance Sheet
Balance sheet as of: 12/31/2014 9/28/2014 6/29/2014 3/30/2014 12/31/2013 12/31/2012
Assets
Cash and cash equivalents 144,671$ 155,843$ 172,604$ 209,871$ 261,690$
Current restricted cash equivalents 4,542 3,822 2,859 3,364 4,846
Inventories 64,748 65,337 66,799 80,613 78,181
Deferred income taxes 70,137 70,033 69,994 70,802 39,774
Assets held for sale 26,713
Other current assets, net 140,648 132,879 119,008 119,381 103,321
Total Current Assets 451,459 427,914 431,264 484,031 487,812
Restriced cash 26,265 25,892 25,042 25,055 15,243
PPE 1,640,198 1,652,326 1,626,988 1,634,130 1,506,035
Goodwill 359,167 353,086 346,424 346,253 270,972
Intangible assets 600,132 610,782 611,294 617,133 551,779
Deferred income tax assets 3,341 3,372 2,790 2,392 2,532
Other assets, net 153,750 160,707 164,988 165,180 182,180
Total Assets 3,234,312$ 3,234,079$ 3,208,790$ 3,274,174$ 3,016,553$
Liabilities
Accounts payable 200,268$ 188,278$ 176,911$ 164,619$ 131,814$
Accrued and other current liabilities 206,242 190,982 197,276 194,346 192,284
Partner obligations 10,670 9,268 10,174 12,548 14,771
Unearned revenue 226,914 249,322 261,251 359,443 329,518
Current long-term debt 40,751 22,328 11,997 13,546 22,991
Total Current Liabilities 684,845 660,178 657,609 744,502 691,378
Partner deposits and obligations 71,347 75,780 74,863 78,116 85,762
Deffered rent 118,299 114,743 108,098 105,963 87,641
Deffered tax liabilites 142,548 144,805 142,703 150,582 195,874
Long term debt 1,372,341 1,382,161 1,393,136 1,405,597 1,471,449
Other long-term liabiliies 250,495 253,896 280,104 284,721 264,244
Total Liabilities 2,639,875 2,631,563 2,656,513 2,769,481 2,796,348
Redeamable noncontrolling interests 24,525 23,043 22,101 21,984 -
Common stock 1,256 1,256 1,255 1,248 1,211
APIC 1,076,847 1,071,389 1,066,959 1,068,705 1,000,963
Retained earnings (497,342) (485,829) (511,902) (565,154) (773,085)
Accumulated other comprehensive income (15,935) (12,695) (31,783) (26,418) (14,801)
Noncontroling interests 5,086 5,352 5,647 4,328 5,917
Total shareholders equity 569,912 579,473 530,176 482,709 220,205
Total Liabilities and Equity 3,234,312$ 3,234,079$ 3,208,790$ 3,274,174$ 3,016,553$
19. F l o r i d a S t a t e U n i v e r s i t y P a g e | 19
Figure-13: Cash Flow Statement
Cash Flow
For the Fiscal Period Ending 12/31/2014 9/28/2014 6/29/2014 3/30/2014 12/31/2013 12/31/2012 12/31/2011
Net income 71,992$ 82,822$ 55,100$ 214,568$ 61,304$ 109,179$
Depreciation and amortization 143,542 94,792 46,165 164,094 155,482 153,689
Amortization of deferred financing fees 2,378 1,640 848 3,574 8,222 12,297
Amortization of capitalized gift card sales commissions 20,144 14,829 8,792 23,826 21,136 18,058
Depreciation & Amort, total 166,064$ 111,261$ 55,805$ 191,494$ 184,840$ 184,044$
Provision for impaired assets and restaurant closings 36,170 7,089 6,064 22,838 13,005 14,039
Accretion on debt discounts 1,589 1,097 568 2,451 880 663
Stock-based and other non-cash compensation expense 14,546 9,672 2,357 21,589 44,778 39,228
Income from operations of unconsolidated affiliates - - - (7,730) (5,450) (8,109)
Deferred income tax benefit (1,687) (372) (876) (83,603) (7,442) (175)
Loss on disposal of property, fixtures and equipment 1,548 1,077 436 1,441 2,141 1,987
Gain on life insurance and restricted cash investments (1,305) (1,732) (362) (5,284) (5,150) (126)
Loss on extinguishment and modification of debt 11,092 11,092 14,586 20,957 -
Other gains relating to sale of business (36,608) (3,500) (28,819)
Deferred gain on sale-leaseback (1,605) (1,070) (535) (2,135) (1,610) -
Excess tax benefits from stock-based compensation (1,067) (1,095) (1,221) (4,363) - -
Change in assets and liabilities:
Decrease in inventories 14,707 15,724 13,788 3,768 (8,577) (10,525)
Increase in other current assets (34,489) (25,212) (7,463) (28,336) (13,746) (60,858)
Decrease (increase) in other assets 6,141 5,320 2,591 (259) 4,034 8,209
Decrease in accounts payable and current liab (2,059) (11,440) 11,957 10,192 4,687 32,875
Increase in deferred rent 14,969 8,482 2,080 20,618 17,064 12,510
Decrease in unearned revenue (134,545) (110,392) (98,214) 29,634 29,621 30,623
Decrease in other long-term liabilities (2,513) (5,077) (2,248) 12,403 2,255 (2,295)
Cash from Operations 159,548 97,246 39,827 377,264 340,091 322,450
Capital expenditures (174,432) (97,619) (39,313) (237,214) (178,720) (120,906)
Purchases of life insurance policies (1,682) 627 627 (4,159) (6,451) (2,027)
Sale of life insurance policies 627 562 105 1,239 - 2,638
Proceeds from PPE 4,070 (3,063) (3,063) 3,223 4,529 2,150
Sale-leaseback transaction - 192,886 -
Acquisition of business, net of cash acquired (3,063) (1,040) (520) (100,319) 3,500 1,572
Decrease in restricted cash 19,612 13,556 5,514 29,210 84,270 86,579
Increase in restricted cash (21,150) (14,192) (5,105) (38,117) (80,070) (83,148)
Cash from Investing (176,018)$ (101,169)$ (41,755)$ (346,137)$ 19,944$ (113,142)$
Proceeds Loan B & CMBS 1,485,186$
Senior secured Term loan A 297,088$ 297,088$
Extinguishment an of senior secured term loan (700,000) (700,000) - (1,004,575) -
Repayments of long-term debt (25,159) (18,090) (14,578)$ (80,805) (46,868) (25,189)
Proceeds from borrowings on revolving credit facilities 474,500 415,000 100,000 111,000 33,000
Repayments of borrowings on revolving credit facilities (59,500) (15,000) (100,000) (144,000) (78,072)
Financing fees (4,492) (4,492) (12,519) (18,983) (2,222)
Proceeds from the exercise of stock options 7,042 6,476 5,974 27,786 884 -
Distributions to noncontrolling interests (3,331) (2,470) (1,167) (8,059) (13,977) (13,088)
Purchase of limited partnership interests (17,211) (17,211) (17,211) - (40,582) -
Partner deposits and accrued partner obligations (17,603) (13,909) (7,388) (23,286) (25,397) (35,950)
Repayments of notes receivable due from stockholders - - - - (587) (1,082)
Repurchase of common stock (869) (799) (481) (436) - -
Excess tax benefits from stock-based compensation 1,067 1,095 1,221 4,363 - -
Tax withholding on performance-based share units (400) (364) (324)
Other proceeds/extinguish from initial offering and debt, net 5,829 (888,320) 33,303
Cash from Financing (48,868) (52,676) (33,954) (87,127) (586,219) (89,300)
Forex rate changes on cash 138 2,571 (1,385) 4,181 5,790 (3,460)
Net Change in Cash (65,200) (54,028) (37,267) (51,819) (220,394) 116,548
FCF1 (CFO-Capex) (14,884)$ 96,206$ 39,307$ 276,945$ 343,591$ 324,022$
FCF2 (NI+ D&A - CapEX 63,624$ 193,043$ 110,385$ 305,743$ 249,644$ 294,795$
20. F l o r i d a S t a t e U n i v e r s i t y P a g e | 20
Figure-14: Free Cash Flows
Source: Bloomin’ Q3 Investor Conference
Figure-15: Updated Q3 Results
Source: Bloomin’ Q3 Investor Conference
Figure-16: Margin Improvement
Source: Bloomin’ Q3 Investor Conference
21. F l o r i d a S t a t e U n i v e r s i t y P a g e | 21
Figure-17: Operational Growth
Source: Bloomin’ Q3 Investor Conference
Figure-18: Comp Sales vs. KNAPP Track
Source: Bloomin’ Q3 Investor Conference
22. F l o r i d a S t a t e U n i v e r s i t y P a g e | 22
Figure-19: Growth in Comp Sales & Profitability vs. KNAPP
Source: Bloomin’ Q3 Investor Conference
Figure-20: Growth in Comp Sales: Lunch
Source: Bloomin’ Q3 Investor Conference