SlideShare une entreprise Scribd logo
1  sur  8
Télécharger pour lire hors ligne
Click here for authors’ contact information.
Priced (in USD) as of 11/16/17 market close, EST (unless otherwise stated).
For important disclosures and required non-U.S. analyst disclosures, see page 6.
Every yield curve has a story to tell, and there has been no
shortage of market commentary over the past week looking
to tell the story of the flattest yield curve that we have seen
during an economic expansion since 2005, when the Fed was
in the midst of another monetary policy tightening cycle.
The yield curve, commonly measured as the yield difference
between the 10Y Treasury and the 2Y Treasury, has long been
seen as an economic growth barometer and as a key business
cycle indicator, with inversions often portending a U.S.
recession. Its track record isn’t perfect—no economic indicator
is—but a flattening curve is once again capturing headlines
and the concern of investors.
As the chart shows, the curve has flattened to just 66 basis
points (bps). The New York Fed’s model of recession risk within
12 months based on the flatness of the curve has risen to 10%,
the highest we have seen this cycle. The past three recessions
were led by inverted yield curves, and while we believe we
remain a long way off from an inverted curve, we think this
topic deserves all of the attention it has received recently.
Yield curve drivers
Is this flattening yield curve a sign of the market’s growth
concerns with a 10Y yield of just 2.35%? Is it a sign that the
Fed is being too aggressive as the 2Y Treasury has added 40
bps in just two months, jumping to 1.70%? Is the yield curve
even relevant following all of the extraordinary measures put
in place by global central banks since the financial crisis that
may be suppressing yields? While central bank policies may
be muddying the waters, we still see the curve as a key signal
and representative of modest growth and low inflation risk,
mixed with a view that the Fed may be taking too aggressive of
a stance at the moment.
Dangerous curves ahead?
Tom Garretson – Minneapolis
November 16, 2017
A closer look
A flat U.S. Treasury yield curve flattened further this week, falling to the lowest levels seen during an
economic expansion since 2005. But does a flat yield curve portend an economic slowdown, or are other
factors at play?
R B C W E A L T H M A N A G E M E N T
Global InsightW e e k l y
3 	 U.S. high-yield bond selloff skewed to a few corners
3 	 How to upgrade quality in Canadian fixed income
3 	 Good macroeconomic news rolls in from Europe
4	 Chinese housing market cools
Market pulse
Source - RBC Wealth Management, Bloomberg; data as of 11/16/17
Recession risks rise as yield curves fall
66 bps
0%
5%
10%
15%
20%
25%
30%
35%
40%
45%
50%
-100 bps
-50 bps
0 bps
50 bps
100 bps
150 bps
200 bps
250 bps
300 bps
'86
'88
'90
'92
'94
'96
'98
'00
'02
'04
'06
'08
'10
'12
'14
'16
U.S. recession
New York Fed recession probability (right axis)
Yield curve: 10Y minus 2Y (left axis)
2 | Global Insight Weekly
November 16, 2017 | RBC Wealth Management
Since the Fed began raising short-term rates in December 2015,
boosting short-term rates by 100 bps with another 25 bps hike
due in December, the U.S. 10Y Treasury has gained precisely …
5 bps. The New York Fed also maintains a model that breaks the
10Y down into two key components, the risk-neutral yield and
a term premium. The former is simply the expected average
of short-term rates over 10 years priced into the 10Y, while the
term premium is the compensation investors are receiving for
the risk that short-term rates could deviate from expectations.
While a purely academic exercise, it can be useful as a thought
exercise when trying to understand yield curve dynamics.
As the upper chart shows, the expected average short-term
rate priced into the 10Y has risen along with rate hikes. But
this has been almost completely offset by a decline in the term
premium, which is now negative—meaning that investors are
confident that short-term rates won’t rise faster or higher than
expected. A simple explanation would be that each rate hike
brings us one rate hike closer to the next rate cut.
We expect this dynamic to continue to play out with those two
factors offsetting each other to keep the 10Y yield range-bound
around current levels. This long trend of curve flattening
should continue, in our view, as Fed rate hikes continue at
a slow and steady pace, with little upside risk to growth and
inflation keeping a lid on 10Y yields below 3%.
Diagnosis doesn’t matter, prescription is the same
Regardless of what is driving a flatter yield curve, the
prescription is the same: the Fed will likely have to keep a light
hand on the rate hike throttle. With a yield curve spread of just
66 bps between 2Y and 10Y Treasuries, the cushion is roughly
just three 25 bps rate hikes before the Fed risks inverting the
curve—assuming the 10Y maintains current levels. With few
signs of overheating sectors in the economy and low inflation,
we think the Fed has room to be cautious and it will be a slow
rate hike pace rather than a higher 10Y that keeps the yield
curve steep over the near term.
Stay the course—for now
We would caution against looking to past Fed tightening
cycles to guide asset class performance going forward—there
simply haven’t been enough to draw statistically significant
conclusions from. But the lower chart shows relative
performance of major asset classes for the past two cycles.
We expect the current one to play out like the 1990s, when the
Fed raised rates quickly early in the decade, paused for nearly
three years as inflationary pressures eased, before resuming
hikes into the 2001 recession. Even as the curve flattens toward
0 bps, we would still expect equities to outperform bonds,
Financials to outperform the S&P 500, and for long duration to
modestly outperform short duration.
For now we think investors can maintain the playbook that has
worked to this point, but the yield curve remains an important
signal and merits all of the scrutiny that it is receiving.
Source - RBC Wealth Management, Bloomberg; data as of 11/16/17
Relative performance over past two flattening cycles
5%
8%
28%
15%
-1%
5% 5%
-4%
-10%
-5%
0%
5%
10%
15%
20%
25%
30%
Duration:
Longvs.Short
Creditrisk:
HYvs.IG
Financialsvs.
S&P500
Growthvs.Value
Duration:
Longvs.Short
Creditrisk:
HYvs.IG
Financialsvs.
S&P500
Growthvs.Value
Bonds Equities Bonds Equities
March '96 to June '98 April '05 to February '06
Periods when yield curve (10Y yield minus 2Y yield)
flattened from 65 bps to 0 bps
Source - RBC Wealth Management, Bloomberg; data through 11/14/17
Why the curve is flat: Decomposing the 10Y Treasury yield
-1.0%
-0.5%
0.0%
0.5%
1.0%
1.5%
2.0%
2.5%
3.0%
Sep'15
Dec'15
Mar'16
Jun'16
Sep'16
Dec'16
Mar'17
Jun'17
Sep'17
U.S. 10Y Treasury yield
Term premium
Expected average short-term rate
Fed funds rate
3 | Global Insight Weekly
November 16, 2017 | RBC Wealth Management
United States
Bill Kuehn & Sam Renikoff – Minneapolis
•	 High-yield bonds have sold off in 12 of the last 16 days,
according to the Bloomberg Barclays High Yield Index,
with spreads widening as much as 42 basis points (bps)
in the last three weeks. A litany of factors has roiled
the riskiest corner of the market, including a string of
poor earnings reports and rating downgrades, recession
concerns, and disputes over tax reform. The high-yield
market has already had its worst month of the year,
returning -1.31%, wiping out the prior two months’
returns.
•	 While bonds are noticeably down across the market, the
extent of the selloff appears to be skewed toward a few
specific corners. B-rated credits have seen the brunt of
the selling pressure, where spreads have widened out
55 bps vs. 40 for CCC credits and 30 for BB credits. The
largest underperformers were B-rated Telecom credits—
by and large the worst-performing sector with spreads
23% wider over the last three weeks relative to just 12%
for the average sector ex-Telecom. With this skewness in
mind, we maintain our Underweight recommendation
on high yield, where yields are still 100 bps lower than the
5-year average, while credits rated BBB and better look
historically attractive.
•	 Equity markets have also taken notice of the flatter yield
curve, with the S&P 500 pulling back 1.2% as concerns
mounted, but later bouncing back on positive corporate
news and passage of tax cut legislation in the House of
Representatives. While changes in the yield curve should
be monitored closely, our analysis of historical data shows
that equities can continue to provide positive returns in
a flattening yield curve environment, especially when the
flattening is not accompanied by elevated recession risks.
Canada
Diana Di Luca – Toronto
•	 Bank of Canada (BoC) Senior Deputy Governor Carolyn
Wilkins, speaking in New York on November 15, reiterated
the most recent BoC message—monetary policy changes
(e.g., rate increases) will likely be slow and gradual. Wilkins
also discussed NAFTA’s impact on business investment
and said that the uncertainty surrounding NAFTA is clearly
affecting businesses and potential investment decisions.
Interest rate expectations have been unchanged following
her comments, with the market pricing in an approximate
40% chance the next hike will occur in January and an
April hike is fully priced in.
•	 The recent weakness in the high-yield market has paid
off for investors who upgraded quality earlier this year, and
we continue to think this is a strategy that can improve
relative performance for Canadian fixed income investors.
The move higher in rates since early June means that
high-quality credit has been paying progressively higher
yields and, despite the recent selloff in lower-rated bonds,
the yield pick-up to own a riskier bond remains near the
lowest level in nearly a decade. One of the easiest trades
investors can look at to upgrade quality is actually in their
government bond holdings, where lower-rated provincial
bonds can be swapped into higher-rated federal bonds.
•	 The TSX Preferred Share Index rose to a fresh year-to-
date high during the week, and is trading at its highest
level since July 2015. The preferred share market has been
resilient despite an 8 basis point decline in the 5-year
Government of Canada yield over the past month. We
continue to favour a mix of heavily discounted rate resets,
perpetual issues, and rate resets with large reset spreads.
Eu ro pe
Frédérique Carrier & Thomas McGarrity – London
•	 The STOXX Europe 600 Index was down some 2% during
the week, as investors looked to lock in gains after a
strong performance year to date. This profit-taking streak
has been the longest since autumn 2016, and mining and
energy in particular bore the brunt of the move, as they
responded to weaker-than-expected growth in China and
lower energy prices, respectively.
Source - RBC Wealth Management, Bloomberg; data through 11/15/17
B-rated credits lead the high-yield selloff
-5%
0%
5%
10%
15%
20%
Oct20'17
Oct27'17
Nov03'17
Nov10'17
%Netspreadchange(1-month)
BB index
B index
CCC index
4 | Global Insight Weekly
November 16, 2017 | RBC Wealth Management
•	 Equities also took their cue from fixed income where
high-yield spreads backed up. In Europe, we had
highlighted for a while that high-yield spreads did not
reflect underlying risk. The recent widening of high-yield
spreads has made valuations slightly more attractive;
however, these spreads remain at historically tight levels.
•	 Good macroeconomic news continued to roll in from
Europe, with German Q3 GDP exceeding consensus
expectations at 0.8% q/q and 2.8% y/y, while in Italy GDP
reached 0.5% q/q and 1.8% y/y. In both instances, these
annual growth levels have not been seen since 2011.
Overall eurozone Q3 GDP rose 2.5% y/y, with inflation
stable at 1.4% y/y in October.
•	 In the U.K., the September unemployment rate held
steady at 4.3%, the lowest level in more than 40 years.
Average weekly earnings remained relatively subdued at
2.2% y/y. RBC economists pointed to an actual fall in
employment in the three months to September relative
to the previous three months. 14,000 jobs were lost in
Q3, the worst loss since 2015. While they caution against
reading too much into one data point, it is, nevertheless,
something to watch carefully.
•	 The U.K. Consumer Price Index came in slightly below
consensus expectations and core annual inflation
remained stable at 2.7% y/y, a level that has been
maintained for three consecutive months. Clients who
follow housing prices in the U.K. will have noticed that
the Rightmove House Price Index suggests a 1.8% y/y
increase in November at the national level, but a 2.4% y/y
fall in London, the third consecutive month prices have
fallen.
Asia Pacific
Jay Roberts – Hong Kong
•	 Chinese markets wobbled in midweek on concerns of
deleveraging in the country, with the 10-year government
bond yield going over 4% for the first time in three
years. Ripples were also felt in commodity markets.
Economic data, such as industrial production, was also a
little weaker in October. The value of new home sales in
China in October declined by 3.4% to RMB 909B ($137B),
the largest drop in nearly three years. Measures to
cool property markets in localities with excessive price
appreciation have been in place for quite a while.
•	 	Any further softness in Chinese economic data would
likely present a headwind for Asian equities, which have
performed extremely well in 2017.
•	 Chinese internet giant Tencent (700 HK) posted yet
another set of quarterly results that beat expectations.
Tencent, which dominates in China in areas such as
messaging, social networking, and online gaming, posted
Q3 revenue growth of 61% y/y to RMB 65.2B ($9.83B),
above forecast and boosted by the extremely popular game
Honour of Kings. Net income of RMB 18B ($2.71B) rose
by 69% y/y (forecast: RMB 15.8B). The stock gained 2.3%
in Hong Kong. The relatively small gain in the stock in
spite of the supercharged growth rates is a reflection of
the fact that it had already doubled in value in 2017 to
become one of the world’s largest internet companies by
market capitalization.
•	 The stock of AIA Group (1299 HK), one of Asia’s largest
life insurance companies, jumped higher in Hong Kong
on news that China will relax the limits on foreign
ownership in various areas of financial services. For
life insurance companies, the ownership limit of foreign
companies in China will be lifted to 51% from 50% in
three years, thereby giving foreign firms the potential to
have a controlling interest. The restriction will be entirely
lifted after five years. No such foreign ownership limit is in
place for foreign non-life insurance companies operating
in China. Ironically, AIA Group is the only foreign life
insurance company that is currently allowed to wholly
own its China unit as a result of negotiations when China
joined the WTO in 2001.
Source - RBC Wealth Management, Bloomberg; data through 11/16/17
Government intervention and rising yields cool Chinese
housing market
2.5%
2.7%
2.9%
3.1%
3.3%
3.5%
3.7%
3.9%
4.1%
4.3%
-10%
0%
10%
20%
30%
40%
50%
60%
70%
Sep'14
Sep'15
Sep'16
Sep'17
New home sales value (left axis)
China 10Y yield (right axis)
5 | Global Insight Weekly
November 16, 2017 | RBC Wealth Management
Data as of November 16, 2017
Source - Bloomberg. Note: Equity returns do not include dividends, except for the German DAX and Brazilian Ibovespa. Bond yields in local currencies. Copper
Index data and U.S. fixed income returns as of Wednesday’s close. Dollar Index measures USD vs. six major currencies. Currency rates reflect market convention
(CAD/USD is the exception). Currency returns quoted in terms of the first currency in each pairing. Data as of 8:36 pm GMT 11/16/17.
Examples of how to interpret currency data: CAD/USD 0.78 means 1 Canadian dollar will buy 0.78 U.S. dollar. CAD/USD 5.4% return means the Canadian dollar
rose 5.4% vs. the U.S. dollar year to date. USD/JPY 113.03 means 1 U.S. dollar will buy 113.03 yen. USD/JPY -3.4% return means the U.S. dollar fell 3.4% vs. the
yen year to date.
Commodities (USD) Price MTD YTD 1 yr 2 yr
Gold (spot $/oz) 1,278.58 0.6% 11.0% 4.4% 18.1%
Silver (spot $/oz) 17.08 2.2% 7.3% 0.6% 19.9%
Copper ($/metric ton) 6,736.25 -1.2% 22.0% 24.2% 43.5%
Oil (WTI spot/bbl) 55.14 1.4% 2.6% 21.0% 32.1%
Oil (Brent spot/bbl) 61.36 0.0% 8.0% 31.6% 37.7%
Natural Gas ($/mmBtu) 3.08 6.2% -17.4% 11.3% 29.0%
Govt bonds (bps chg) Yield MTD YTD 1 yr 2 yr
U.S. 10-Yr Tsy 2.372% -0.8 -7.3 14.9 10.4
Canada 10-Yr 1.972% 2.1 25.1 46.5 32.2
U.K. 10-Yr 1.309% -2.3 7.0 -7.4 -63.0
Germany 10-Yr 0.376% 1.3 16.8 7.9 -15.4
Fixed Income (returns) Yield MTD YTD 1 yr 2 yr
U.S. Aggregate 2.64% 0.1% 3.3% 2.8% 6.0%
U.S. Invest Grade Corp 3.25% -0.3% 5.3% 5.3% 11.5%
U.S. High Yield Corp 5.97% -1.3% 6.0% 8.9% 20.7%
Currencies Rate MTD YTD 1 yr 2 yr
U.S. Dollar Index 93.9070 -0.7% -8.1% -6.5% -5.6%
CAD/USD 0.7840 1.1% 5.4% 5.4% 4.5%
USD/CAD 1.2756 -1.0% -5.1% -5.1% -4.3%
EUR/USD 1.1771 1.1% 11.9% 10.1% 10.2%
GBP/USD 1.3193 -0.7% 6.9% 6.0% -13.2%
AUD/USD 0.7590 -0.9% 5.3% 1.5% 7.0%
USD/JPY 113.0300 -0.5% -3.4% 3.6% -8.2%
EUR/JPY 133.0600 0.5% 8.2% 14.1% 1.1%
EUR/GBP 0.8922 1.8% 4.5% 3.8% 26.9%
EUR/CHF 1.1700 0.7% 9.1% 9.2% 8.4%
USD/SGD 1.3562 -0.5% -6.3% -4.2% -4.7%
USD/CNY 6.6303 -0.1% -4.5% -3.6% 4.1%
USD/MXN 19.0470 -0.5% -8.1% -5.7% 13.6%
USD/BRL 3.2775 0.2% 0.7% -4.3% -14.2%
MARKET SCORECARD
Equities (local currency) Level MTD YTD 1 yr 2 yr
S&P 500 2,585.64 0.4% 15.5% 18.8% 25.9%
Dow Industrials (DJIA) 23,458.36 0.3% 18.7% 24.3% 34.2%
NASDAQ 6,793.29 1.0% 26.2% 28.3% 36.3%
Russell 2000 1,486.88 -1.1% 9.6% 14.2% 28.6%
S&P/TSX Comp 15,935.37 -0.6% 4.2% 8.2% 19.7%
FTSE All-Share 4,056.40 -1.5% 4.7% 10.4% 20.0%
STOXX Europe 600 384.93 -2.6% 6.5% 13.7% 3.9%
EURO STOXX 50 3,564.80 -3.0% 8.3% 17.8% 6.0%
Hang Seng 29,018.76 2.7% 31.9% 30.2% 31.8%
Shanghai Comp 3,399.25 0.2% 9.5% 6.1% -5.8%
Nikkei 225 22,351.12 1.5% 16.9% 25.1% 15.2%
India Sensex 33,106.82 -0.3% 24.3% 25.9% 28.5%
Singapore Straits Times 3,341.30 -1.0% 16.0% 19.6% 14.6%
Brazil Ibovespa 72,511.79 -2.4% 20.4% 19.3% 54.8%
Mexican Bolsa IPC 47,747.69 -1.8% 4.6% 6.3% 9.5%
6 | Global Insight Weekly
November 16, 2017 | RBC Wealth Management
Authors
Analyst Certification
All of the views expressed in this report accurately reflect the
personal views of the responsible analyst(s) about any and all
of the subject securities or issuers. No part of the compensation
of the responsible analyst(s) named herein is, or will be, directly
or indirectly, related to the specific recommendations or views
expressed by the responsible analyst(s) in this report.
Important Disclosures
In the U.S., RBC Wealth Management operates as a division of RBC
Capital Markets, LLC. In Canada, RBC Wealth Management includes,
without limitation, RBC Dominion Securities Inc., which is a foreign
affiliate of RBC Capital Markets, LLC. This report has been prepared
by RBC Capital Markets, LLC. which is an indirect wholly-owned
subsidiary of the Royal Bank of Canada and, as such, is a related
issuer of Royal Bank of Canada.
Non-U.S. Analyst Disclosure: Diana Di Luca and Jay Roberts, employees
of RBC Wealth Management USA’s foreign affiliate RBC Dominion
Securities Inc.; and Frédérique Carrier and Thomas McGarrity,
employees of RBC Wealth Management USA’s foreign affiliate Royal
Bank of Canada Investment Management (U.K.) Limited; contributed
to the preparation of this publication. These individuals are not
registered with or qualified as research analysts with the U.S.
Financial Industry Regulatory Authority (“FINRA”) and, since they are
not associated persons of RBC Wealth Management, they may not be
subject to FINRA Rule 2241 governing communications with subject
companies, the making of public appearances, and the trading of
securities in accounts held by research analysts.
In the event that this is a compendium report (covers six or more
companies), RBC Wealth Management may choose to provide
important disclosure information by reference. To access current
Tom Garretson, CFA – Minneapolis, United States
tom.garretson@rbc.com; RBCCapital Markets, LLC
Bill Kuehn – Minneapolis, United States
william.kuehn@rbc.com; RBCCapital Markets, LLC
Sam Renikoff – Minneapolis, United States
sam.renikoff@rbc.com; RBCCapital Markets, LLC
Diana Di Luca – Toronto, Canada
diana.diluca@rbc.com; RBC Dominion Securities Inc.
Frédérique Carrier – London, United Kingdom
frederique.carrier@rbc.com; Royal Bank of Canada Investment Management (U.K.) Ltd.
Thomas McGarrity, CFA – London, United Kingdom
thomas.mcgarrity@rbc.com; Royal Bank of Canada Investment Management (U.K.) Ltd.
Jay Roberts – Hong Kong, China
jay.roberts@rbc.com; RBC Dominion Securities Inc.
D isclosures and Disclaimer
disclosures, clients should refer to http://www.rbccm.com/
GLDisclosure/PublicWeb/DisclosureLookup.aspx?EntityID=2 to view
disclosures regarding RBC Wealth Management and its affiliated
firms. Such information is also available upon request to RBC Wealth
Management Publishing, 60 South Sixth St, Minneapolis, MN 55402.
References to a Recommended List in the recommendation history
chart may include one or more recommended lists or model
portfolios maintained by RBC Wealth Management or one of its
affiliates. RBC Wealth Management recommended lists include the
Guided Portfolio: Prime Income (RL 6), the Guided Portfolio: Dividend
Growth (RL 8), the Guided Portfolio: ADR (RL 10), and the Guided
Portfolio: All Cap Growth (RL 12), and former lists called the Guided
Portfolio: Large Cap (RL 7), the Guided Portfolio: Midcap 111 (RL 9),
and the Guided Portfolio: Global Equity (U.S.) (RL 11). RBC Capital
Markets recommended lists include the Strategy Focus List and the
Fundamental Equity Weightings (FEW) portfolios. The abbreviation
‘RL On’ means the date a security was placed on a Recommended
List. The abbreviation ‘RL Off’ means the date a security was removed
from a Recommended List.
Distribution of Ratings
For the purpose of ratings distributions, regulatory rules require
member firms to assign ratings to one of three rating categories
- Buy, Hold/Neutral, or Sell - regardless of a firm’s own rating
categories. Although RBC Capital Markets, LLC ratings of Top Pick
(TP)/Outperform (O), Sector Perform (SP) and Underperform (U) most
closely correspond to Buy, Hold/Neutral and Sell, respectively, the
meanings are not the same because our ratings are determined on a
relative basis (as described below).
Explanation of RBC Capital Markets, LLC Equity Rating System
An analyst’s “sector” is the universe of companies for which the
analyst provides research coverage. Accordingly, the rating assigned
to a particular stock represents solely the analyst’s view of how that
stock will perform over the next 12 months relative to the analyst’s
sector average. Although RBC Capital Markets, LLC ratings of Top Pick
(TP)/Outperform (O), Sector Perform (SP), and Underperform (U) most
closely correspond to Buy, Hold/Neutral and Sell, respectively, the
meanings are not the same because our ratings are determined on a
relative basis (as described below).
Ratings:
Top Pick (TP): Represents analyst’s best idea in the sector; expected
to provide significant absolute total return over 12 months with a
favorable risk-reward ratio. Outperform (O): Expected to materially
outperform sector average over 12 months. Sector Perform (SP):
Returns expected to be in line with sector average over 12 months.
Underperform (U): Returns expected to be materially below sector
average over 12 months.
As of September 30, 2017
Rating Count Percent Count Percent
Buy [Top Pick & Outperform] 859 52.92 294 34.23
Hold [Sector Perform] 660 40.67 154 23.33
Sell [Underperform] 104 6.41 7 6.73
Investment Banking Services
Provided During Past 12 Months
Distribution of Ratings - RBC Capital Markets, LLC Equity Research
7 | Global Insight Weekly
November 16, 2017 | RBC Wealth Management
Risk Rating:
As of March 31, 2013, RBC Capital Markets, LLC suspends its Average
and Above Average risk ratings. The Speculative risk rating reflects a
security’s lower level of financial or operating predictability, illiquid
share trading volumes, high balance sheet leverage, or limited
operating history that result in a higher expectation of financial and/
or stock price volatility.
Valuation and Risks to Rating and Price Target
When RBC Wealth Management assigns a value to a company in a
research report, FINRA Rules and NYSE Rules (as incorporated into
the FINRA Rulebook) require that the basis for the valuation and
the impediments to obtaining that valuation be described. Where
applicable, this information is included in the text of our research
in the sections entitled “Valuation” and “Risks to Rating and Price
Target”, respectively.
The analyst(s) responsible for preparing this research report received
compensation that is based upon various factors, including total
revenues of RBC Capital Markets, LLC, and its affiliates, a portion of
which are or have been generated by investment banking activities of
the member companies of RBC Capital Markets, LLC and its affiliates.
Other Disclosures
Prepared with the assistance of our national research sources.
RBC Wealth Management prepared this report and takes sole
responsibility for its content and distribution. The content may have
been based, at least in part, on material provided by our third-party
correspondent research services. Our third-party correspondent
has given RBC Wealth Management general permission to use
its research reports as source materials, but has not reviewed or
approved this report, nor has it been informed of its publication. Our
third-party correspondent may from time to time have long or short
positions in, effect transactions in, and make markets in securities
referred to herein. Our third-party correspondent may from time to
time perform investment banking or other services for, or solicit
investment banking or other business from, any company mentioned
in this report.
RBC Wealth Management endeavors to make all reasonable efforts
to provide research simultaneously to all eligible clients, having
regard to local time zones in overseas jurisdictions. In certain
investment advisory accounts, RBC Wealth Management will act as
overlay manager for our clients and will initiate transactions in the
securities referenced herein for those accounts upon receipt of this
report. These transactions may occur before or after your receipt of
this report and may have a short-term impact on the market price of
the securities in which transactions occur. RBC Wealth Management
research is posted to our proprietary Web sites to ensure eligible
clients receive coverage initiations and changes in rating, targets,
and opinions in a timely manner. Additional distribution may be done
by sales personnel via e-mail, fax, or regular mail. Clients may also
receive our research via third-party vendors. Please contact your RBC
Wealth Management Financial Advisor for more information regarding
RBC Wealth Management research.
Conflicts Disclosure: RBC Wealth Management is registered with the
Securities and Exchange Commission as a broker/dealer and an
investment adviser, offering both brokerage and investment advisory
services. RBC Wealth Management’s Policy for Managing Conflicts of
Interest in Relation to Investment Research is available from us on
our Web site at http://www.rbccm.com/GLDisclosure/PublicWeb/
DisclosureLookup.aspx?EntityID=2. Conflicts of interests related to
our investment advisory business can be found in Part II of the Firm’s
Form ADV or the Investment Advisor Group Disclosure Document.
Copies of any of these documents are available upon request
through your Financial Advisor. We reserve the right to amend or
supplement this policy, Part II of the ADV, or Disclosure Document at
any time.
The authors are employed by one of the following entities: RBC
Wealth Management USA, a division of RBC Capital Markets, LLC, a
securities broker-dealer with principal offices located in Minnesota
and New York, USA; by RBC Dominion Securities Inc., a securities
broker-dealer with principal offices located in Toronto, Canada;
by RBC Investment Services (Asia) Limited, a subsidiary of RBC
Dominion Securities Inc., a securities broker-dealer with principal
offices located in Hong Kong, China; and by Royal Bank of Canada
Investment Management (U.K.) Limited, an investment management
company with principal offices located in London, United Kingdom.
Research Resources
This document is produced by the Global Portfolio Advisory
Committee within RBC Wealth Management’s Portfolio Advisory
Group. The RBC WM Portfolio Advisory Group provides support
related to asset allocation and portfolio construction for the firm’s
Investment Advisors / Financial Advisors who are engaged in
assembling portfolios incorporating individual marketable securities.
The Committee leverages the broad market outlook as developed by
the RBC Investment Strategy Committee, providing additional tactical
and thematic support utilizing research from the RBC Investment
Strategy Committee, RBC Capital Markets, and third-party resources.
Third-party disclaimers
The Global Industry Classification Standard (“GICS”) was developed by and is
the exclusive property and a service mark of MSCI Inc. (“MSCI”) and Standard
& Poor’s Financial Services LLC (“S&P”) and is licensed for use by RBC. Neither
MSCI, S&P, nor any other party involved in making or compiling the GICS or any
GICS classifications makes any express or implied warranties or representations
with respect to such standard or classification (or the results to be obtained by
the use thereof), and all such parties hereby expressly disclaim all warranties of
originality, accuracy, completeness, merchantability and fitness for a particular
purpose with respect to any of such standard or classification. Without limiting
any of the foregoing, in no event shall MSCI, S&P, any of their affiliates or any
third party involved in making or compiling the GICS or any GICS classifications
have any liability for any direct, indirect, special, punitive, consequential or any
other damages (including lost profits) even if notified of the possibility of such
damages.
References herein to “LIBOR”, “LIBO Rate”, “L” or other LIBOR abbreviations
means the London interbank offered rate as administered by ICE Benchmark
Administration (or any other person that takes over the administration of such
rate).
Disclaimer
The information contained in this report has been compiled by RBC Wealth
Management, a division of RBC Capital Markets, LLC, from sources believed to
be reliable, but no representation or warranty, express or implied, is made by
Royal Bank of Canada, RBC Wealth Management, its affiliates or any other person
as to its accuracy, completeness or correctness. All opinions and estimates
contained in this report constitute RBC Wealth Management’s judgment as of
the date of this report, are subject to change without notice and are provided
in good faith but without legal responsibility. Past performance is not a guide
8 | Global Insight Weekly
November 16, 2017 | RBC Wealth Management
to future performance, future returns are not guaranteed, and a loss of original
capital may occur. Every province in Canada, state in the U.S., and most countries
throughout the world have their own laws regulating the types of securities and
other investment products which may be offered to their residents, as well as
the process for doing so. As a result, the securities discussed in this report may
not be eligible for sale in some jurisdictions. This report is not, and under no
circumstances should be construed as, a solicitation to act as securities broker or
dealer in any jurisdiction by any person or company that is not legally permitted to
carry on the business of a securities broker or dealer in that jurisdiction. Nothing
in this report constitutes legal, accounting or tax advice or individually tailored
investment advice. This material is prepared for general circulation to clients,
including clients who are affiliates of Royal Bank of Canada, and does not have
regard to the particular circumstances or needs of any specific person who may
read it. The investments or services contained in this report may not be suitable
for you and it is recommended that you consult an independent investment
advisor if you are in doubt about the suitability of such investments or services.
To the full extent permitted by law neither Royal Bank of Canada nor any of its
affiliates, nor any other person, accepts any liability whatsoever for any direct or
consequential loss arising from any use of this report or the information contained
herein. No matter contained in this document may be reproduced or copied by any
means without the prior consent of Royal Bank of Canada. Additional information
is available upon request.
To U.S. Residents: This publication has been approved by RBC Capital Markets,
LLC, Member NYSE/FINRA/SIPC, which is a U.S. registered broker-dealer and
which accepts responsibility for this report and its dissemination in the United
States. RBC Capital Markets, LLC, is an indirect wholly-owned subsidiary of the
Royal Bank of Canada and, as such, is a related issuer of Royal Bank of Canada.
Any U.S. recipient of this report that is not a registered broker-dealer or a bank
acting in a broker or dealer capacity and that wishes further information regarding,
or to effect any transaction in, any of the securities discussed in this report,
should contact and place orders with RBC Capital Markets, LLC. International
investing involves risks not typically associated with U.S. investing, including
currency fluctuation, foreign taxation, political instability and different accounting
standards.
To Canadian Residents: This publication has been approved by RBC Dominion
Securities Inc. RBC Dominion Securities Inc.* and Royal Bank of Canada are
separate corporate entities which are affiliated. *Member-Canadian Investor
Protection Fund. ®Registered trademark of Royal Bank of Canada. Used under
license. RBC Wealth Management is a registered trademark of Royal Bank of
Canada. Used under license.
RBC Wealth Management (British Isles): This publication is distributed by Royal
Bank of Canada Investment Management (U.K.) Limited and RBC Investment
Solutions (CI) Limited. Royal Bank of Canada Investment Management (U.K.)
Limited is authorised and regulated by the Financial Conduct Authority (Reference
number: 146504). Registered office: Riverbank House, 2 Swan Lane , London,
EC4R 3BF, UK. RBC Investment Solutions (CI) Limited is regulated by the Jersey
Financial Services Commission in the conduct of investment business in Jersey.
Registered office: Gaspé House, 66-72 Esplanade, St Helier, Jersey JE2 3QT,
Channel Islands, registered company number 119162.
To Hong Kong Residents: This publication is distributed in Hong Kong by
Royal Bank of Canada, Hong Kong Branch which is regulated by the Hong
Kong Monetary Authority and the Securities and Futures Commission (‘SFC’),
and RBC Investment Services (Asia) Limited, which is regulated by the SFC.
Financial Services provided to Australia: Financial services may be provided in
Australia in accordance with applicable law. Financial services provided by the
Royal Bank of Canada, Hong Kong Branch are provided pursuant to the Royal
Bank of Canada’s Australian Financial Services Licence (‘AFSL’) (No. 246521).
To Singapore Residents: This publication is distributed in Singapore by the
Royal Bank of Canada, Singapore Branch, a registered entity granted offshore
bank licence by the Monetary Authority of Singapore. This material has been
prepared for general circulation and does not take into account the objectives,
financial situation, or needs of any recipient. You are advised to seek indepen-
dent advice from a financial adviser before purchasing any product. If you do
not obtain independent advice, you should consider whether the product is
suitable for you. Past performance is not indicative of future performance. If you
have any questions related to this publication, please contact the Royal Bank
of Canada, Singapore Branch. Royal Bank of Canada, Singapore Branch accepts
responsibility for this report and its dissemination in Singapore.
© RBC Capital Markets, LLC 2017 - Member NYSE/FINRA/SIPC
© RBC Dominion Securities Inc. 2017 - Member Canadian Investor Protection Fund
© RBC Europe Limited 2017
© Royal Bank of Canada 2017
All rights reserved
RBC1253

Contenu connexe

Tendances

Putnam Perspectives: Fixed Income Outlook Q1 2014
Putnam Perspectives: Fixed Income Outlook Q1 2014Putnam Perspectives: Fixed Income Outlook Q1 2014
Putnam Perspectives: Fixed Income Outlook Q1 2014Putnam Investments
 
15.09.18 FOMC_Announcement_Why_the_Fed_Kept_Rates_Lower (USCMRS)
15.09.18 FOMC_Announcement_Why_the_Fed_Kept_Rates_Lower (USCMRS)15.09.18 FOMC_Announcement_Why_the_Fed_Kept_Rates_Lower (USCMRS)
15.09.18 FOMC_Announcement_Why_the_Fed_Kept_Rates_Lower (USCMRS)Greg Meier
 
Reduction in Reserve Requirement Ratio in China
Reduction in Reserve Requirement Ratio in ChinaReduction in Reserve Requirement Ratio in China
Reduction in Reserve Requirement Ratio in ChinaHe Jiang
 
Putnam Fixed Income Outlook q313
Putnam Fixed Income Outlook q313Putnam Fixed Income Outlook q313
Putnam Fixed Income Outlook q313Putnam Investments
 
FI Insights V17I1 Print Version
FI Insights V17I1 Print VersionFI Insights V17I1 Print Version
FI Insights V17I1 Print VersionDean Miller
 
Putnam Perspectives: Fixed-Income Outlook Q3 2014
Putnam Perspectives: Fixed-Income Outlook Q3 2014Putnam Perspectives: Fixed-Income Outlook Q3 2014
Putnam Perspectives: Fixed-Income Outlook Q3 2014Putnam Investments
 
Putnam Perspectives: Capital Markets Outlook Q3 2014
Putnam Perspectives: Capital Markets Outlook Q3 2014Putnam Perspectives: Capital Markets Outlook Q3 2014
Putnam Perspectives: Capital Markets Outlook Q3 2014Putnam Investments
 
Market Perspectives - December 2016
Market Perspectives - December 2016Market Perspectives - December 2016
Market Perspectives - December 2016Mark Biegel
 
Deloitte Report "Global Powers of Retail 2014"
Deloitte Report "Global Powers of Retail 2014"Deloitte Report "Global Powers of Retail 2014"
Deloitte Report "Global Powers of Retail 2014"Oliver Grave
 
Market perspective november 2016
Market perspective   november 2016Market perspective   november 2016
Market perspective november 2016Mark Biegel
 
June 23 I Session 1 I GBIH
June 23 I Session 1 I GBIHJune 23 I Session 1 I GBIH
June 23 I Session 1 I GBIHGBIHSupport
 
June 11 I Session 2 I GBIH
June 11 I Session 2 I GBIHJune 11 I Session 2 I GBIH
June 11 I Session 2 I GBIHGBIHSupport
 
Market Perspectives February 2017
Market Perspectives   February 2017Market Perspectives   February 2017
Market Perspectives February 2017James Waller
 
Miles Kirkland Counsels Patience, Diversification
Miles Kirkland Counsels Patience, DiversificationMiles Kirkland Counsels Patience, Diversification
Miles Kirkland Counsels Patience, DiversificationAndrew May
 
4Q2014-In-a-Bond-Bind
4Q2014-In-a-Bond-Bind4Q2014-In-a-Bond-Bind
4Q2014-In-a-Bond-BindRon New
 
Nathan Morgan_Home Depot analysis
Nathan Morgan_Home Depot analysisNathan Morgan_Home Depot analysis
Nathan Morgan_Home Depot analysisNathan Morgan
 
July 15 I Session 1 I GBIH
July 15 I Session 1 I GBIHJuly 15 I Session 1 I GBIH
July 15 I Session 1 I GBIHGBIHSupport
 
Putnam Global Income Trust Q&A Q2 2013
Putnam Global Income Trust Q&A Q2 2013Putnam Global Income Trust Q&A Q2 2013
Putnam Global Income Trust Q&A Q2 2013Putnam Investments
 

Tendances (20)

Putnam Perspectives: Fixed Income Outlook Q1 2014
Putnam Perspectives: Fixed Income Outlook Q1 2014Putnam Perspectives: Fixed Income Outlook Q1 2014
Putnam Perspectives: Fixed Income Outlook Q1 2014
 
15.09.18 FOMC_Announcement_Why_the_Fed_Kept_Rates_Lower (USCMRS)
15.09.18 FOMC_Announcement_Why_the_Fed_Kept_Rates_Lower (USCMRS)15.09.18 FOMC_Announcement_Why_the_Fed_Kept_Rates_Lower (USCMRS)
15.09.18 FOMC_Announcement_Why_the_Fed_Kept_Rates_Lower (USCMRS)
 
Reduction in Reserve Requirement Ratio in China
Reduction in Reserve Requirement Ratio in ChinaReduction in Reserve Requirement Ratio in China
Reduction in Reserve Requirement Ratio in China
 
Putnam Fixed Income Outlook q313
Putnam Fixed Income Outlook q313Putnam Fixed Income Outlook q313
Putnam Fixed Income Outlook q313
 
FI Insights V17I1 Print Version
FI Insights V17I1 Print VersionFI Insights V17I1 Print Version
FI Insights V17I1 Print Version
 
Putnam Perspectives: Fixed-Income Outlook Q3 2014
Putnam Perspectives: Fixed-Income Outlook Q3 2014Putnam Perspectives: Fixed-Income Outlook Q3 2014
Putnam Perspectives: Fixed-Income Outlook Q3 2014
 
Putnam Outlook Q3 2013
Putnam Outlook Q3 2013Putnam Outlook Q3 2013
Putnam Outlook Q3 2013
 
Putnam Perspectives: Capital Markets Outlook Q3 2014
Putnam Perspectives: Capital Markets Outlook Q3 2014Putnam Perspectives: Capital Markets Outlook Q3 2014
Putnam Perspectives: Capital Markets Outlook Q3 2014
 
Market Perspectives - December 2016
Market Perspectives - December 2016Market Perspectives - December 2016
Market Perspectives - December 2016
 
Deloitte Report "Global Powers of Retail 2014"
Deloitte Report "Global Powers of Retail 2014"Deloitte Report "Global Powers of Retail 2014"
Deloitte Report "Global Powers of Retail 2014"
 
Market perspective november 2016
Market perspective   november 2016Market perspective   november 2016
Market perspective november 2016
 
June 23 I Session 1 I GBIH
June 23 I Session 1 I GBIHJune 23 I Session 1 I GBIH
June 23 I Session 1 I GBIH
 
June 11 I Session 2 I GBIH
June 11 I Session 2 I GBIHJune 11 I Session 2 I GBIH
June 11 I Session 2 I GBIH
 
Q3_2016_QER_short_version_clients-MikeSchwartz
Q3_2016_QER_short_version_clients-MikeSchwartzQ3_2016_QER_short_version_clients-MikeSchwartz
Q3_2016_QER_short_version_clients-MikeSchwartz
 
Market Perspectives February 2017
Market Perspectives   February 2017Market Perspectives   February 2017
Market Perspectives February 2017
 
Miles Kirkland Counsels Patience, Diversification
Miles Kirkland Counsels Patience, DiversificationMiles Kirkland Counsels Patience, Diversification
Miles Kirkland Counsels Patience, Diversification
 
4Q2014-In-a-Bond-Bind
4Q2014-In-a-Bond-Bind4Q2014-In-a-Bond-Bind
4Q2014-In-a-Bond-Bind
 
Nathan Morgan_Home Depot analysis
Nathan Morgan_Home Depot analysisNathan Morgan_Home Depot analysis
Nathan Morgan_Home Depot analysis
 
July 15 I Session 1 I GBIH
July 15 I Session 1 I GBIHJuly 15 I Session 1 I GBIH
July 15 I Session 1 I GBIH
 
Putnam Global Income Trust Q&A Q2 2013
Putnam Global Income Trust Q&A Q2 2013Putnam Global Income Trust Q&A Q2 2013
Putnam Global Income Trust Q&A Q2 2013
 

Similaire à Dangerous Curves Ahead

Global Insight-Wake Me Up When September Begins
Global Insight-Wake Me Up When September BeginsGlobal Insight-Wake Me Up When September Begins
Global Insight-Wake Me Up When September BeginsDavid Apted
 
LBS Asset Allocation August Update - July 28, 2017
LBS Asset Allocation August Update - July 28, 2017LBS Asset Allocation August Update - July 28, 2017
LBS Asset Allocation August Update - July 28, 2017Mark MacIsaac
 
Laurentian Bank Securities - Economic Research and Strategy
Laurentian Bank Securities - Economic Research and Strategy Laurentian Bank Securities - Economic Research and Strategy
Laurentian Bank Securities - Economic Research and Strategy Mark MacIsaac
 
WTWealth_7-2015V2 (1)
WTWealth_7-2015V2 (1)WTWealth_7-2015V2 (1)
WTWealth_7-2015V2 (1)John Heilner
 
Finlight Research - Market Perspectives - Dec 2016
Finlight Research - Market Perspectives - Dec 2016Finlight Research - Market Perspectives - Dec 2016
Finlight Research - Market Perspectives - Dec 2016FinLight Research
 
Current Thinking, Q1 2014
Current Thinking, Q1 2014Current Thinking, Q1 2014
Current Thinking, Q1 2014Kevin Lenox
 
C&W MARKETBEAT- CAPITAL MARKETS Q4 2016 – #CRE #REALESTATE #CCIM #SIOR @YOURT...
C&W MARKETBEAT- CAPITAL MARKETS Q4 2016 – #CRE #REALESTATE #CCIM #SIOR @YOURT...C&W MARKETBEAT- CAPITAL MARKETS Q4 2016 – #CRE #REALESTATE #CCIM #SIOR @YOURT...
C&W MARKETBEAT- CAPITAL MARKETS Q4 2016 – #CRE #REALESTATE #CCIM #SIOR @YOURT...Guy Masse
 
Investment Strategy Outlook: Mid-Year Update
Investment Strategy Outlook: Mid-Year UpdateInvestment Strategy Outlook: Mid-Year Update
Investment Strategy Outlook: Mid-Year UpdateSarah Cuddy
 
2017 Investment Outlook & Issues_FINAL_booklet format
2017 Investment Outlook & Issues_FINAL_booklet format2017 Investment Outlook & Issues_FINAL_booklet format
2017 Investment Outlook & Issues_FINAL_booklet formatJuliane Morris, MBA, CWS
 
LBS Asset Allocation - March Update
LBS Asset Allocation - March UpdateLBS Asset Allocation - March Update
LBS Asset Allocation - March UpdateMark MacIsaac
 
LBS - Asset Allocation March Update
LBS - Asset Allocation March UpdateLBS - Asset Allocation March Update
LBS - Asset Allocation March UpdateMark MacIsaac
 
Global Insight - Three Paths
Global Insight - Three PathsGlobal Insight - Three Paths
Global Insight - Three PathsDavid Apted
 
Finlight Research - Market perspectives - Jan 2015
Finlight Research - Market perspectives - Jan 2015Finlight Research - Market perspectives - Jan 2015
Finlight Research - Market perspectives - Jan 2015Zouheir Ben Tamarout
 
Finlight Research - Market Perspectives - Aug 2015
Finlight Research - Market Perspectives - Aug 2015Finlight Research - Market Perspectives - Aug 2015
Finlight Research - Market Perspectives - Aug 2015FinLight Research
 

Similaire à Dangerous Curves Ahead (20)

Support System
Support SystemSupport System
Support System
 
Global Insight-Wake Me Up When September Begins
Global Insight-Wake Me Up When September BeginsGlobal Insight-Wake Me Up When September Begins
Global Insight-Wake Me Up When September Begins
 
LBS Asset Allocation August Update - July 28, 2017
LBS Asset Allocation August Update - July 28, 2017LBS Asset Allocation August Update - July 28, 2017
LBS Asset Allocation August Update - July 28, 2017
 
Laurentian Bank Securities - Economic Research and Strategy
Laurentian Bank Securities - Economic Research and Strategy Laurentian Bank Securities - Economic Research and Strategy
Laurentian Bank Securities - Economic Research and Strategy
 
Investment Insights for December, 2017
Investment Insights for December, 2017Investment Insights for December, 2017
Investment Insights for December, 2017
 
WTWealth_7-2015V2 (1)
WTWealth_7-2015V2 (1)WTWealth_7-2015V2 (1)
WTWealth_7-2015V2 (1)
 
Finlight Research - Market Perspectives - Dec 2016
Finlight Research - Market Perspectives - Dec 2016Finlight Research - Market Perspectives - Dec 2016
Finlight Research - Market Perspectives - Dec 2016
 
SVB Q1 2017 Economic Report
SVB Q1 2017 Economic ReportSVB Q1 2017 Economic Report
SVB Q1 2017 Economic Report
 
Current Thinking, Q1 2014
Current Thinking, Q1 2014Current Thinking, Q1 2014
Current Thinking, Q1 2014
 
C&W MARKETBEAT- CAPITAL MARKETS Q4 2016 – #CRE #REALESTATE #CCIM #SIOR @YOURT...
C&W MARKETBEAT- CAPITAL MARKETS Q4 2016 – #CRE #REALESTATE #CCIM #SIOR @YOURT...C&W MARKETBEAT- CAPITAL MARKETS Q4 2016 – #CRE #REALESTATE #CCIM #SIOR @YOURT...
C&W MARKETBEAT- CAPITAL MARKETS Q4 2016 – #CRE #REALESTATE #CCIM #SIOR @YOURT...
 
Investment Strategy Outlook: Mid-Year Update
Investment Strategy Outlook: Mid-Year UpdateInvestment Strategy Outlook: Mid-Year Update
Investment Strategy Outlook: Mid-Year Update
 
June
JuneJune
June
 
2017 Investment Outlook & Issues_FINAL_booklet format
2017 Investment Outlook & Issues_FINAL_booklet format2017 Investment Outlook & Issues_FINAL_booklet format
2017 Investment Outlook & Issues_FINAL_booklet format
 
LBS Asset Allocation - March Update
LBS Asset Allocation - March UpdateLBS Asset Allocation - March Update
LBS Asset Allocation - March Update
 
LBS - Asset Allocation March Update
LBS - Asset Allocation March UpdateLBS - Asset Allocation March Update
LBS - Asset Allocation March Update
 
Global Insight - Three Paths
Global Insight - Three PathsGlobal Insight - Three Paths
Global Insight - Three Paths
 
Finlight Research - Market perspectives - Jan 2015
Finlight Research - Market perspectives - Jan 2015Finlight Research - Market perspectives - Jan 2015
Finlight Research - Market perspectives - Jan 2015
 
Monetary Policy Monitor
Monetary Policy MonitorMonetary Policy Monitor
Monetary Policy Monitor
 
BT SFC 2015
BT SFC 2015BT SFC 2015
BT SFC 2015
 
Finlight Research - Market Perspectives - Aug 2015
Finlight Research - Market Perspectives - Aug 2015Finlight Research - Market Perspectives - Aug 2015
Finlight Research - Market Perspectives - Aug 2015
 

Plus de David Apted

Tax Reform: Time for Rubber to meet the road!
Tax Reform: Time for Rubber to meet the road!Tax Reform: Time for Rubber to meet the road!
Tax Reform: Time for Rubber to meet the road!David Apted
 
The Last Yield on Earth
The Last Yield on EarthThe Last Yield on Earth
The Last Yield on EarthDavid Apted
 
China: The Long March to Reform
China: The Long March to ReformChina: The Long March to Reform
China: The Long March to ReformDavid Apted
 
Deduct Premiums for Long-Term Care?
Deduct Premiums for Long-Term Care?Deduct Premiums for Long-Term Care?
Deduct Premiums for Long-Term Care?David Apted
 
Global Insight- Quality Check
Global Insight- Quality CheckGlobal Insight- Quality Check
Global Insight- Quality CheckDavid Apted
 
Gi French Connection
Gi French ConnectionGi French Connection
Gi French ConnectionDavid Apted
 

Plus de David Apted (10)

Tax Reform: Time for Rubber to meet the road!
Tax Reform: Time for Rubber to meet the road!Tax Reform: Time for Rubber to meet the road!
Tax Reform: Time for Rubber to meet the road!
 
The "X" Factor
The "X" FactorThe "X" Factor
The "X" Factor
 
The Last Yield on Earth
The Last Yield on EarthThe Last Yield on Earth
The Last Yield on Earth
 
Strain In Spain
Strain In SpainStrain In Spain
Strain In Spain
 
China: The Long March to Reform
China: The Long March to ReformChina: The Long March to Reform
China: The Long March to Reform
 
Global Insight
Global Insight Global Insight
Global Insight
 
Deduct Premiums for Long-Term Care?
Deduct Premiums for Long-Term Care?Deduct Premiums for Long-Term Care?
Deduct Premiums for Long-Term Care?
 
Global Insight
Global InsightGlobal Insight
Global Insight
 
Global Insight- Quality Check
Global Insight- Quality CheckGlobal Insight- Quality Check
Global Insight- Quality Check
 
Gi French Connection
Gi French ConnectionGi French Connection
Gi French Connection
 

Dernier

Instant Issue Debit Cards - High School Spirit
Instant Issue Debit Cards - High School SpiritInstant Issue Debit Cards - High School Spirit
Instant Issue Debit Cards - High School Spiritegoetzinger
 
Call Girls Koregaon Park Call Me 7737669865 Budget Friendly No Advance Booking
Call Girls Koregaon Park Call Me 7737669865 Budget Friendly No Advance BookingCall Girls Koregaon Park Call Me 7737669865 Budget Friendly No Advance Booking
Call Girls Koregaon Park Call Me 7737669865 Budget Friendly No Advance Bookingroncy bisnoi
 
VIP Kolkata Call Girl Jodhpur Park 👉 8250192130 Available With Room
VIP Kolkata Call Girl Jodhpur Park 👉 8250192130  Available With RoomVIP Kolkata Call Girl Jodhpur Park 👉 8250192130  Available With Room
VIP Kolkata Call Girl Jodhpur Park 👉 8250192130 Available With Roomdivyansh0kumar0
 
The Economic History of the U.S. Lecture 23.pdf
The Economic History of the U.S. Lecture 23.pdfThe Economic History of the U.S. Lecture 23.pdf
The Economic History of the U.S. Lecture 23.pdfGale Pooley
 
02_Fabio Colombo_Accenture_MeetupDora&Cybersecurity.pptx
02_Fabio Colombo_Accenture_MeetupDora&Cybersecurity.pptx02_Fabio Colombo_Accenture_MeetupDora&Cybersecurity.pptx
02_Fabio Colombo_Accenture_MeetupDora&Cybersecurity.pptxFinTech Belgium
 
Vip Call US 📞 7738631006 ✅Call Girls In Sakinaka ( Mumbai )
Vip Call US 📞 7738631006 ✅Call Girls In Sakinaka ( Mumbai )Vip Call US 📞 7738631006 ✅Call Girls In Sakinaka ( Mumbai )
Vip Call US 📞 7738631006 ✅Call Girls In Sakinaka ( Mumbai )Pooja Nehwal
 
05_Annelore Lenoir_Docbyte_MeetupDora&Cybersecurity.pptx
05_Annelore Lenoir_Docbyte_MeetupDora&Cybersecurity.pptx05_Annelore Lenoir_Docbyte_MeetupDora&Cybersecurity.pptx
05_Annelore Lenoir_Docbyte_MeetupDora&Cybersecurity.pptxFinTech Belgium
 
00_Main ppt_MeetupDORA&CyberSecurity.pptx
00_Main ppt_MeetupDORA&CyberSecurity.pptx00_Main ppt_MeetupDORA&CyberSecurity.pptx
00_Main ppt_MeetupDORA&CyberSecurity.pptxFinTech Belgium
 
Log your LOA pain with Pension Lab's brilliant campaign
Log your LOA pain with Pension Lab's brilliant campaignLog your LOA pain with Pension Lab's brilliant campaign
Log your LOA pain with Pension Lab's brilliant campaignHenry Tapper
 
(ANIKA) Budhwar Peth Call Girls Just Call 7001035870 [ Cash on Delivery ] Pun...
(ANIKA) Budhwar Peth Call Girls Just Call 7001035870 [ Cash on Delivery ] Pun...(ANIKA) Budhwar Peth Call Girls Just Call 7001035870 [ Cash on Delivery ] Pun...
(ANIKA) Budhwar Peth Call Girls Just Call 7001035870 [ Cash on Delivery ] Pun...ranjana rawat
 
06_Joeri Van Speybroek_Dell_MeetupDora&Cybersecurity.pdf
06_Joeri Van Speybroek_Dell_MeetupDora&Cybersecurity.pdf06_Joeri Van Speybroek_Dell_MeetupDora&Cybersecurity.pdf
06_Joeri Van Speybroek_Dell_MeetupDora&Cybersecurity.pdfFinTech Belgium
 
Best VIP Call Girls Noida Sector 18 Call Me: 8448380779
Best VIP Call Girls Noida Sector 18 Call Me: 8448380779Best VIP Call Girls Noida Sector 18 Call Me: 8448380779
Best VIP Call Girls Noida Sector 18 Call Me: 8448380779Delhi Call girls
 
Dharavi Russian callg Girls, { 09892124323 } || Call Girl In Mumbai ...
Dharavi Russian callg Girls, { 09892124323 } || Call Girl In Mumbai ...Dharavi Russian callg Girls, { 09892124323 } || Call Girl In Mumbai ...
Dharavi Russian callg Girls, { 09892124323 } || Call Girl In Mumbai ...Pooja Nehwal
 
The Economic History of the U.S. Lecture 22.pdf
The Economic History of the U.S. Lecture 22.pdfThe Economic History of the U.S. Lecture 22.pdf
The Economic History of the U.S. Lecture 22.pdfGale Pooley
 
Q3 2024 Earnings Conference Call and Webcast Slides
Q3 2024 Earnings Conference Call and Webcast SlidesQ3 2024 Earnings Conference Call and Webcast Slides
Q3 2024 Earnings Conference Call and Webcast SlidesMarketing847413
 
Malad Call Girl in Services 9892124323 | ₹,4500 With Room Free Delivery
Malad Call Girl in Services  9892124323 | ₹,4500 With Room Free DeliveryMalad Call Girl in Services  9892124323 | ₹,4500 With Room Free Delivery
Malad Call Girl in Services 9892124323 | ₹,4500 With Room Free DeliveryPooja Nehwal
 
The Economic History of the U.S. Lecture 17.pdf
The Economic History of the U.S. Lecture 17.pdfThe Economic History of the U.S. Lecture 17.pdf
The Economic History of the U.S. Lecture 17.pdfGale Pooley
 
Andheri Call Girls In 9825968104 Mumbai Hot Models
Andheri Call Girls In 9825968104 Mumbai Hot ModelsAndheri Call Girls In 9825968104 Mumbai Hot Models
Andheri Call Girls In 9825968104 Mumbai Hot Modelshematsharma006
 
Solution Manual for Financial Accounting, 11th Edition by Robert Libby, Patri...
Solution Manual for Financial Accounting, 11th Edition by Robert Libby, Patri...Solution Manual for Financial Accounting, 11th Edition by Robert Libby, Patri...
Solution Manual for Financial Accounting, 11th Edition by Robert Libby, Patri...ssifa0344
 

Dernier (20)

Instant Issue Debit Cards - High School Spirit
Instant Issue Debit Cards - High School SpiritInstant Issue Debit Cards - High School Spirit
Instant Issue Debit Cards - High School Spirit
 
Call Girls Koregaon Park Call Me 7737669865 Budget Friendly No Advance Booking
Call Girls Koregaon Park Call Me 7737669865 Budget Friendly No Advance BookingCall Girls Koregaon Park Call Me 7737669865 Budget Friendly No Advance Booking
Call Girls Koregaon Park Call Me 7737669865 Budget Friendly No Advance Booking
 
VIP Kolkata Call Girl Jodhpur Park 👉 8250192130 Available With Room
VIP Kolkata Call Girl Jodhpur Park 👉 8250192130  Available With RoomVIP Kolkata Call Girl Jodhpur Park 👉 8250192130  Available With Room
VIP Kolkata Call Girl Jodhpur Park 👉 8250192130 Available With Room
 
The Economic History of the U.S. Lecture 23.pdf
The Economic History of the U.S. Lecture 23.pdfThe Economic History of the U.S. Lecture 23.pdf
The Economic History of the U.S. Lecture 23.pdf
 
02_Fabio Colombo_Accenture_MeetupDora&Cybersecurity.pptx
02_Fabio Colombo_Accenture_MeetupDora&Cybersecurity.pptx02_Fabio Colombo_Accenture_MeetupDora&Cybersecurity.pptx
02_Fabio Colombo_Accenture_MeetupDora&Cybersecurity.pptx
 
Vip Call US 📞 7738631006 ✅Call Girls In Sakinaka ( Mumbai )
Vip Call US 📞 7738631006 ✅Call Girls In Sakinaka ( Mumbai )Vip Call US 📞 7738631006 ✅Call Girls In Sakinaka ( Mumbai )
Vip Call US 📞 7738631006 ✅Call Girls In Sakinaka ( Mumbai )
 
05_Annelore Lenoir_Docbyte_MeetupDora&Cybersecurity.pptx
05_Annelore Lenoir_Docbyte_MeetupDora&Cybersecurity.pptx05_Annelore Lenoir_Docbyte_MeetupDora&Cybersecurity.pptx
05_Annelore Lenoir_Docbyte_MeetupDora&Cybersecurity.pptx
 
00_Main ppt_MeetupDORA&CyberSecurity.pptx
00_Main ppt_MeetupDORA&CyberSecurity.pptx00_Main ppt_MeetupDORA&CyberSecurity.pptx
00_Main ppt_MeetupDORA&CyberSecurity.pptx
 
Commercial Bank Economic Capsule - April 2024
Commercial Bank Economic Capsule - April 2024Commercial Bank Economic Capsule - April 2024
Commercial Bank Economic Capsule - April 2024
 
Log your LOA pain with Pension Lab's brilliant campaign
Log your LOA pain with Pension Lab's brilliant campaignLog your LOA pain with Pension Lab's brilliant campaign
Log your LOA pain with Pension Lab's brilliant campaign
 
(ANIKA) Budhwar Peth Call Girls Just Call 7001035870 [ Cash on Delivery ] Pun...
(ANIKA) Budhwar Peth Call Girls Just Call 7001035870 [ Cash on Delivery ] Pun...(ANIKA) Budhwar Peth Call Girls Just Call 7001035870 [ Cash on Delivery ] Pun...
(ANIKA) Budhwar Peth Call Girls Just Call 7001035870 [ Cash on Delivery ] Pun...
 
06_Joeri Van Speybroek_Dell_MeetupDora&Cybersecurity.pdf
06_Joeri Van Speybroek_Dell_MeetupDora&Cybersecurity.pdf06_Joeri Van Speybroek_Dell_MeetupDora&Cybersecurity.pdf
06_Joeri Van Speybroek_Dell_MeetupDora&Cybersecurity.pdf
 
Best VIP Call Girls Noida Sector 18 Call Me: 8448380779
Best VIP Call Girls Noida Sector 18 Call Me: 8448380779Best VIP Call Girls Noida Sector 18 Call Me: 8448380779
Best VIP Call Girls Noida Sector 18 Call Me: 8448380779
 
Dharavi Russian callg Girls, { 09892124323 } || Call Girl In Mumbai ...
Dharavi Russian callg Girls, { 09892124323 } || Call Girl In Mumbai ...Dharavi Russian callg Girls, { 09892124323 } || Call Girl In Mumbai ...
Dharavi Russian callg Girls, { 09892124323 } || Call Girl In Mumbai ...
 
The Economic History of the U.S. Lecture 22.pdf
The Economic History of the U.S. Lecture 22.pdfThe Economic History of the U.S. Lecture 22.pdf
The Economic History of the U.S. Lecture 22.pdf
 
Q3 2024 Earnings Conference Call and Webcast Slides
Q3 2024 Earnings Conference Call and Webcast SlidesQ3 2024 Earnings Conference Call and Webcast Slides
Q3 2024 Earnings Conference Call and Webcast Slides
 
Malad Call Girl in Services 9892124323 | ₹,4500 With Room Free Delivery
Malad Call Girl in Services  9892124323 | ₹,4500 With Room Free DeliveryMalad Call Girl in Services  9892124323 | ₹,4500 With Room Free Delivery
Malad Call Girl in Services 9892124323 | ₹,4500 With Room Free Delivery
 
The Economic History of the U.S. Lecture 17.pdf
The Economic History of the U.S. Lecture 17.pdfThe Economic History of the U.S. Lecture 17.pdf
The Economic History of the U.S. Lecture 17.pdf
 
Andheri Call Girls In 9825968104 Mumbai Hot Models
Andheri Call Girls In 9825968104 Mumbai Hot ModelsAndheri Call Girls In 9825968104 Mumbai Hot Models
Andheri Call Girls In 9825968104 Mumbai Hot Models
 
Solution Manual for Financial Accounting, 11th Edition by Robert Libby, Patri...
Solution Manual for Financial Accounting, 11th Edition by Robert Libby, Patri...Solution Manual for Financial Accounting, 11th Edition by Robert Libby, Patri...
Solution Manual for Financial Accounting, 11th Edition by Robert Libby, Patri...
 

Dangerous Curves Ahead

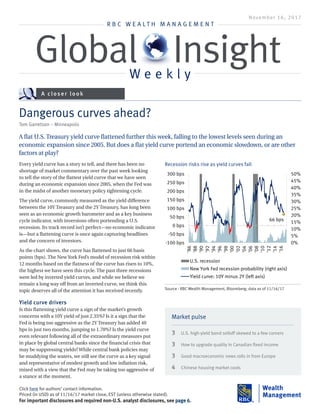
  • 1. Click here for authors’ contact information. Priced (in USD) as of 11/16/17 market close, EST (unless otherwise stated). For important disclosures and required non-U.S. analyst disclosures, see page 6. Every yield curve has a story to tell, and there has been no shortage of market commentary over the past week looking to tell the story of the flattest yield curve that we have seen during an economic expansion since 2005, when the Fed was in the midst of another monetary policy tightening cycle. The yield curve, commonly measured as the yield difference between the 10Y Treasury and the 2Y Treasury, has long been seen as an economic growth barometer and as a key business cycle indicator, with inversions often portending a U.S. recession. Its track record isn’t perfect—no economic indicator is—but a flattening curve is once again capturing headlines and the concern of investors. As the chart shows, the curve has flattened to just 66 basis points (bps). The New York Fed’s model of recession risk within 12 months based on the flatness of the curve has risen to 10%, the highest we have seen this cycle. The past three recessions were led by inverted yield curves, and while we believe we remain a long way off from an inverted curve, we think this topic deserves all of the attention it has received recently. Yield curve drivers Is this flattening yield curve a sign of the market’s growth concerns with a 10Y yield of just 2.35%? Is it a sign that the Fed is being too aggressive as the 2Y Treasury has added 40 bps in just two months, jumping to 1.70%? Is the yield curve even relevant following all of the extraordinary measures put in place by global central banks since the financial crisis that may be suppressing yields? While central bank policies may be muddying the waters, we still see the curve as a key signal and representative of modest growth and low inflation risk, mixed with a view that the Fed may be taking too aggressive of a stance at the moment. Dangerous curves ahead? Tom Garretson – Minneapolis November 16, 2017 A closer look A flat U.S. Treasury yield curve flattened further this week, falling to the lowest levels seen during an economic expansion since 2005. But does a flat yield curve portend an economic slowdown, or are other factors at play? R B C W E A L T H M A N A G E M E N T Global InsightW e e k l y 3 U.S. high-yield bond selloff skewed to a few corners 3 How to upgrade quality in Canadian fixed income 3 Good macroeconomic news rolls in from Europe 4 Chinese housing market cools Market pulse Source - RBC Wealth Management, Bloomberg; data as of 11/16/17 Recession risks rise as yield curves fall 66 bps 0% 5% 10% 15% 20% 25% 30% 35% 40% 45% 50% -100 bps -50 bps 0 bps 50 bps 100 bps 150 bps 200 bps 250 bps 300 bps '86 '88 '90 '92 '94 '96 '98 '00 '02 '04 '06 '08 '10 '12 '14 '16 U.S. recession New York Fed recession probability (right axis) Yield curve: 10Y minus 2Y (left axis)
  • 2. 2 | Global Insight Weekly November 16, 2017 | RBC Wealth Management Since the Fed began raising short-term rates in December 2015, boosting short-term rates by 100 bps with another 25 bps hike due in December, the U.S. 10Y Treasury has gained precisely … 5 bps. The New York Fed also maintains a model that breaks the 10Y down into two key components, the risk-neutral yield and a term premium. The former is simply the expected average of short-term rates over 10 years priced into the 10Y, while the term premium is the compensation investors are receiving for the risk that short-term rates could deviate from expectations. While a purely academic exercise, it can be useful as a thought exercise when trying to understand yield curve dynamics. As the upper chart shows, the expected average short-term rate priced into the 10Y has risen along with rate hikes. But this has been almost completely offset by a decline in the term premium, which is now negative—meaning that investors are confident that short-term rates won’t rise faster or higher than expected. A simple explanation would be that each rate hike brings us one rate hike closer to the next rate cut. We expect this dynamic to continue to play out with those two factors offsetting each other to keep the 10Y yield range-bound around current levels. This long trend of curve flattening should continue, in our view, as Fed rate hikes continue at a slow and steady pace, with little upside risk to growth and inflation keeping a lid on 10Y yields below 3%. Diagnosis doesn’t matter, prescription is the same Regardless of what is driving a flatter yield curve, the prescription is the same: the Fed will likely have to keep a light hand on the rate hike throttle. With a yield curve spread of just 66 bps between 2Y and 10Y Treasuries, the cushion is roughly just three 25 bps rate hikes before the Fed risks inverting the curve—assuming the 10Y maintains current levels. With few signs of overheating sectors in the economy and low inflation, we think the Fed has room to be cautious and it will be a slow rate hike pace rather than a higher 10Y that keeps the yield curve steep over the near term. Stay the course—for now We would caution against looking to past Fed tightening cycles to guide asset class performance going forward—there simply haven’t been enough to draw statistically significant conclusions from. But the lower chart shows relative performance of major asset classes for the past two cycles. We expect the current one to play out like the 1990s, when the Fed raised rates quickly early in the decade, paused for nearly three years as inflationary pressures eased, before resuming hikes into the 2001 recession. Even as the curve flattens toward 0 bps, we would still expect equities to outperform bonds, Financials to outperform the S&P 500, and for long duration to modestly outperform short duration. For now we think investors can maintain the playbook that has worked to this point, but the yield curve remains an important signal and merits all of the scrutiny that it is receiving. Source - RBC Wealth Management, Bloomberg; data as of 11/16/17 Relative performance over past two flattening cycles 5% 8% 28% 15% -1% 5% 5% -4% -10% -5% 0% 5% 10% 15% 20% 25% 30% Duration: Longvs.Short Creditrisk: HYvs.IG Financialsvs. S&P500 Growthvs.Value Duration: Longvs.Short Creditrisk: HYvs.IG Financialsvs. S&P500 Growthvs.Value Bonds Equities Bonds Equities March '96 to June '98 April '05 to February '06 Periods when yield curve (10Y yield minus 2Y yield) flattened from 65 bps to 0 bps Source - RBC Wealth Management, Bloomberg; data through 11/14/17 Why the curve is flat: Decomposing the 10Y Treasury yield -1.0% -0.5% 0.0% 0.5% 1.0% 1.5% 2.0% 2.5% 3.0% Sep'15 Dec'15 Mar'16 Jun'16 Sep'16 Dec'16 Mar'17 Jun'17 Sep'17 U.S. 10Y Treasury yield Term premium Expected average short-term rate Fed funds rate
  • 3. 3 | Global Insight Weekly November 16, 2017 | RBC Wealth Management United States Bill Kuehn & Sam Renikoff – Minneapolis • High-yield bonds have sold off in 12 of the last 16 days, according to the Bloomberg Barclays High Yield Index, with spreads widening as much as 42 basis points (bps) in the last three weeks. A litany of factors has roiled the riskiest corner of the market, including a string of poor earnings reports and rating downgrades, recession concerns, and disputes over tax reform. The high-yield market has already had its worst month of the year, returning -1.31%, wiping out the prior two months’ returns. • While bonds are noticeably down across the market, the extent of the selloff appears to be skewed toward a few specific corners. B-rated credits have seen the brunt of the selling pressure, where spreads have widened out 55 bps vs. 40 for CCC credits and 30 for BB credits. The largest underperformers were B-rated Telecom credits— by and large the worst-performing sector with spreads 23% wider over the last three weeks relative to just 12% for the average sector ex-Telecom. With this skewness in mind, we maintain our Underweight recommendation on high yield, where yields are still 100 bps lower than the 5-year average, while credits rated BBB and better look historically attractive. • Equity markets have also taken notice of the flatter yield curve, with the S&P 500 pulling back 1.2% as concerns mounted, but later bouncing back on positive corporate news and passage of tax cut legislation in the House of Representatives. While changes in the yield curve should be monitored closely, our analysis of historical data shows that equities can continue to provide positive returns in a flattening yield curve environment, especially when the flattening is not accompanied by elevated recession risks. Canada Diana Di Luca – Toronto • Bank of Canada (BoC) Senior Deputy Governor Carolyn Wilkins, speaking in New York on November 15, reiterated the most recent BoC message—monetary policy changes (e.g., rate increases) will likely be slow and gradual. Wilkins also discussed NAFTA’s impact on business investment and said that the uncertainty surrounding NAFTA is clearly affecting businesses and potential investment decisions. Interest rate expectations have been unchanged following her comments, with the market pricing in an approximate 40% chance the next hike will occur in January and an April hike is fully priced in. • The recent weakness in the high-yield market has paid off for investors who upgraded quality earlier this year, and we continue to think this is a strategy that can improve relative performance for Canadian fixed income investors. The move higher in rates since early June means that high-quality credit has been paying progressively higher yields and, despite the recent selloff in lower-rated bonds, the yield pick-up to own a riskier bond remains near the lowest level in nearly a decade. One of the easiest trades investors can look at to upgrade quality is actually in their government bond holdings, where lower-rated provincial bonds can be swapped into higher-rated federal bonds. • The TSX Preferred Share Index rose to a fresh year-to- date high during the week, and is trading at its highest level since July 2015. The preferred share market has been resilient despite an 8 basis point decline in the 5-year Government of Canada yield over the past month. We continue to favour a mix of heavily discounted rate resets, perpetual issues, and rate resets with large reset spreads. Eu ro pe Frédérique Carrier & Thomas McGarrity – London • The STOXX Europe 600 Index was down some 2% during the week, as investors looked to lock in gains after a strong performance year to date. This profit-taking streak has been the longest since autumn 2016, and mining and energy in particular bore the brunt of the move, as they responded to weaker-than-expected growth in China and lower energy prices, respectively. Source - RBC Wealth Management, Bloomberg; data through 11/15/17 B-rated credits lead the high-yield selloff -5% 0% 5% 10% 15% 20% Oct20'17 Oct27'17 Nov03'17 Nov10'17 %Netspreadchange(1-month) BB index B index CCC index
  • 4. 4 | Global Insight Weekly November 16, 2017 | RBC Wealth Management • Equities also took their cue from fixed income where high-yield spreads backed up. In Europe, we had highlighted for a while that high-yield spreads did not reflect underlying risk. The recent widening of high-yield spreads has made valuations slightly more attractive; however, these spreads remain at historically tight levels. • Good macroeconomic news continued to roll in from Europe, with German Q3 GDP exceeding consensus expectations at 0.8% q/q and 2.8% y/y, while in Italy GDP reached 0.5% q/q and 1.8% y/y. In both instances, these annual growth levels have not been seen since 2011. Overall eurozone Q3 GDP rose 2.5% y/y, with inflation stable at 1.4% y/y in October. • In the U.K., the September unemployment rate held steady at 4.3%, the lowest level in more than 40 years. Average weekly earnings remained relatively subdued at 2.2% y/y. RBC economists pointed to an actual fall in employment in the three months to September relative to the previous three months. 14,000 jobs were lost in Q3, the worst loss since 2015. While they caution against reading too much into one data point, it is, nevertheless, something to watch carefully. • The U.K. Consumer Price Index came in slightly below consensus expectations and core annual inflation remained stable at 2.7% y/y, a level that has been maintained for three consecutive months. Clients who follow housing prices in the U.K. will have noticed that the Rightmove House Price Index suggests a 1.8% y/y increase in November at the national level, but a 2.4% y/y fall in London, the third consecutive month prices have fallen. Asia Pacific Jay Roberts – Hong Kong • Chinese markets wobbled in midweek on concerns of deleveraging in the country, with the 10-year government bond yield going over 4% for the first time in three years. Ripples were also felt in commodity markets. Economic data, such as industrial production, was also a little weaker in October. The value of new home sales in China in October declined by 3.4% to RMB 909B ($137B), the largest drop in nearly three years. Measures to cool property markets in localities with excessive price appreciation have been in place for quite a while. • Any further softness in Chinese economic data would likely present a headwind for Asian equities, which have performed extremely well in 2017. • Chinese internet giant Tencent (700 HK) posted yet another set of quarterly results that beat expectations. Tencent, which dominates in China in areas such as messaging, social networking, and online gaming, posted Q3 revenue growth of 61% y/y to RMB 65.2B ($9.83B), above forecast and boosted by the extremely popular game Honour of Kings. Net income of RMB 18B ($2.71B) rose by 69% y/y (forecast: RMB 15.8B). The stock gained 2.3% in Hong Kong. The relatively small gain in the stock in spite of the supercharged growth rates is a reflection of the fact that it had already doubled in value in 2017 to become one of the world’s largest internet companies by market capitalization. • The stock of AIA Group (1299 HK), one of Asia’s largest life insurance companies, jumped higher in Hong Kong on news that China will relax the limits on foreign ownership in various areas of financial services. For life insurance companies, the ownership limit of foreign companies in China will be lifted to 51% from 50% in three years, thereby giving foreign firms the potential to have a controlling interest. The restriction will be entirely lifted after five years. No such foreign ownership limit is in place for foreign non-life insurance companies operating in China. Ironically, AIA Group is the only foreign life insurance company that is currently allowed to wholly own its China unit as a result of negotiations when China joined the WTO in 2001. Source - RBC Wealth Management, Bloomberg; data through 11/16/17 Government intervention and rising yields cool Chinese housing market 2.5% 2.7% 2.9% 3.1% 3.3% 3.5% 3.7% 3.9% 4.1% 4.3% -10% 0% 10% 20% 30% 40% 50% 60% 70% Sep'14 Sep'15 Sep'16 Sep'17 New home sales value (left axis) China 10Y yield (right axis)
  • 5. 5 | Global Insight Weekly November 16, 2017 | RBC Wealth Management Data as of November 16, 2017 Source - Bloomberg. Note: Equity returns do not include dividends, except for the German DAX and Brazilian Ibovespa. Bond yields in local currencies. Copper Index data and U.S. fixed income returns as of Wednesday’s close. Dollar Index measures USD vs. six major currencies. Currency rates reflect market convention (CAD/USD is the exception). Currency returns quoted in terms of the first currency in each pairing. Data as of 8:36 pm GMT 11/16/17. Examples of how to interpret currency data: CAD/USD 0.78 means 1 Canadian dollar will buy 0.78 U.S. dollar. CAD/USD 5.4% return means the Canadian dollar rose 5.4% vs. the U.S. dollar year to date. USD/JPY 113.03 means 1 U.S. dollar will buy 113.03 yen. USD/JPY -3.4% return means the U.S. dollar fell 3.4% vs. the yen year to date. Commodities (USD) Price MTD YTD 1 yr 2 yr Gold (spot $/oz) 1,278.58 0.6% 11.0% 4.4% 18.1% Silver (spot $/oz) 17.08 2.2% 7.3% 0.6% 19.9% Copper ($/metric ton) 6,736.25 -1.2% 22.0% 24.2% 43.5% Oil (WTI spot/bbl) 55.14 1.4% 2.6% 21.0% 32.1% Oil (Brent spot/bbl) 61.36 0.0% 8.0% 31.6% 37.7% Natural Gas ($/mmBtu) 3.08 6.2% -17.4% 11.3% 29.0% Govt bonds (bps chg) Yield MTD YTD 1 yr 2 yr U.S. 10-Yr Tsy 2.372% -0.8 -7.3 14.9 10.4 Canada 10-Yr 1.972% 2.1 25.1 46.5 32.2 U.K. 10-Yr 1.309% -2.3 7.0 -7.4 -63.0 Germany 10-Yr 0.376% 1.3 16.8 7.9 -15.4 Fixed Income (returns) Yield MTD YTD 1 yr 2 yr U.S. Aggregate 2.64% 0.1% 3.3% 2.8% 6.0% U.S. Invest Grade Corp 3.25% -0.3% 5.3% 5.3% 11.5% U.S. High Yield Corp 5.97% -1.3% 6.0% 8.9% 20.7% Currencies Rate MTD YTD 1 yr 2 yr U.S. Dollar Index 93.9070 -0.7% -8.1% -6.5% -5.6% CAD/USD 0.7840 1.1% 5.4% 5.4% 4.5% USD/CAD 1.2756 -1.0% -5.1% -5.1% -4.3% EUR/USD 1.1771 1.1% 11.9% 10.1% 10.2% GBP/USD 1.3193 -0.7% 6.9% 6.0% -13.2% AUD/USD 0.7590 -0.9% 5.3% 1.5% 7.0% USD/JPY 113.0300 -0.5% -3.4% 3.6% -8.2% EUR/JPY 133.0600 0.5% 8.2% 14.1% 1.1% EUR/GBP 0.8922 1.8% 4.5% 3.8% 26.9% EUR/CHF 1.1700 0.7% 9.1% 9.2% 8.4% USD/SGD 1.3562 -0.5% -6.3% -4.2% -4.7% USD/CNY 6.6303 -0.1% -4.5% -3.6% 4.1% USD/MXN 19.0470 -0.5% -8.1% -5.7% 13.6% USD/BRL 3.2775 0.2% 0.7% -4.3% -14.2% MARKET SCORECARD Equities (local currency) Level MTD YTD 1 yr 2 yr S&P 500 2,585.64 0.4% 15.5% 18.8% 25.9% Dow Industrials (DJIA) 23,458.36 0.3% 18.7% 24.3% 34.2% NASDAQ 6,793.29 1.0% 26.2% 28.3% 36.3% Russell 2000 1,486.88 -1.1% 9.6% 14.2% 28.6% S&P/TSX Comp 15,935.37 -0.6% 4.2% 8.2% 19.7% FTSE All-Share 4,056.40 -1.5% 4.7% 10.4% 20.0% STOXX Europe 600 384.93 -2.6% 6.5% 13.7% 3.9% EURO STOXX 50 3,564.80 -3.0% 8.3% 17.8% 6.0% Hang Seng 29,018.76 2.7% 31.9% 30.2% 31.8% Shanghai Comp 3,399.25 0.2% 9.5% 6.1% -5.8% Nikkei 225 22,351.12 1.5% 16.9% 25.1% 15.2% India Sensex 33,106.82 -0.3% 24.3% 25.9% 28.5% Singapore Straits Times 3,341.30 -1.0% 16.0% 19.6% 14.6% Brazil Ibovespa 72,511.79 -2.4% 20.4% 19.3% 54.8% Mexican Bolsa IPC 47,747.69 -1.8% 4.6% 6.3% 9.5%
  • 6. 6 | Global Insight Weekly November 16, 2017 | RBC Wealth Management Authors Analyst Certification All of the views expressed in this report accurately reflect the personal views of the responsible analyst(s) about any and all of the subject securities or issuers. No part of the compensation of the responsible analyst(s) named herein is, or will be, directly or indirectly, related to the specific recommendations or views expressed by the responsible analyst(s) in this report. Important Disclosures In the U.S., RBC Wealth Management operates as a division of RBC Capital Markets, LLC. In Canada, RBC Wealth Management includes, without limitation, RBC Dominion Securities Inc., which is a foreign affiliate of RBC Capital Markets, LLC. This report has been prepared by RBC Capital Markets, LLC. which is an indirect wholly-owned subsidiary of the Royal Bank of Canada and, as such, is a related issuer of Royal Bank of Canada. Non-U.S. Analyst Disclosure: Diana Di Luca and Jay Roberts, employees of RBC Wealth Management USA’s foreign affiliate RBC Dominion Securities Inc.; and Frédérique Carrier and Thomas McGarrity, employees of RBC Wealth Management USA’s foreign affiliate Royal Bank of Canada Investment Management (U.K.) Limited; contributed to the preparation of this publication. These individuals are not registered with or qualified as research analysts with the U.S. Financial Industry Regulatory Authority (“FINRA”) and, since they are not associated persons of RBC Wealth Management, they may not be subject to FINRA Rule 2241 governing communications with subject companies, the making of public appearances, and the trading of securities in accounts held by research analysts. In the event that this is a compendium report (covers six or more companies), RBC Wealth Management may choose to provide important disclosure information by reference. To access current Tom Garretson, CFA – Minneapolis, United States tom.garretson@rbc.com; RBCCapital Markets, LLC Bill Kuehn – Minneapolis, United States william.kuehn@rbc.com; RBCCapital Markets, LLC Sam Renikoff – Minneapolis, United States sam.renikoff@rbc.com; RBCCapital Markets, LLC Diana Di Luca – Toronto, Canada diana.diluca@rbc.com; RBC Dominion Securities Inc. Frédérique Carrier – London, United Kingdom frederique.carrier@rbc.com; Royal Bank of Canada Investment Management (U.K.) Ltd. Thomas McGarrity, CFA – London, United Kingdom thomas.mcgarrity@rbc.com; Royal Bank of Canada Investment Management (U.K.) Ltd. Jay Roberts – Hong Kong, China jay.roberts@rbc.com; RBC Dominion Securities Inc. D isclosures and Disclaimer disclosures, clients should refer to http://www.rbccm.com/ GLDisclosure/PublicWeb/DisclosureLookup.aspx?EntityID=2 to view disclosures regarding RBC Wealth Management and its affiliated firms. Such information is also available upon request to RBC Wealth Management Publishing, 60 South Sixth St, Minneapolis, MN 55402. References to a Recommended List in the recommendation history chart may include one or more recommended lists or model portfolios maintained by RBC Wealth Management or one of its affiliates. RBC Wealth Management recommended lists include the Guided Portfolio: Prime Income (RL 6), the Guided Portfolio: Dividend Growth (RL 8), the Guided Portfolio: ADR (RL 10), and the Guided Portfolio: All Cap Growth (RL 12), and former lists called the Guided Portfolio: Large Cap (RL 7), the Guided Portfolio: Midcap 111 (RL 9), and the Guided Portfolio: Global Equity (U.S.) (RL 11). RBC Capital Markets recommended lists include the Strategy Focus List and the Fundamental Equity Weightings (FEW) portfolios. The abbreviation ‘RL On’ means the date a security was placed on a Recommended List. The abbreviation ‘RL Off’ means the date a security was removed from a Recommended List. Distribution of Ratings For the purpose of ratings distributions, regulatory rules require member firms to assign ratings to one of three rating categories - Buy, Hold/Neutral, or Sell - regardless of a firm’s own rating categories. Although RBC Capital Markets, LLC ratings of Top Pick (TP)/Outperform (O), Sector Perform (SP) and Underperform (U) most closely correspond to Buy, Hold/Neutral and Sell, respectively, the meanings are not the same because our ratings are determined on a relative basis (as described below). Explanation of RBC Capital Markets, LLC Equity Rating System An analyst’s “sector” is the universe of companies for which the analyst provides research coverage. Accordingly, the rating assigned to a particular stock represents solely the analyst’s view of how that stock will perform over the next 12 months relative to the analyst’s sector average. Although RBC Capital Markets, LLC ratings of Top Pick (TP)/Outperform (O), Sector Perform (SP), and Underperform (U) most closely correspond to Buy, Hold/Neutral and Sell, respectively, the meanings are not the same because our ratings are determined on a relative basis (as described below). Ratings: Top Pick (TP): Represents analyst’s best idea in the sector; expected to provide significant absolute total return over 12 months with a favorable risk-reward ratio. Outperform (O): Expected to materially outperform sector average over 12 months. Sector Perform (SP): Returns expected to be in line with sector average over 12 months. Underperform (U): Returns expected to be materially below sector average over 12 months. As of September 30, 2017 Rating Count Percent Count Percent Buy [Top Pick & Outperform] 859 52.92 294 34.23 Hold [Sector Perform] 660 40.67 154 23.33 Sell [Underperform] 104 6.41 7 6.73 Investment Banking Services Provided During Past 12 Months Distribution of Ratings - RBC Capital Markets, LLC Equity Research
  • 7. 7 | Global Insight Weekly November 16, 2017 | RBC Wealth Management Risk Rating: As of March 31, 2013, RBC Capital Markets, LLC suspends its Average and Above Average risk ratings. The Speculative risk rating reflects a security’s lower level of financial or operating predictability, illiquid share trading volumes, high balance sheet leverage, or limited operating history that result in a higher expectation of financial and/ or stock price volatility. Valuation and Risks to Rating and Price Target When RBC Wealth Management assigns a value to a company in a research report, FINRA Rules and NYSE Rules (as incorporated into the FINRA Rulebook) require that the basis for the valuation and the impediments to obtaining that valuation be described. Where applicable, this information is included in the text of our research in the sections entitled “Valuation” and “Risks to Rating and Price Target”, respectively. The analyst(s) responsible for preparing this research report received compensation that is based upon various factors, including total revenues of RBC Capital Markets, LLC, and its affiliates, a portion of which are or have been generated by investment banking activities of the member companies of RBC Capital Markets, LLC and its affiliates. Other Disclosures Prepared with the assistance of our national research sources. RBC Wealth Management prepared this report and takes sole responsibility for its content and distribution. The content may have been based, at least in part, on material provided by our third-party correspondent research services. Our third-party correspondent has given RBC Wealth Management general permission to use its research reports as source materials, but has not reviewed or approved this report, nor has it been informed of its publication. Our third-party correspondent may from time to time have long or short positions in, effect transactions in, and make markets in securities referred to herein. Our third-party correspondent may from time to time perform investment banking or other services for, or solicit investment banking or other business from, any company mentioned in this report. RBC Wealth Management endeavors to make all reasonable efforts to provide research simultaneously to all eligible clients, having regard to local time zones in overseas jurisdictions. In certain investment advisory accounts, RBC Wealth Management will act as overlay manager for our clients and will initiate transactions in the securities referenced herein for those accounts upon receipt of this report. These transactions may occur before or after your receipt of this report and may have a short-term impact on the market price of the securities in which transactions occur. RBC Wealth Management research is posted to our proprietary Web sites to ensure eligible clients receive coverage initiations and changes in rating, targets, and opinions in a timely manner. Additional distribution may be done by sales personnel via e-mail, fax, or regular mail. Clients may also receive our research via third-party vendors. Please contact your RBC Wealth Management Financial Advisor for more information regarding RBC Wealth Management research. Conflicts Disclosure: RBC Wealth Management is registered with the Securities and Exchange Commission as a broker/dealer and an investment adviser, offering both brokerage and investment advisory services. RBC Wealth Management’s Policy for Managing Conflicts of Interest in Relation to Investment Research is available from us on our Web site at http://www.rbccm.com/GLDisclosure/PublicWeb/ DisclosureLookup.aspx?EntityID=2. Conflicts of interests related to our investment advisory business can be found in Part II of the Firm’s Form ADV or the Investment Advisor Group Disclosure Document. Copies of any of these documents are available upon request through your Financial Advisor. We reserve the right to amend or supplement this policy, Part II of the ADV, or Disclosure Document at any time. The authors are employed by one of the following entities: RBC Wealth Management USA, a division of RBC Capital Markets, LLC, a securities broker-dealer with principal offices located in Minnesota and New York, USA; by RBC Dominion Securities Inc., a securities broker-dealer with principal offices located in Toronto, Canada; by RBC Investment Services (Asia) Limited, a subsidiary of RBC Dominion Securities Inc., a securities broker-dealer with principal offices located in Hong Kong, China; and by Royal Bank of Canada Investment Management (U.K.) Limited, an investment management company with principal offices located in London, United Kingdom. Research Resources This document is produced by the Global Portfolio Advisory Committee within RBC Wealth Management’s Portfolio Advisory Group. The RBC WM Portfolio Advisory Group provides support related to asset allocation and portfolio construction for the firm’s Investment Advisors / Financial Advisors who are engaged in assembling portfolios incorporating individual marketable securities. The Committee leverages the broad market outlook as developed by the RBC Investment Strategy Committee, providing additional tactical and thematic support utilizing research from the RBC Investment Strategy Committee, RBC Capital Markets, and third-party resources. Third-party disclaimers The Global Industry Classification Standard (“GICS”) was developed by and is the exclusive property and a service mark of MSCI Inc. (“MSCI”) and Standard & Poor’s Financial Services LLC (“S&P”) and is licensed for use by RBC. Neither MSCI, S&P, nor any other party involved in making or compiling the GICS or any GICS classifications makes any express or implied warranties or representations with respect to such standard or classification (or the results to be obtained by the use thereof), and all such parties hereby expressly disclaim all warranties of originality, accuracy, completeness, merchantability and fitness for a particular purpose with respect to any of such standard or classification. Without limiting any of the foregoing, in no event shall MSCI, S&P, any of their affiliates or any third party involved in making or compiling the GICS or any GICS classifications have any liability for any direct, indirect, special, punitive, consequential or any other damages (including lost profits) even if notified of the possibility of such damages. References herein to “LIBOR”, “LIBO Rate”, “L” or other LIBOR abbreviations means the London interbank offered rate as administered by ICE Benchmark Administration (or any other person that takes over the administration of such rate). Disclaimer The information contained in this report has been compiled by RBC Wealth Management, a division of RBC Capital Markets, LLC, from sources believed to be reliable, but no representation or warranty, express or implied, is made by Royal Bank of Canada, RBC Wealth Management, its affiliates or any other person as to its accuracy, completeness or correctness. All opinions and estimates contained in this report constitute RBC Wealth Management’s judgment as of the date of this report, are subject to change without notice and are provided in good faith but without legal responsibility. Past performance is not a guide
  • 8. 8 | Global Insight Weekly November 16, 2017 | RBC Wealth Management to future performance, future returns are not guaranteed, and a loss of original capital may occur. Every province in Canada, state in the U.S., and most countries throughout the world have their own laws regulating the types of securities and other investment products which may be offered to their residents, as well as the process for doing so. As a result, the securities discussed in this report may not be eligible for sale in some jurisdictions. This report is not, and under no circumstances should be construed as, a solicitation to act as securities broker or dealer in any jurisdiction by any person or company that is not legally permitted to carry on the business of a securities broker or dealer in that jurisdiction. Nothing in this report constitutes legal, accounting or tax advice or individually tailored investment advice. This material is prepared for general circulation to clients, including clients who are affiliates of Royal Bank of Canada, and does not have regard to the particular circumstances or needs of any specific person who may read it. The investments or services contained in this report may not be suitable for you and it is recommended that you consult an independent investment advisor if you are in doubt about the suitability of such investments or services. To the full extent permitted by law neither Royal Bank of Canada nor any of its affiliates, nor any other person, accepts any liability whatsoever for any direct or consequential loss arising from any use of this report or the information contained herein. No matter contained in this document may be reproduced or copied by any means without the prior consent of Royal Bank of Canada. Additional information is available upon request. To U.S. Residents: This publication has been approved by RBC Capital Markets, LLC, Member NYSE/FINRA/SIPC, which is a U.S. registered broker-dealer and which accepts responsibility for this report and its dissemination in the United States. RBC Capital Markets, LLC, is an indirect wholly-owned subsidiary of the Royal Bank of Canada and, as such, is a related issuer of Royal Bank of Canada. Any U.S. recipient of this report that is not a registered broker-dealer or a bank acting in a broker or dealer capacity and that wishes further information regarding, or to effect any transaction in, any of the securities discussed in this report, should contact and place orders with RBC Capital Markets, LLC. International investing involves risks not typically associated with U.S. investing, including currency fluctuation, foreign taxation, political instability and different accounting standards. To Canadian Residents: This publication has been approved by RBC Dominion Securities Inc. RBC Dominion Securities Inc.* and Royal Bank of Canada are separate corporate entities which are affiliated. *Member-Canadian Investor Protection Fund. ®Registered trademark of Royal Bank of Canada. Used under license. RBC Wealth Management is a registered trademark of Royal Bank of Canada. Used under license. RBC Wealth Management (British Isles): This publication is distributed by Royal Bank of Canada Investment Management (U.K.) Limited and RBC Investment Solutions (CI) Limited. Royal Bank of Canada Investment Management (U.K.) Limited is authorised and regulated by the Financial Conduct Authority (Reference number: 146504). Registered office: Riverbank House, 2 Swan Lane , London, EC4R 3BF, UK. RBC Investment Solutions (CI) Limited is regulated by the Jersey Financial Services Commission in the conduct of investment business in Jersey. Registered office: Gaspé House, 66-72 Esplanade, St Helier, Jersey JE2 3QT, Channel Islands, registered company number 119162. To Hong Kong Residents: This publication is distributed in Hong Kong by Royal Bank of Canada, Hong Kong Branch which is regulated by the Hong Kong Monetary Authority and the Securities and Futures Commission (‘SFC’), and RBC Investment Services (Asia) Limited, which is regulated by the SFC. Financial Services provided to Australia: Financial services may be provided in Australia in accordance with applicable law. Financial services provided by the Royal Bank of Canada, Hong Kong Branch are provided pursuant to the Royal Bank of Canada’s Australian Financial Services Licence (‘AFSL’) (No. 246521). To Singapore Residents: This publication is distributed in Singapore by the Royal Bank of Canada, Singapore Branch, a registered entity granted offshore bank licence by the Monetary Authority of Singapore. This material has been prepared for general circulation and does not take into account the objectives, financial situation, or needs of any recipient. You are advised to seek indepen- dent advice from a financial adviser before purchasing any product. If you do not obtain independent advice, you should consider whether the product is suitable for you. Past performance is not indicative of future performance. If you have any questions related to this publication, please contact the Royal Bank of Canada, Singapore Branch. Royal Bank of Canada, Singapore Branch accepts responsibility for this report and its dissemination in Singapore. © RBC Capital Markets, LLC 2017 - Member NYSE/FINRA/SIPC © RBC Dominion Securities Inc. 2017 - Member Canadian Investor Protection Fund © RBC Europe Limited 2017 © Royal Bank of Canada 2017 All rights reserved RBC1253