1. INDUSTRY | COMMENT
APRIL 7, 2011
Media's New Opportunities From Old Threats
Deep Dive Into Content And Current Fundamentals
In Media And Advertising
Online Video Distributors (Most notably Netflix) Increasingly Appear To
Be A Highly Effective Monetization Vehicle Of Under-Exploited Content
• Not only were the initial concerns regarding OTT probably over stated, but
the potential upside from them was probably materially under-stated.
There Is A New Opportunity To Monetize What Has Historically Been
Undermonetized In Syndication: Serialized Drama and/or
Non-Fiction—OTT now offers potential upside to media conglomerates that
have not monetized original content in secondary windows, as well as the
players who have historically not played in the global syndication game –
most notably Viacom’s MTV, Discovery and Scripps.
Traditional Scripted Players Can Drive Upside From Tonnage
Deals—Best opportunities that balance optimal monetization of alternative
OTT distribution opportunities and cannibalization concerns for traditional
scripted TV content producers are probably still in tonnage (lots of titles, but
largely tail-oriented with little exploitable value in current ecosystem).
• Players like Disney, News Corp. and Time Warner should benefit for the
next several years exploiting previously “spent” libraries.
Given The Economics Of Content, The Consumer Probably Garners
More Value From OTT Content As A Complement Rather Than A
Replacement For The Existing Ecosystem
• The existing TV ecosystem invests ~$30bn/year in TV programming
content versus ~$1bn in streaming content acquisition costs for the largest
(and only meaningful) online subscription video distributor in 2012.
• We think most consumers should/would be reluctant to pay 20% of the cost
for an online video subscription (which assumes no increased subscription
or broadband costs), for just ~3% of the content investment benefit.
In The Broad Context Of Broadcast Content Investments,
Retransmission Consent And Especially Reverse Network Compensation
Appear To Be A Relative Bargain—The cost of programming for a
broadcast network runs in the ~$4bn range annually. Broadcast networks with
larger O&O groups (Fox and CBS), who provide content to ~55% of the
country through non O&O stations, are receiving only ~$10mm/month or
~$120mm/year at ~$0.20 per sub, while the smaller O&O operators such as
ABC and NBC will ultimately be receiving closer to $240mm/year.
Uncertainty Surrounding The NFL Lock-out Turns The Upfront Process
Into A Game Of 5-Dimensional Chess With The Advantage Initially
Going To Network Sellers
• Advertisers will likely have to plan for no NFL season, despite expectations
there will be a season.
• This will cause a feeding frenzy with respect to remaining GRPs (because
NFL represents ~10-20% of M18-49 GRPs during calendar 4Q).
• If the work stoppage is resolved between the time the upfronts “break” and
when they are actually “inked” (the hold period), the scatter market could
be negatively impacted.
Priced as of prior trading day's market close, EST (unless otherwise noted).
All values in USD unless otherwise noted.
RBC Capital Markets, LLC
David Bank (Analyst)
(212) 858-7333; david.bank@rbccm.com
Ross Sandler (Analyst)
(212) 428-6227; ross.sandler@rbccm.com
Ryan Vineyard (Analyst)
(212) 428-6489; ryan.vineyard@rbccm.com
Sun-Il (Sean) Kim (Associate)
(212) 428-2363; sean.kim@rbccm.com
Andre Sequin (Associate)
(212) 618-7688; andre.sequin@rbccm.com
Whitney Goldstein (Associate)
(212) 428-6412; whitney.goldstein@rbccm.com
Companies Previewed:
The Walt Disney Company (NYSE: DIS; $42.27,
Outperform, Average Risk)
Discovery Communications Inc. (NASDAQ:
DISCA; $40.33, Outperform, Average Risk)
News Corporation (NASDAQ: NWSA; $17.56,
Outperform, Average Risk
Scripps Networks Interactive, Inc. (NYSE: SNI;
$51.02, Outperform, Average Risk)
Time Warner Inc. (NYSE: TWX; $36.24,
Outperform, Average Risk)
Viacom Inc. (NYSE: VIA.B; $47.36, Outperform,
Average Risk)
Interpublic Group of Companies (NYSE: IPG;
$12.41, Outperform, Above Average Risk)
MDC Partners Inc. (NASDAQ: MDCA; $16.95,
Outperform, Speculative Risk)
Omnicom Group Inc. (NYSE: OMC; $48.76;
Outperform, Speculative Risk)
For Required Conflicts Disclosures, see Page 100.
2. 2
Table of Contents
Key Industry Investment Themes ..........................................................................................................................................................3
Broader Media/Advertising Agency Industry Update and Channel Checks......................................................................................5
The Modern Franchise Procedural and How It Changed Syndication (And the Economics of TV)..........................................................6
Broadcast Network Content Cost Structure Differs from Cable Network Content Cost Structure Due to Both Total Cost per
Hour and Total Hours of Original Content Run.......................................................................................................................................10
How Original Content Is Priced...............................................................................................................................................................16
Each of the Major Media Conglomerates Create TV Content for Their Own Platforms and Others.......................................................17
How Does a TV Show Get to Profitability? 100 Episodes Is the Magic Number....................................................................................18
Monetizing Primetime Content................................................................................................................................................................24
The Difference between Pricing on a Production-by-Production Basis Versus a Packaged Channel – Unbundled Content Is
Expensive for the Consumer and a Tough Proposition for the Content Providers...................................................................................30
Many Networks Have Historically Lost Money on Advertising Alone – That Is Why They Have Affiliate Fees – But the
Prospect of Paying Affiliate Fees Based on Viewership Rather than on Total Subscribers Is Where the Proposition Becomes
Less Clear ................................................................................................................................................................................................34
What Is the Value Proposition to the Consumer of the Current Ecosystem? What if Over-The-Top Providers Can Offer More
Non-linear, Video-On-Demand Content than Any (or Many) Linear Channel, but for a High-Single Digit Monthly Subscription
Fee?..........................................................................................................................................................................................................36
Reverse Compensation and the Cost of Content......................................................................................................................................38
Network TV Pricing Trend – Proprietary Upfront/Scatter Pricing Trend Analysis Indicates Viacom and Discovery Have the
Most Tailwind and Scripps Has the Most Headwind as 2011 Progresses................................................................................................39
NFL Lockout and the Upcoming Upfronts ..............................................................................................................................................46
Network TV Ratings Update – Surprise! Cable Taking Viewership Share From Broadcast...................................................................48
Network TV Market Update – More Of The Same With Pricing Hot And Inventory Scarce .................................................................50
Local/Spot TV Market Update.................................................................................................................................................................51
2011 Box Office Season – Starting The Year With A Whimper…Not Expecting Much Until The Summer .........................................53
Large-cap Media Company Notes........................................................................................................................................................57
The Walt Disney Company (NYSE: DIS).................................................................................................................................60
Discovery Communications Inc. (NASDAQ: DISCA) .............................................................................................................66
News Corporation (NASDAQ: NWSA)....................................................................................................................................69
Scripps Networks Interactive, Inc. (NYSE: SNI) ......................................................................................................................74
Time Warner Inc. (NYSE: TWX) .............................................................................................................................................78
Viacom Inc. (NYSE: VIA.B).....................................................................................................................................................83
Advertising Agencies Company Notes .................................................................................................................................................87
Interpublic Group of Companies (NYSE: IPG).........................................................................................................................90
MDC Partners Inc. (NASDAQ: MDCA)...................................................................................................................................94
Omnicom Group Inc. (NYSE: OMC)........................................................................................................................................97
Media's New Opportunities From Old ThreatsApril 7, 2011
3. 3
Key Industry Investment Themes
The First Window In Media Is The Least Profitable; Rather Media Companies Rely On All The Windows That Come After It.
The existing broadcast network ecosystem (and increasingly the cable network ecosystem as well) are driven by viewership for
original programming. But that programming (on its first run) tends to be the lowest-margin proposition for premium media. Rather,
by taking the first window (broadcast network viewership) and “breaking” a show, producers can monetize the show in domestic,
international, and even online syndication as well as home video (both in sell-through and electronic sell-through). Historically, online
monetization has been a window that lagged all the others (with subscription-driven consumption all but unheard of before the past
one or two years), but the lure of big money and the reality of consumer behavior have put forces on media producers to move the
online window after first-run forward.
Media Conglomerates Are Massively Benefiting From The Syndication Of Content To Cable Channels. Approximately 65% of
all cable channel content (remember there are ~100 channels distributed in 50mm homes or more) are from acquired (primarily off
network syndication) rather than original programming. This means that the cable channel business supplies content producers with
~$13bn worth of content sales annually, that are, on an economic basis, incredibly high margin (since they represent the re-sale of
content that has generally already been produced for a prior broadcast network run). Though disruption to the existing ecosystem could
make these revenue streams more vulnerable, we don’t see much danger in the near- to-intermediate term.
Online Video Distributors (Most notably Netflix) Increasingly Appears To Be A Profitable Source Of Incremental
Monetization Of Otherwise Under-Exploited Content. Not only were the initial concerns over selling content to new sources of
distribution probably over stated, but the potential upside afforded by them was probably materially under-stated. Most content likely
to be monetized is a “melting ice cube” anyway, with little by way of residual value left in the traditional market (few meaningful
syndication opportunities for TV). For instance, in CBS’s recent Netflix deal (Netflix paying CBS, according to press reports,
~$150mm per year) CBS is merely monetizing content that had largely been available on off net syndication as well as for free on
CBS.com. The pace of cannibalization of existing highly monetizable revenue streams in traditional first run and global syndication
windows is probably not impacted by current deals (short term in nature). In the long-run, the consumer will likely shift some
viewership to other, non-traditional platforms, regardless of near-term incremental distribution deals, but the ecosystem will
likely migrate structurally such that incumbent players will benefit more than we initially assumed.
The Evolving Landscape Is Offering Up New Opportunities To Monetize What Has Historically Been Under-monetized In
Syndication: Serialized Drama and/or Non-Fiction; It’s Providing Yet Another Outlet For Traditionally Syndicatable Content
To Be Re-Monetized. The best opportunities that balance optimal windowing versus monetization alternative OTT distribution are
probably still in tonnage (lots of titles, but largely tail-oriented content with little exploitable value in the current ecosystem). Most
non-fiction (traditionally categorized as reality, or unscripted, though they are really neither) hasn’t been monetized in the aftermarket.
OTT offers a new buyer and potential upside to media conglomerates that have not monetized original content in secondary windows
as well as the players who have historically not played in the global syndication game – most notably Viacom’s MTV, Discovery and
Scripps. In addition, traditional content suppliers to syndication such as Disney, News Corp. and even Time Warner, which has been
the most vocal about not doing broader deals with alternative OTT providers for content, have material potential opportunities to
monetize unexploited archives that are unlikely to cannibalize existing viewership.
We Don’t Think The Traditional Broadcast Networks Are In Much Danger Of Being Displaced As The Primary Sources Of
High-Priced Syndicated Content By Cable Networks, Despite More Original Content Being Programmed On Cable Networks
(Or Even Emerging OTT Providers). While many of the larger cable networks are starting to program far more original
programming, it is still a relative drop-in-the-bucket, in terms of hours per week versus the big broadcast networks. Further, much of
that original content is non-fiction-oriented, which tends to syndicate poorly. Of the fiction-oriented content, that is potentially more
viable for syndication, the cable networks tend to run seasons of only ~9-10 episodes. Big ticket syndication requires a minimum of
approximately 60 episodes to be viable, so it will take approximately six years for many of them to reach viable syndication levels (a
feat few shows perform). Finally, procedural content is by far the best suited to global syndication (with serialized dramas, even
successful ones in first run, being very difficult to syndicate domestically) and much of the cable original drama content is more
serialized versus procedural.
The Current Ecosystem Provides Syndication Content With A Search-And-Discovery Mechanism That Drives Demand For
Content. In alternative mechanism for distribution (say, OTT), content could have a solid source of demand. However, if the balance
of viewership shifts too far to the alternative distribution mechanism, it will be increasingly difficult to differentiate content in a way
that can drive premium pricing for content. While there will likely be a willingness to pay for certain high profile content (such as the
recent Kevin Spacey/David Fincher House of Cards production), without a mass reach exposure to drive search-and-discovery, the
demand for such content could be limited.
Consumer Behavior Is Pushing For Alternative Distribution Platforms Primarily Because They Offer Unbundled Content
Cheaper, Rather Than Due To A Desire To Watch Content On Different Screens. Clearly, the consumer has made it clear that
there is a desire for access to TV content on all media distribution platforms (most notably online) as opposed to traditional
Media's New Opportunities From Old ThreatsApril 7, 2011
4. 4
linear/VOD access on cable through a living room television. Increasingly though, online content will be available through smart TV
applications (Netflix is addressable through the Blu-ray player, as well as Samsung TVs, for instance). Initially, it seems as though in
return for access across all platforms, some consumers might be willing to trade a broader library of choices available primarily on a
traditional basis for a narrower (but good enough) library wholly on-demand through any screen. In the long run, the broader system
will be starved of more premium content that a more fragmented distribution system simply can’t be monetized as effectively, and the
consumer could end up moving back the other way, if it means more and better content availability.
The Consumer Pays More For Content Under The Current Ecosystem Than He/She Would In An Alternative System, But
The Sheer Volume Of Content Available Creates Massive Consumer Benefits And We Think The Consumer Would Choose
More Content Over Less. The existing TV ecosystem invests ~$30bn per year in TV programming content. We believe investors
expect ~$1bn in streaming content acquisition costs for the largest (and only meaningful) online subscription video distributor. While
there is at least some small portion of the consumer market that would be net ahead (paying less to consume the small amount of
content they desire), the big question remains, would the vast majority of consumer rather pay 20% of the cost for an online video
subscription (and this is assuming no increased subscription costs), for ~3% of the content investment benefit?
We Do Not Think Consumers Will Be Fooled By Tonnage: OTT Providers Are Getting More Titles And More Scale, But They
Are No Substitute For First Run Premium Content. For today, we suspect new entrants such as Netflix, Amazon, Google, etc. will
seek to buy available content if for nothing else than pure library tonnage. With ~70% of Netflix streaming viewership reportedly
being TV content, it’s become increasingly important to supply the OTT ecosystem with as much of that product as economically
possible. From a pure marketing perspective, we suspect the OTT ecosystem is willing to pay for tonnage (lots of somewhat
recognizable titles) even if they are on a non-exclusive basis and even if they lag years behind in terms of window parity with current
TV. There is some flagship content that is necessary, but the TV tail is important if for nothing else than marketing.
It’s More Difficult To Monetize Non-Fiction Content In Syndication, But Format/Ancillary Opportunities Can Be Compelling.
Very few producers have successfully monetized non-fiction (sometimes referred to as unscripted, sometimes as reality programming,
but in actuality, it’s often neither) programming anywhere outside of on-network domestic platforms. Non-scripted content is often
culturally contextual (though Discovery Channel has had some real success crossing over internationally with content intact).
However, some producers have been able to use formats (sold in the international markets to local producers) and ancillary
opportunities (consumer branded products or other licensing opportunities) to drive high margin revenues.
While The Consumer May Continue To Push For Unbundled Content, The Underlying Economics Of The Industry Don’t
Support Unbundled Channels, Let Alone Content. On a per viewer basis, over 50% of the existing ~100 widely distributed digital
basic channels would simply not be viable given current economics parameters of subscription TV. The channels with more mass
reach probably work on an unbundled basis, but the rest simply do not.
In The Broad Context Of Content Investments By Broadcast Investments, Retransmission Consent And Especially Reverse
Network Compensation Appears To Be A Relative Bargain. While the broadcast networks invest ~$4bn annually in programming
expenses versus a top 10 cable network ~$500mm, they earn roughly the same monthly affiliate fees. Further, the average affiliate fee
only covers ~25-55% of the total affiliate base, bringing in 25- 50% of the “effective” affiliate base. While the networks could capture
more of that affiliate revenue through reverse compensation, the ~$0.20 per subscriber currently sought by most network affiliates
effectively generates ~33% of the affiliate fee per subscriber versus ~6x the investment in programming. Furthermore, providing $4bn
of programming investment in return for ~$120-240mm of reverse compensation offers an incredibly compelling proposition for the
affiliates to program their stations. They simply couldn’t acquire anything close to the amount of premium first run programming that
they receive from their network partners in return for that small of a programming investment.
There Will Likely Be A Bigger Market For Content, But It’s Unclear That Fragmentation Will Increase The Value Of The
Type Of Content That Currently Provides The Bulk Of Profitability. In the existing ecosystem, the biggest advantage in the
media business is arguably the ownership of content. But not all content is created equally. As the market for media consumption
continues to fragment, there will be an increasing number of distribution channels for content. But, precisely because of the
fragmentation, the price that any individual distribution channel can pay for that content is likely to decline.
Media's New Opportunities From Old ThreatsApril 7, 2011
5. 5
Broader Media/Advertising Agency Industry Update and Channel Checks
Uncertainty Surrounding the NFL Lockout Will Likely Further Shift the Balance of Power Toward Networks in the Upfronts,
and Turns the Process Into a Game Of Five-Dimensional Chess. Advertisers will likely have to plan as if there is no NFL season,
despite their general belief (and ours) that there will be a full season (or close to it). This will cause a feeding frenzy with respect to
remaining GRPs (because NFL represents ~10%-20% of male 18-49 ratings points in C4Q). Other male 18-49 targeted networks and
programs (i.e. college sports) will likely be the beneficiaries. If the work stoppage is resolved between the time the upfronts “break”
and when they are actually “inked” (the hold period), the scatter market could be impacted negatively.
The Current National Advertising Environment Remains Incredibly Robust and Continued Broadcast Ratings Softness Has
Led to Another Inventory Shortage. Our channel checks indicate that few cancellation options have been taken heading into C2Q11.
Key categories (most notably auto) appear to be holding up well despite increasing caution. We are keeping an eye on commodities-
reliant categories (most prominently consumer packaged goods, which could easily pull back advertising spend if there is a need to cut
costs in light of higher cost of goods sold) as well as tech and telecom in light of the consolidation of AT&T and T-Mobile. For now
though, the market appears broad and deep. Scatter pricing trends remain very healthy, though scatter-over-scatter comps are going to
get much more difficult heading into C2H11.
Cable Channels Took Back Share This Quarter, Giving Greater Credibility to Our Secular Bull Thesis on Cable Networks. In
terms of the broadcast networks, the biggest success story in C1Q11 was probably Fox as American Idol ratings accelerated beyond
expectations after the first few weeks of the season, driving +2% primetime ratings growth (though this included the Super Bowl). The
biggest successes on the cable network side remained the juggernaut at Viacom, which, if not for the shifting of the Kids Choice
Awards to April from March in the prior year, might have been in contention for industry-level domestic advertising growth. MTV
ratings were up ~60% in the A18-34 demo in primetime. Disney’s portfolio was greatly aided by ESPN up ~39% in primetime for
A18-49, helped in no small part by exploding audiences for the BCS. Additionally, FX had a very strong resurgence, which should
probably help C2Q11 results. CNN also benefited from a very strong news cycle with the tragic events in Japan and unrest in the
Middle East. Scripps remained soft as did most of the other Turner Networks, while Discovery’s ratings were mixed with flagship
Discovery Channel being relatively strong as other sister networks were soft.
Our Proprietary Upfront/Scatter Pricing Trend Analysis Indicates Viacom and Discovery Have the Most Tailwind. According
to our proprietary network TV pricing analysis (as detailed later in this report), Discovery and Viacom have the most pricing tailwind
behind them on a YoY basis; Discovery also has the best pricing profile on a sequential acceleration/deceleration-basis from C4Q10-
C3Q11. On the other hand, Scripps has the most pricing deceleration heading into the back half of 2011. We think there may have
been somewhat of a lag in the scatter pricing pickup for Viacom’s networks last year, and the particularly hot scatter market for MTV
likely did not kick in until C2H10, making comps easier in C1Q11 but more difficult in C2H11. Discovery appears to have the most
consistent scatter pricing momentum in 2010 and 2011.
Few Big Bets But Even Fewer Box Office Hits in C1Q11. The biggest bomb of the quarter was Mars Needs Moms – Disney’s
animated feature that reportedly cost ~$150mm to make and grossed ~$20mm at the domestic box office. That said, we suspect
Disney took a sizable write-off in C4Q10, in advance of the actual disappointment. On a relative basis, it’s been Paramount’s quarter,
in terms of movies that worked. Major Hollywood studios seem to have hit a slump in terms of being able to produce major hits (over
the past eight months or so), and we may have to wait until the summer to see a “turn” in fortunes. When the summer tentpole season
begins, all eyes will be on Disney’s Cars 2, which is expected to more than atone for the sins of Mars Needs Moms.
Local TV Trends Are Slowing, But Not Unexpectedly, and 2012’s Political Season Is Just Around the Corner. Anecdotally,
channel checks indicate that local TV probably ended C1Q11 up in the low-to-mid single digit range, in term of top-line growth.
Remember, the comps are extremely difficult (local was up in the 20% range a year ago) so low single-digit growth would be quite
respectable and inline with our expectations generally. In fact, we’d expect things to decelerate further into the back half of 2011,
before the inevitable political “pop” in 2012. Local economies are finally starting to demonstrate some strength, giving positive
potential for stabilization in the market longer term.
General Advertising Trends Steady Despite Some Macro-related Concerns. While there has been a fair amount of focus on
stresses to the broader global macro environment (sovereign risks in the EU rearing their ugly head again) as well as Japan and the
price of oil, the domestic market as well as many of the emerging markets have provided enough momentum to keep the outlook for
2011 organic growth looking much like 2010 growth, in the mid single-digit range. Many players on the agency side should also begin
to see a ramp up in margins (at least a modest one relative to the variable-cost nature of the agency business) as the year progresses
and the agencies achieve more benefits of scale as the recovery matures.
Media's New Opportunities From Old ThreatsApril 7, 2011
6. 6
The Modern Franchise Procedural and How It Changed Syndication (And the Economics of TV)
In 1989, a gritty New York cop drama premiered to very little fanfare. In many ways, it was a most unremarkable show. While critics
appreciated it, the show finished the season ranked 46 out of ~100 network primetime shows that year. At the time, however, we
didn’t know that Law & Order would a) run for an astounding 20 years, b) spawn another four franchises (Law & Order: Special
Victims Unit, Law & Order: Criminal Intent, Law & Order: Trial by Jury, and Law & Order: Los Angeles), and c) essentially change
the face of the economics of television as we knew it for the next several decades, possibly forever.
Law & Order heralded the advent of the modern, hour-long, drama-based, and self-contained procedural. By luck or design, it also
coincided with a moment in time when a number of niche-oriented cable channels were seeking more general market audiences and
stronger mainstream identities associated not just with situation comedies, or sitcoms, (the prevalent premium syndicated fare). The
procedural ended up being the magic ingredient.
Law & Order was a relatively novel format given its closed-ended procedural perspective and the absence of deep identity for
recurring characters. Viewers knew little about these characters; and more importantly, they didn’t need to know much about those
characters in order to follow any given episode. The episodes were all self-contained. Furthermore, with cold openings that generally
had nothing to do with the broader story, the viewer couldn’t remember if he had seen the episode before and so could get much more
easily sucked into watching a rerun.
In the decade or so prior to the premier of Law & Order, closed-ended episodic drama seemed anachronistic. The biggest legal and
cop shows of the prior decade were Hill Street Blues and L.A. Law, which were heavy on regular characters’ personal lives, inner-
office politics, and actually tended not to feature that much street or courtroom action. The project was viewed as such a long shot, in
fact, that it was designed to be cut into two half-hour episodes (the investigative half-hour and the prosecution half-hour) in case the
show was cancelled in short order so that there would be enough episodes to enter syndication earlier.
The closed-ended episodic drama format allowed for something that had eluded TV content producers since the beginning of
syndication market—the ability to exploit scripted drama off-network in a material way. A&E paid ~$150,000 per episode for the
syndication rights and really milked the show by airing it four or five times per day. Ironically, this “over exposure” made the show
even more popular, driving ratings higher for first runs on NBC. As a result, when Universal cut its second rerun deal, this time with
Turner Broadcasting's Turner Network Television (TNT), Turner agreed to a deal that would start in 2001, paying $200,000 for those
original episodes and ~$700,000 for the newer episodes.
Realizing how much value these programs could generate outside of the first run, in addition to the success they could bring in the first
run, Dick Wolf (the creator of Law & Order) sought to create other programs whose primary goal would be to find lucrative homes on
cable television in syndication. The most obvious way to approach the proposition was to design extensions from the existing
franchise. These extensions of a single franchise would give any new show a huge advantage—audience familiarity—and therefore a
ready-made, built-in viewer base.
As a result, Wolf and NBC Universal created Law & Order: Special Victims Unit, Law & Order: Criminal Intent, and Law & Order:
Los Angeles. There was another show launch—Law & Order: Trial by Jury—that was not successful. However, this was clearly the
exception rather than the rule. These franchise extensions ultimately drove higher license fees in syndication on cable than the original
show did, mainly on the USA Network.
Thus, the pattern for the franchise procedural was solidified the television industry and it would be repeated with great success,
particularly by CBS.
Media's New Opportunities From Old ThreatsApril 7, 2011
7. 7
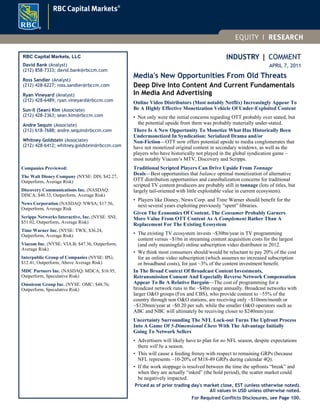
Exhibit 1: Law & Order Franchise Syndication History
$1,900 $1,900 $1,900 $1,900 $1,900 $1,900 $1,900
$1,300 $1,300 $1,300
$1,300 $1,300 $1,300 $1,300 $1,300 $1,300 $1,300
$159 $159 $159 $159 $159 $159 $159
$700 $700 $700
$700 $700 $700 $700 $700 $700 $700
0
500
1,000
1,500
2,000
2,500
3,000
3,500
4,000
4,500
1994 1995 1996 1997 1998 1999 2000 2001 2002 2003 2004 2005 2006 2007 2008 2009 2010
PricePerEpisode(in$000's)
Law & Order CI Law & Order SVU Law & Order
Source: Broadcasting and Cable, TV By The Numbers, RBC Capital Markets estimates
At around the time of the second-cycle pick-up for Law & Order, CBS and Jerry Bruckheimer must have been taking notes when they
launched CSI: Crime Scene Investigation in 2000. CSI is a similar procedural format to Law & Order (each story wrapped up neatly in
one episode with little recurring character background). CSI found a home in syndication on Spike; and when franchise extension,
CSI: New York, was launched, it went to Spike as well. CSI: Miami found a deep pocketed distributor in A&E.
Exhibit 2: CSI Franchise Syndication History
$1,900 $1,900 $1,900 $1,900 $1,900 $1,900 $1,900
$1,000
$1,000 $1,000 $1,000 $1,000 $1,000 $1,000 $1,000
$0
$1,600 $1,600
$1,600
$1,600 $1,600 $1,600 $1,600 $1,600 $1,600 $1,600
0
500
1,000
1,500
2,000
2,500
3,000
3,500
4,000
4,500
5,000
2000 2001 2002 2003 2004 2005 2006 2007 2008 2009 2010
PricePerEpisode(in$000's)
CSI New York CSI Miami CSI
Source: Broadcasting and Cable, TV By The Numbers, RBC Capital Markets estimates
Media's New Opportunities From Old ThreatsApril 7, 2011
8. 8
More similar to the path of Law & Order, CBS found another franchise extension (sort of) in JAG and its related NCIS spin-offs. JAG
was itself a military courtroom/adventure procedural. It was syndicated to USA Network in 1998, where it benefited from increased
exposure and helped drive cable ratings—a similar story to Law & Order’s. In 2003, during its eighth season, the series spawned the
spin-off, NCIS. Whereas the JAG episodes were primarily oriented on courtroom drama, NCIS is more focused on the field of criminal
investigations. This would be increasingly important for the international market where the U.S. court system is less easy to identify
with than the criminal investigation world. NCIS later produced its own spin-off, NCIS: Los Angeles, which went into syndication in a
somewhat ground-breaking deal after only airing six episodes.
Exhibit 3: JAG/NCIS Franchise Syndication History
$2,500 $2,500
$1,000 $1,000 $1,000
$1,000 $1,000
$750 $750 $750 $750 $750 $750 $750 $750
$750 $750 $750
$750 $750
0
500
1,000
1,500
2,000
2,500
3,000
3,500
4,000
4,500
1998 1999 2000 2001 2002 2003 2004 2005 2006 2007 2008 2009 2010
PricePerEpisode(in$000's)
NCIS LA NCIS JAG
Source: Broadcasting and Cable, TV By The Numbers, RBC Capital Markets estimates
As we will demonstrate later in this report, franchise procedurals are not only major syndication earners for their producers, they
provide us with the most dramatic illustration of the evolution of the market for procedurals. Procedurals, and to a lesser extent
situation comedies, generally are the engine for cable TV networks. Note, while The Mentalist is not a franchise procedural (at least
not yet), CBS recently syndicated The Mentalist for ~$2 million per episode to TNT, one of the highest prices ever paid per episode in
off-network cable syndication.
Equally as important, just as the syndication opportunity for cable took off, so did the international opportunity. While, as we show in
this report later, other types of TV content syndicated well into cable (notably situation comedies, which were monetized at similar
prices per episode as successful crime procedurals), only the procedurals sold well internationally. This was the other major change
to the landscape. We believe these types of procedurals consistently generate another ~$2 million per episode in the
international syndication market.
With this evolution, programming strategies by many of the networks changed from simply creating shows that would be hits in their
first run and earn some sort of modest return in syndication, to creating programming that would essentially feed the cable and
international off-network syndicated beast. Many producers, most notably CBS, NBC Universal, and Time Warner, have been
rewarded handsomely for this. But, while most investors are arguably now highly aware that evolving methods of TV content
distribution could put the affiliate fee ecosystem in a vulnerable position, far fewer are probably aware that it could also put the
syndication ecosystem, which has fed the beast so well for the past 15 years, into jeopardy as well.
The content producers need the domestic cable channels to stay healthy and profitable on a linear basis in order to keep driving
demand for their content. Should these channels drop off basic tiers, or simply be displaced by fragmentation in a move to greater
online video distribution over-the-top, a healthy source of demand could disappear. We think the consumer is probably unaware of
just how much content he has access to, due to this ecosystem. While in the short-term, there is likely money to be made with the
over-the-top online distributors by selling them content as well, the content companies need to be careful not to let the tail wag the dog
and cannibalize the true driver of positive economics before a new ecosystem that can monetize content just as well (or better) is fully
Media's New Opportunities From Old ThreatsApril 7, 2011
9. 9
in place. As a result, we’d expect the availability of franchise procedurals in early syndication windows to be off the table for over-the-
top (OTT) in the near term.
Exhibit 4: Programming Strategy and Monetization Summary
Broadcast Network TV Programming Strategy
Broadcast Networks
Genres
Programming Strategy (Original vs. Off Net Syndication)
Current First Run Content Self Produced Versus Outsourced
Current Original Programming Primary Monetization Domestically
Suitability Of Self Produced For Syndication/Intl Monetization
Ad Supported Cable Network TV Programming Strategy
Ad Supported Cable Networks FX, Fox Sports Nets, etc.
Programming Strategy (Original vs. Off Net Syndication)
Genres Non Fiction Non Fiction
Current First Run Content Self Produced Versus Outsourced Self produced Self produced Largely outsourced
Current Original Programming Primary Monetization Domestically
Suitability Of Self Produced For Syndication/Intl Monetization
Discovery produces its
TV related content at
the U.S. Networks
(cable channel) division.
Syndication likely
amounts to an
insignificant portion of
revenue/OI
Scripps produces its
TV related content at
the Lifestyle Media
(cable channel)
division. Syndication
likely amounts to an
insignificant portion of
revenue/OI
The TV Studio is
housed under the
Entertainment
segment. We
estimate CBS
generates $2.5bn+
annually in
syndication sales, of
which ~$1bn comes
internationally
Warner Bros. TV
Studio is housed
under the Filmed
Entertainment
segment. ~1/2 of
Filmed Entertainment
segment OI ($1.1bn
in 2010) is generated
from programming
sales to 3rd party
networks and
syndication
Commentary Regarding TV Studio/TV Syndication Business
Viacom produces its TV
related content at the
Media Networks (cable
channel) division.
Syndication likely amounts
to an insignificant portion
of revenue/OI
We estimate Disney
generates $1bn+ in
syndication sales
annually, which is
accounted for in the
Broadcasting segment
20th Century Fox TV
Studio is housed under
the Filmed Entertainment
segment. The TV Studio
accounts for ~40% of
Filmed Entertainment
revenue. ~35% of TV
Studio revenue is
generated from
syndication
CBS
Content almost exclusively
distributed through Viacom
Nets (MTV, VH1, Nick,
etc.). Not well suited to off
net syndication
Non Fiction, Sitcoms, Kids
MTV, Nick, Comedy, BET
All content distributed
through both owned
channels and 3rd
parties. Mix of first run
and syndication oriented
Original
Serialized dramas and
non-fiction tend to be
self produced. Sit coms
a mix.
Largely self produced.
Current schedule not
well suited. Serialized
dramas and sports hard
to syndicate.
Varies -- some channels
(MTV, Nick, etc. self
produced, some Comedy
Central, etc. mixed and
some Nick at Night, etc.
primarily outsourced)
Core franchises Mixed --
MTV and Nick Original,
Comedy Central original,
Nick at Night, etc. Off Net
syndication.
Content almost
exclusively distributed
through Discovery Nets.
Unsuited to syndication
None ABC None
Primarily on network.
Some monetization of
sit com production in
syndication.
Studio Content Monetization Strategy: Suitability for exploitation in
syndication
On network. Almost no
original content that is
syndicatable in
meaningful way.
Current schedule not
well suited. Serialized
dramas and sports hard
to syndicate.
Core franchises Mixed --
MTV and Nick Original
versus Comedy Central,
Nick at Night, etc. Off Net
syndication.
Sports (non-fiction) and
serialized drama. Some
sit coms.
Sports outsourced. FX,
etc. some self produced,
but largely syndicated.
Sports outsourced.
ABC Family, etc. self
produced anchor with
syndicated content
supporting.
Almost all current ABC
studio content
distributed through ABC
in first run. More legacy
programming
distributed in
syndication
Sit Com, Serialized
Drama, Non Fiction
(Dancing With The
Stars, etc.)
Sports and non-fiction
at ESPN with ABC
Family a mix anchored
with originals supported
by off net syndication.
Original
Fox
On network. Almost no
original content that is
syndicatable in
meaningful way.
ESPN, ABC Family
On network. Almost no
original content that is
syndicatable in meaningful
way.
Serialized
drama/dramedy, non
fiction (American Idol,
etc.), animated sit com
Primarily on network.
Some monetization of sit
com production in
syndication.
Tends to be lower as mix
shifts toward serialized
drama and non fiction
Sports and non-fiction at
Fox Sports Nets with FX
a mix anchored with
originals supported by off
net syndication.
Sports (non-fiction) and
serialized drama. Some
sit coms.
Tends to be lower as
mix shifts toward
serialized drama and
non fiction
Current schedule not
well suited. Serialized
dramas and sports
hard to syndicate.
NoneTNT, TBS, TrueTV
Some original, but still
mostly off network
syndicated content.
Increasing amounts
of sports as well.
Procedurals, sit coms
and serialized
dramas.
Almost exclusively on
network as it tends
toward serialized.
Some sit com
content, but none
really syndicated yet.
Discovery, TLC, Animal
Planet, ID
Original
Some formats and
shows may work
Internationally. Some
tastes are more local.
Some formats and
shows may work
Internationally.
Discovery tends to
program it's owned and
operated channels
rather than provide 3rd
party programming.
Almost exclusively on
network (both Domestic
and International)
Procedurals, Sitcoms,
some non fiction
(Survivor)
Original
Distribution primarily
through 3rd party
networks. Highly
suited to syndication
Current content
almost exclusively
distributed through
CBS and highly suited
to syndication.
None None
Content almost
exclusively distributed
through Scripps Nets.
Unsuited to
syndication
Almost exclusively on
network
Procedurals largely
self produced,
sitcoms outsourced.
Content works well
both on net and off
net generally
Highly suitable.
Food Channel,
HGTV, Travel
Original
Source: Company reports and RBC Capital Markets estimates
The Cost of Content at “Wholesale”
There have been a number of announcements recently regarding the licensing of content for digital distribution, particularly with
respect to Netflix. Numbers are always scant (at least to what is “officially” reported). But even if they are known (for instance,
Disney recently announced a deal in which it would license Disney Channel and ABC Family channel content to Netflix for a reported
$200 million for a one-year license period), it’s difficult to understand the value proposition for either side without knowing a) what
the content cost to make, b) what it traditionally could be monetized at, and c) how important it is for the buyer as an anchor.
Was this a good deal, a bad deal, or a neutral deal? Part of the problem in answering the question is that the value of the content
probably means more to Netflix (or other nascent platforms) than it does to the traditional ecosystems. This is the case precisely
because they are so nascent, and therefore have very little existing content. Each piece of incremental premium content brings an
Media's New Opportunities From Old ThreatsApril 7, 2011
10. 10
emerging competitor closer to critical mass/competitive status with the traditional ecosystem. Ironically though, the emerging digital
distribution ecosystem for traditional content is least able to monetize the content, since it charges the end user a lower price.
Broadcast Network Content Cost Structure Differs from Cable Network Content Cost Structure
Due to Both Total Cost per Hour and Total Hours of Original Content Run
Broadcast networks program ~16 hours per day directly (with the exception of Fox, which programs far fewer hours per day). The
remaining amount of programming airtime reverts back to broadcast station affiliates—the basic distribution mechanism for
broadcasters. This stands in stark contrast to a cable network, in which 24 hours per day of a cable channel’s programming is supplied
by the cable network. At first blush, one might expect that the cost of programming would be materially higher at cable networks since
the cable network is required to program 24 hours per day, versus the broadcast networks’ considerably lower number of hours to
program. However, broadcast networks tends to program with virtually 100% of original, “first-run” programming (which technically
includes one rerun per season of each show) and one run per show per day. Compare this to cable networks, which typically run
anywhere from 100% to 65% of acquired programming (typically older, syndicated fair) with “first-run” fare often multiple times in
its first window. Some networks (notably TNT and USA) are running more broadcast-like original programming and some networks,
such as Discovery Channel or Food Network, produce lots of first-run programming, but the bulk of cable network programming is
acquired. In addition, it often includes infomercial programming in late hours, which actually generates revenue, as opposed to costing
money.
Exhibit 5: Illustrative Costs of Content for Broadcast Networks
Daypart
Hours
Programmed Typical Content
Total Number
Of Hours per
Day
Cost Per
Hour
(mm)
Cost per
Day (mm) Comments
Early Morning 7AM-10AM Morning News Talk -- Good Morning America, Today, etc. 3.0 $0.10 $0.30
Not "re-runnable". Also leverages off of some
network news department fixed costs.
Daytime 10AM-4PM
Varies, but might include Soap Operas, Game Shows.
Affiliates might also air first run syndication (Oprah, etc.)
6.0 $0.20 $1.20 Each episode can be run multiple times per year.
Early Fringe 6PM-7PM Generally includes 1/2 hour of Network News
1
0.5 $0.25 $0.13
Not "re-runnable". Provides resources to other
programming -- news magazines, Sunday morning
political talk shows and morning shows.
Prime Time 8PM-11PM First run Drama/Comedy/Reality 3.0 $3.00 $9.00 Each episode can be run 2x per year.
Late Night 11:30-1:30 Leno, Letterman, Jimmy Kimmel, Nightline, etc. 2.5 $0.25 $0.63 Each episode can be run 2x per year.
Varies Varies Sports Programming
2
0.0 $2.50 $0.00
Varies by programming type
1
so we make some
assumptions based on individual programs and
hours of sports per week and exclude Olympics.
Total 15.0 $0.75 $11.25
Daypart
Hours
Programmed Typical Content
Total Number
Of Hours per
Day
Cost Per
Hour
(mm)
Cost per
Day (mm) Comments
Early Morning 8AM-9AM Morning News Talk -- Good Morning America, Today, etc. 1.0 $0.10 $0.10
Not "re-runnable". Also leverages off of some
network news department fixed costs.
Early Morning 9AM-12PM Saturday Kids programming/Sunday News Talk (blended) 3.0 $0.20 $0.60
In some cases, Kids blocks are managed by 3rd
parties.
Varies Varies Sports Programming
2
5.0 $2.50 $12.50
Cost of individual programming varies heavily by
network and season.
8PM-11PM First run Drama/Comedy/Reality 3.0 $3.00 $9.00 Each episode can be run 2x per year.
Total 12.0 $1.85 $22.20
Weighted Average 3
14.1 $1.02 $14.38
3
Weighted average -- 5/7 = ~71% for weekdays, 2/9 = ~29% for weekends.
2
Major league baseball ~$425mm/year for Fox, NFL ~$700mm/year for each major network, NBA ~$485mm/year for ABC/ESPN, NHL $75mm/year, NCAA $335mm/year for CBS, Other
college sports $100mm/year for each network, NASCAR, costing networks that carry it ~$200mm/year, while the summer Olympics ~$1.2bn, split across NBC and it's sister cable networks.
Assume average budget of ~$2bn per year, 52 weeks per year, $38mm per week, 15 hours per week, $2.5mm. We believe the Industry generates ~$22bn of annual sports rights costs with
~66% going to broadcast networks.
1
Because this programming can be spread across multiple dayparts and include primetime programming (60 Minutes, 20/20, Evening News, Late News, Meet The Press, This Week, etc.,
this is very difficult to allocate. Also, costs can be spread over multiple networks. No figure is widely available for any network. We assume ~1,000 employees ~$200k/annually each and
fixed costs of another ~$50mm and major talent costs of another $50mm. Other costs probably exist, but are shared with other parts of network (studios, etc.).
Weekend
Weekday
Source: RBC Capital Markets estimates
Media's New Opportunities From Old ThreatsApril 7, 2011
11. 11
Not every network programs precisely the same amount of hours per week. In particular, Fox generally programs one-third of the
other major broadcast networks. Because a major component of Fox’s programming costs are sports (the most expensive
programming on TV) and primetime TV (the most expensive daypart to program), its cost per hour of programming is far higher than
that of CBS, NBC, and ABC.
Exhibit 6: Programming Costs for Major Broadcast Networks
Network
2011
Programming
Costs (mm)
Program
Cost Per
Week
(mm)
Hours
Programmed
Per Week
Programming
Cost Per Hour
(mm) Additional Comments
NBC $3,285 $63 87.0 $0.73
Provides 22 hours of prime time programming to affiliated stations: 8-11pm (ET/PT)/7:00-10:00 pm (CT, MT,
AT)/6-9 pm (HT) Monday through Saturday and 7-11 pm on Sundays. Programming is also provided 7-11 am
weekdays in the form of Today , which also has a two-hour Saturday and one-hour Sunday edition; one-hour
weekday soap; nightly editions of News ; the Sunday political talk show; weekday early-morning news program;
late night talk shows The Tonight Show with Jay Leno , Late Night with Jimmy Fallon and Last Call with Carson
Daly ; sketch comedy show Saturday Night Live ; and a three-hour Saturday morning animation block under the
name qubo. In addition, sports programming is also provided weekend afternoons any time from 12-6 pm. ET, or
tape-delayed PT.
CBS $3,320 $64 87.5 $0.73
Provides 22 hours of prime time programming to affiliated stations: 8–11 p.m. Monday to Saturday (all times
ET/PT) and 7–11 p.m. on Sundays. Programming is also provided 10 a.m.–3 p.m. weekdays (game shows and
soaps); 7–9 a.m. weekdays and Saturdays (The Early Show); CBS News Sunday Morning, nightly editions of the
CBS Evening News, the Sunday political talk show, a 2½-hour early morning news program Up to the Minute and
CBS Morning News; the late night talk shows Late Show with David Letterman and The Late Late Show with
Craig Ferguson; and a three-hour Saturday morning live-action/animation block under the name Cookie Jar TV.
Sports programming generally runs on weekends, though it varies -- but generally it's aired between noon and
7pm.
ABC $2,817 $54 92.5 $0.59
Provides 22 hours of prime time programming to affiliated stations: 8–11 p.m. Monday to Saturday (all times
ET/PT) and 7–11 p.m. on Sundays. Programming also be provided 11 a.m. – 4 p.m. weekdays, 7–9 a.m.
weekdays smf 8-9 a.m. weekend editions; nightly editions of News, the Sunday political talk show, early morning
news and late night talk show; and a three-hour Saturday morning live-action/animation block. sports (or
sometimes other) programming is also provided weekend afternoons any time from 12–6 pm (all times ET/PT).
When no sports are scheduled on one or both weekend afternoons, ABC will provide 1–2 hours of filler
programming (either reality shows or movies) in the afternoon hours, usually airing in the late afternoon between
4-6 pm ET/PT.
FOX $2,216 $43 27.0 $1.58
Fox currently programs 19.5 hours of programming per week. It provides 15 hours of prime time programming to
owned-and-operated and affiliated stations: 8-10 p.m. Monday to Saturday (all times ET/PT) and 7–10 p.m. on
Sundays. One and a half hours of late night programming is offered on Saturdays from 11:00 p.m. to 12:30 a.m.
Weekend daytime programming consists of the infomercial block Weekend Marketplace (Saturdays from 10:00
a.m. to noon) and the hour-long political news program Fox News Sunday (time slot may vary). Sports
programming is also provided, usually on weekends (albeit not every weekend year-round), and most commonly
between 12-4 or 12-8 p.m. on Sundays (during football season, slightly less during NASCAR season) and 3:30–7
p.m. on Saturday afternoons (during baseball season).
1
Includes an average of 8 hours on weekends for Sports.
Source: RBC Capital Markets estimates and Kagan
In recent years, networks like TNT and USA have been programming several nights of original scripted drama and scripted comedy
programming in primetime, but none of them come close to the ~15–21 hours of primetime, non-sports original programming the
broadcast networks provide. The cable networks have developed a number of original series, actually, but few of them run the typical
22 original episodes of broadcast network (they range from ~9–13 episodes). As a result, they put on a number of series that do not
run a full, typical season. Rather, the various series essentially combine to program to a full season. As a result, for each broadcast
channel series produced, the cable channels typically have to produce twice as many to match a traditional series’ season worth of
content. Additionally, and increasingly, each of these cable networks are acquiring the rights to various professional sports leagues for
some coverage.
This strategy can be extremely cost effective in terms of programming costs. The cable network will spend $1-$2 million on a few
scripted hours of content to “anchor” its schedule/franchise. The network can further re-run the original series’ episodes many times
per week (unlike the broadcast networks, for which such a practice is unheard of). Then, the cable networks can run syndicated
programming, or much cheaper original programming, for the balance of its primetime and other daypart schedules.
Media's New Opportunities From Old ThreatsApril 7, 2011
12. 12
Exhibit 7: Content on General Market Cable Channels Emphasizing Scripted Fiction
Network
Hours Per Week Of
Original Scripted
Primetime Content1
Current Original Scripted Primetime
Series 2
Most Often Run Syndicated
Content
Original Sports Content
Featured
TNT 3-6
The Closer, Leverage, Hawthorne, Men
Of A Certain Age, Southland, Memphis
Beat, Rizzoli & Isles, Dark Blue, Fallen
Skies
Bones, CSI: NY, Numb3rs,
Charmed, Law & Order, Angel,
Las Vegas, Cold Case, and
Supernatural
NBA, NCAA
TBS 2-3
Conan O’Brien, Lopez Tonight, My
Boys, Are We There Yet?, Neighbors
From Hell, Meet The Browns, House of
Payne, Glory Daze, Wedding Band, The
Rabbit Factory, The Catch, Good and
Evel
Seinfeld, Family Guy, The Office,
Married With Children, Saved By
the Bell, Yes Dear, My Name Is
Earl
MLB
USA 2-4
Burn Notice, White Collar, Psych, In
Plain Sight, Covert Affairs, Law & Order:
CI, Coyote Ugly, A Legal Mind
House, CSI, Becker, JAG, Law &
Order SVU, NCIS, NCIS LA
Westminster Kennel Club
Dog Show, WWE Wrestling,
collge football (Fall 11)
FX 3-6
Archie, The League, Lights Out, Louie,
Justified, Damages, Nip/Tuck, Sons Of
Anarchy, It's Always Sunny In
Philadelphia
Two and A Half Men, Spin City,
That 70's Show, The Practice
-
1
Varies by week, but on average, in this range. Also, excludes late night and sports.
2
Some "announced", but still in development.
Typically, the broadcast networks program 9-11 hours of
scripted fiction original content in primetime.
Source: TNT, TBS, USA, TV By The Numbers, RBC Capital Markets estimates
For the most part, however, these cable networks (even the ones that typically feature more first-run programming), typically fill the
bulk of their primetime schedules (and much of their non-primetime schedules) with syndicated, off-network programming or non-
fiction original content (historically, this was called unscripted reality or unscripted documentary, but this programming has become
increasingly scripted). In the chart below, we highlight the actual programming schedules for three of the most originally programmed
cable networks in existence today—USA, TNT, and TBS—for the week of March 6, 2011 through March 12, 2011. While this week
may be somewhat lighter on original content than other weeks (it’s not a sweeps period, etc.), we think it’s worth illustrating just how
little original fare appears on these networks relative to the broadcast networks.
The syndicated content becomes extremely cost effective as well when one considers it costs, at the high end , ~$1 million per episode
(see our discussion regarding syndicated programming costs later), but the costs can be amortized across a large number of runs across
multiple dayparts, for each episode. For example, one episode of Law & Order, bought in syndication by TNT, may cost $1 million,
but unlike a broadcast network which could amortize the cost of a single episode over only two runs over an entire season, a cable
network could run the episode two times over a single day, ten times per season, and multiple times over a multi-year cycle that it’s
purchased for.
The most cost-effective content of all, however (at least in first run) is original non-fiction, also known as unscripted documentary,
content. This type of content is the mainstay of channels such as Discovery Channel, History and, in more recent years, A&E. For the
most part, a typical hour of this type of primetime programming costs ~10–25% of a typical scripted hour. One could argue that since
the cable network needs to program 24 hours per day instead of the 4–12 hours per day of a typical broadcast network does, it must
come up with far more cost-effective programming expense strategies.
Media's New Opportunities From Old ThreatsApril 7, 2011
13. 13
Exhibit 8: Average Cost per Hour of Production
$0.3
$3.0
0.0
0.5
1.0
1.5
2.0
2.5
3.0
3.5
Cable Original Non-Fiction Broadcast Fiction
(in$mm)
Source: RBC Capital Markets estimates
During 2010, USA, TNT, TBS, FX, A&E, History Channel, and Discovery Channel were the seven highest-rated advertising-
supported cable networks in the United States. In their rise to the top of the ratings, many industry observers (and the channels
themselves) have made much noise about their migration to original, premium programming. But the chart below shows that the vast
majority of primetime programming, especially on USA, TNT, TBS, and FX, which are aiming to compete directly with the broadcast
networks, are still heavily reliant on a) syndicated fare, b) movies, and c) non-fiction content.
These networks continue to be a primary avenue for the major premium scripted production houses (the studios controlled by the
major broadcast networks as well as Warner Brothers) to monetize their off-network broadcast content highly efficiently.
Exhibit 9: Original versus. Acquired Basic Cable Programming Expenses at Cable Networks 2010 (in mm)
$7,437, 37%
$12,727, 63%
Original Acquired
Source: SNL Kagan and RBC Capital Markets estimates
Media's New Opportunities From Old ThreatsApril 7, 2011
14. 14
Exhibit 10: Programming Schedules for Week of March 6th
– Top 7 Rated Non–Sports Cable Networks, A18-49 Demo
USA TNT TBS FX A&E History Discovery
8PM Movie Movie Movie Movie
Syndication (Criminal
Minds) Original Series (Ax Men)
Original Series (Flying
Wild Alaska)
9PM
Syndication (Criminal
Minds) Original Series (Ax Men)
Original Series (Flying
Wild Alaska)
10PM
Original Scripted
Series (Breakout
Kings)
Original Series
(American Pickers)
Original Series (Flying
Wild Alaska)
8PM
Syndicated Series
(NCIS) Syndication (Bones)
Syndication (Family
Guy) Movie
Original Series
(Intervention)
Original Series (Pawn
Stars)
Original Series
(American Chopper)
9PM
Syndicated Series
(NCIS) Syndication (Bones)
Syndication (Family
Guy)
Original Series
(Intervention)
Original Series
(American Pickers)
Original Series
(American Chopper)
10PM Wrestling
Original Scripted
Series (The Closer)
Syndication (Family
Guy) Original Series (Heavy)
Original Series (Pawn
Stars)
Original Series (Sons Of
Guns)
8PM
Syndication (Law &
Order: SVU) Movie
Syndication (The
Office) Movie
Original Series (The
First 48)
Original Series (Only In
America With Larry The
Cable Guy)
Original Series (Dirty
Jobs)
9PM
Syndication (Law &
Order: SVU)
Syndication (The
Office)
Original Series (The
First 48)
Original Series (Only In
America With Larry The
Cable Guy)
Original Series (Dirty
Jobs)
10PM
Syndication (Law &
Order: SVU)
Original Scripted
Series (Southland)
Syndication (The
Office)
Original Series
(Lights Out)
Original Scripted
Series (Breakout
Kings)
Original Series (Top
Shot)
Original Series
(American Treasures)
8PM
Syndicated Series
(NCIS) Syndication (Bones)
First Run Syndication
(Meet The Browns) Movie
Original Series (Dog
The Bounty Hunter)
Original Series (Ancient
Aliens Underwater
Worlds)
Original Series (Sons of
Guns)
9PM
Syndicated Series
(NCIS) Syndication (Bones)
Original Series (Are
We There Yet?)
Original Series (Dog
The Bounty Hunter)
Original Series (Killer
Shockwaves)
Original Series (Sons of
Guns)
10PM
Syndicated Series
(NCIS) Syndication (Bones)
First Run Syndication
(House Of Pain)
Original Series
(Justified)
Original Series
(Storage)
Original Series
(Predators Of the Deep)
Original Series (Desert
Car Kings)
8PM
Syndication (Law &
Order: SVU) NBA Movie
Syndication (Two
and A Half Men)
Original Series (The
First 48)
Original Series (Modern
Marvels)
Original Series (Man
Versus Wild)
9PM
Syndication (Law &
Order: SVU)
Syndication (Two
and A Half Men)
Original Series (The
First 48)
Original Series (Swamp
People)
Original Series (Man
Versus Wild)
10PM
Original Scripted
Series (Fairly
Legal)
Syndication (Family
Guy)
Original Series
(Archer)
Original Series (Beyond
Scared Straight) Original Series (Ax Men)
Original Series (Out Of
The Wild)
8PM
Syndicated Series
(NCIS) Syndication (Bones) Movie Movie
Syndication (Criminal
Minds)
Original Series (Modern
Marvels)
Original Series (Sons of
Guns)
9PM
Syndicated Series
(NCIS) Movie
Syndication (Criminal
Minds)
Original Series (Pawn
Stars)
Original Series (Sons of
Guns)
10PM
Syndicated Series
(NCIS)
Syndication (Criminal
Minds)
Original Series
(American Pickers)
Original Series
(American Loggers)
8PM Movie Movie
Syndication (Family
Guy) Movie
Original Series (The
First 48)
Original Series
(American Pickers)
Original Series (Cops
and Coyote)
9PM Movie
Syndication (Two
and A Half Men)
Original Series (The
First 48)
Original Series
(American Pickers)
Original Series (Cops
and Coyote)
10PM
Syndication (Two
and A Half Men)
Original Series (The
First 48)
Original Series
(American Pickers)
Original Series (Texas
Drug Wars)
Wednesday
Thursday
Friday
Saturday
Sunday
Monday
Tuesday
Scripted Oriented Unscripted Oriented
This schedule reflects less original programming (scripted and sports) than average, but even at
the higher end of the spectrum (during sweeps periods or heavy sports content seasons), the
amount of scripted original programming in primetime pales versus the networks.
Note that unscripted content tends to cost 50-75% less than
scripted drama.
Source: USA, TNT and TBS and RBC Capital Markets
However, given their lack of reliance on premium scripted fare and their ability to re-run programming through multiple dayparts on
the same day or during the same week, etc., cable networks have a very different expense structure than broadcast networks. They
program many more hours but tend to have far less expensive programming costs. With the exception of ESPN, no cable network
comes remotely close to any of the broadcast networks in terms of total programming expenses.
Media's New Opportunities From Old ThreatsApril 7, 2011
15. 15
Exhibit 11: Programming Costs for Major Broadcast Networks and Select Cable Networks
$394 $479 $481 $495 $510 $515 $710
$923
$2,216
$2,817
$3,285$3,320
$4,924
0
1,000
2,000
3,000
4,000
5,000
6,000
FX
N
etwork
ESPN2
TBSFO
X
N
ews
NFL
N
etw
ork
M
TV
USA
TNT
FO
X
ABC
NBC
CBS
ESPN/ESPN
H
D
(in$mm)
Source: RBC Capital Markets estimates and Kagan.
Other cable networks enjoy dramatically lower programming expense structures. We analyzed program expense data for ~175 cable
networks with approximately two-thirds of those networks enjoying coverage over ~50 million or greater total subscribers. This data
suggests the difference in programming expense for most of the cable networks versus the broadcast networks is even more dramatic
than the Top 10 cable network data would suggest. Where an hour of programming at the broadcast networks costs closer to $750,000
(blending dayparts), it is closer to the $10,000 level for cable.
Exhibit 12: Most Cable Channels Program Networks on a Shoestring Compared to Broadcast Networks
% Of Cable Networks With Annual Programming
Expenses Of...
<$50mm
58%
$50mm -
$200m
27%
>$200mm
15%
% Of Cable Networks With Per Hour Programming
Expenses Of...
<$5,700
59%
$5,700 -
$23,000
27%
>$23,000
14%
Source: RBC Capital Markets and SNL Kagan.
While not the focus of this report, it is worth noting that the trade-off for lower programming costs tends to be lower ratings. While the
Big 4 broadcast networks represent ~4% of the total ad-supported networks with distribution to 50 million or more homes in the U.S.,
they capture ~40% of the primetime ratings. It takes ~three of the largest ad-supported cable networks (non-sports) to garner a similar
audience in primetime as a broadcast network.
Media's New Opportunities From Old ThreatsApril 7, 2011
16. 16
Exhibit 13: Adults 18-49 Ratings
1.7 1.7 1.9 1.9
6.6
17.8
0.0
2.0
4.0
6.0
8.0
10.0
12.0
14.0
16.0
18.0
20.0
ABC CBS NBC Fox Combined Four
Broadcast
Networks
Advertising
Supported Cable
4 broadcast networks generate ~40% of total ratings of over 100 ad supported cable networks
combined.
Source: Nielsen and RBC Capital Markets
How Original Content Is Priced
All content is not created equal. An hour of high-quality scripted drama on network TV can cost upwards of $6 million per hour to
produce, and sitcoms with premium talent can cost $5 million per hour to produce. Cable-produced dramas, on the other hand, can
cost only ~$0.5 million to produce (even relatively high-quality shows such as Mad Men or Justified). Unscripted, non-fiction or
reality programming, however, can cost as little as $0.1 million per hour. Furthermore, sports programming can cost as much as $13
million per hour. Assume, for example, ESPN’s Monday Night Football contract at $1.1 billion per hour, which is divided up among
16 regular season games (assuming ~three hours of “game time”, including commercial breaks, time outs, etc.).
Exhibit 14: Illustrative Cost per Hour of Network Programming
Type Of Programming
Likelihood of
Break Even
on First Run
Ability To
Recoup In
Syndication Commentary
Low High
Scripted Drama
Procedural 1.5 - 6.0 Low High
Arc Based 1.5 - 6.0 Medium Low
Sitcom 1.0 - 5.0 Low High
Reality/Documentary 0.8 - X High Low Monetization generally occurs on first run.
Reality/Documentary -- more
Cable Net Oriented
0.1 0.5 High Medium
Relatively low cost content with modest "re-
run" monetization.
Pro/Premium College Sports
1
0.5 - 23.0 Low Negligible Often a loss leader to "lift" a schedule.
News - Low None Often a loss leader to fortify franchise.
Range Of
Cost per Hour
(in $ mm)
1
At high end, assume annual cost for ESPN Monday Night Football of ~$1.1bn, divided by 16 games, or ~$69mm per game. Then assume 3 hours per game, or ~$23mm per hour At low end, assume
annual NBC/Versus $75mm cost divided by 82 games or ~$0.9mm per game. Then assume 2 hours per game, or ~$0.45mm per game.
Programming generally deficit financed for
network distribution, but recouped in later
windows
Generally rely on syndication,
International distribution, etc.
windows to drive profitability.
Generally rely on initial window
to drive profitability, or are
basically loss leaders.
Source: RBC Capital Markets estimates
Not all content is initially designed to be profitable in its first window. In fact, it generally takes five or so seasons for a big broadcast
drama to fully recoup (when it goes into syndication). Additionally, content is increasingly being financed in the international market
place.
Media's New Opportunities From Old ThreatsApril 7, 2011
17. 17
Each of the Major Media Conglomerates Create TV Content for Their Own Platforms and Others
Each of the major media conglomerates have their own in-house TV production studios. These include 20th
Century Television for
Fox/News Corp., ABC Studios (formerly Buena Vista TV) for ABC/Disney, CBS Studios for CBS, and Warner Brothers TV Studios
for Time Warner. Historically, these studios produced as much, if not more content for third party networks as they did for their own
networks.
But as the model for profitability came to rely more on syndication (and frankly, when syndication became a real upside driver for TV
shows), the emphasis on creating TV for a studios’ affiliated network has increased. Think about it this way: historically, a studio
would produce a TV show and sell it to a TV network for a fixed license fee. With no robust syndication market, if the show was a hit,
the network benefited from having a hit show in first run by driving advertising around the show and the studio attempted to price the
license fee such that it could make a decent enough profit to make production of the show worthwhile. That was the end of it—it was
basically a 10% margin type of business. There wasn’t much benefit for a network to produce or own a show. In fact, there was a
disincentive to self-produce: why take production risk on a show that might not last when there is so much start-up related costs
associated with the pilot and first season generally? However, when the syndication market began to explode, especially with the rise a
robust cable TV landscape and a burgeoning international marketplace that would pay for off-network syndication fare, a real change
occurred. That is, the first run of the episode became not an end unto itself, but a promotional vehicle for the ultimate profit driver of
the show—syndication. As such, the first run (which almost always happened on the broadcast network) was considered the first
“window.”
However, it’s always nice to have a hit show (it usually, though not always, makes money for the network that runs it) as it drives
profit for a single time slot and can often lift audiences for adjacent time slots. But, if the network doesn’t own the show, it can’t really
participate in the huge benefits that show offers—massive exposure to the first window. As a result, the first window simply becomes
a means to an end. The network that doesn’t feature its own content is simply allowing another studio to monetize one of its strongest
assets—the promotion of the first window.
Furthermore, networks have become increasingly reliant on franchise shows (particularly in the procedural genre) that can easily beget
other spin-offs. Consider, for instance, the Law & Order franchise or the CSI franchise. By owning one show that airs in the first
window, there is the potential to exploit multiple billion-dollar franchise opportunities. We think CBS and NBC Universal have
historically been most successful at this game while ABC and Fox have lagged.
Ironically, ABC and Fox have had some very substantial success with shows in first run that translated very poorly to second runs in
syndication. For instance, shows like Lost for ABC or 24 for Fox were both commercial and critical successes, driving major ratings in
first run primetime. However, as we will discuss later in this report, they lacked the ability to be monetized in syndication, the most
potentially profitable window for TV shows. These shows were serialized and thus were very difficult to sell into syndication. In
essence, from a commercial stand point, one could argue that while these shows demonstrated ratings strength, they were a waste of
the first window.
Media's New Opportunities From Old ThreatsApril 7, 2011
18. 18
Exhibit 15: Using the First Run Window to Monetize Syndicated Content
Network/Studio
Where They Are Helping A Rival Studio To Exploit
Content
CSI Two And A Half Men -- Owned by Warners
CSI The Big Bang Theory -- Owned by Warners
CSI Miami How I Met Your Mother -- Owned by 20th Century Fox
CSI New York
NCIS
NCIS
NCIS LA
Law & Order
Law & Order
Law & Order: SVU Burn Notice -- Owned by 20th Century Fox
Law & Order: CI
Law & Order LA
Monk
Dancing With The Stars Modern Family -- Owned by 20th Century Fox
Lost
Desperate Housewives
Glee House -- Owned by NBC Universal
24
House
Fox/Twentieth Century Fox
Where They Are Lining
Their Own Pockets
CBS/CBS Studios
NBC/NBC Universal
Disney/ABC
Billion-Dollar Franchises
Source: RBC Capital Markets
How Does a TV Show Get to Profitability? 100 Episodes Is the Magic Number
When a studio produces a critical mass of shows with a long run of episodes (historically 4 or 5 seasons, or ~65-100 episodes), the
show is sold to local TV stations or cable networks in “packages” containing (typically) one chronologically continuous run of
episodes. A package usually contains at least 65 episodes, which is enough to “strip” the show across the schedule Monday through
Friday for 13 weeks. The distributor (TV station or cable network) pays one upfront fee, but it’s based upon a price per episode. The
individual price per local station may not be terribly high for an individual show, but if 250 to 300 stations pay for the rights to show
the program, the total amount of money that goes to the studio can easily be in the $1 million per episode range for a situation
comedy.
For shows with relatively shorter runs (not much more than an initial 65 episodes), the syndication package will contain the entire run
of the show. For shows that have been on the air for longer than say, 100 episodes, the show is generally sold in multiple packages.
While the value of the initial package could decrease when it’s renewed, the newer show package is often worth more than the first
show package when the prior syndication agreement was struck. Historically, there was a lag in windows in which shows could be
syndicated in broadcast and cable channels. The first window was generally dedicated to the local broadcasting stations (which tended
to pay a premium) and last as much as three or four years, at which time cable channels could start showing runs of the same series.
These windows have now compressed and in many cases are indistinguishable.
Generally, two kinds of shows work really well in syndication (meaning there is high demand, thus license fees are very high). Those
two kinds of shows are comedies (which work very well domestically but not internationally, thus upside is limited to the U.S. market)
and procedural-based dramas (which work well domestically as well as internationally, thus driving more upside because there is a
global market place). With procedural dramas such as Law & Order or CSI, the plot is far more important than the characters. The
viewer doesn’t need to have seen any prior episodes of the show to follow any other episodes of the show. This is in contrast to arc-
based dramas (in its extreme, something like a night-time soap opera—think Dallas, or even a show like Lost).
Note, Time Warner claims that Seinfeld has generated ~$2.7 billion of syndication revenues over the past 12 years (which, given that
the content has been bought and paid for should almost all be profit). Though, we aren’t sure how much “back-end” participation
Jerry, George, Kramer and Elaine received. A show initially had to reach ~100 episodes, and later ~60 episodes, to be considered for
syndication, because each episode will be played multiple times. Recently, a few sitcoms, including Modern Family, Glee, and The
Media's New Opportunities From Old ThreatsApril 7, 2011
19. 19
Cleveland Show entered into syndication deals three or four seasons before the 100-episode mark. Similarly, NCIS:LA was syndicated
for $2 million an episode after only six first-run episodes (a move that shocked many in the industry). If these early syndication
vehicles continue to perform and the syndication bet pays off, it may start more of a trend away from the 100-episode standard.
We’d note that some of the non-fiction based, cable-oriented shows have also been syndicated. They tend to be a more difficult
economic proposition since they have higher residual/back-end components than typical broadcast content (in many cases, this makes
off-network syndication cost prohibitive). The most high-profile example of this has probably been Discovery Communications in
partnership with distribution platform, Debmar Mercury (part of Lionsgate), syndicating Deadliest Catch and American Chopper in a
joint offering. We’d estimate these shows produced far lower off-network licensing opportunities.
Exhibit 16: Non-Fiction TV Content – Comparative Production Costs (in 000’s)
Examples
Cable Broadcast
Docudrama The Hills/Deadliest Catch $400-$600 $800-$1,000
Competition
Ensemble Oriented Survivor - $800-$1,200
Individual Oriented Wipeout/Project Runway $250-$650 $750-$1,000
Informational Drive Ins, Diners and Dives $400-$600 -
Cost Per EpisodeGenre
Source: RBC Capital Markets estimates
Because of limited monetization off-network, these non-fiction programs tend to be profitable on a first-run licensing basis. However,
upside is available on a licensing basis for either formats (à la American Idol with its global formats) or on an ancillary merchandising
basis (think Biggest Loser diet shakes). Outside of some big budget competition shows, these non-fiction based programs tend
primarily to be the provenance of cable networks.
Exhibit 17: First-Run Content Monetization Drivers
Cable Broadcast
Average Production Budget/Hour $2.00 $3.00
Average License Fee From Network $1.00 $1.50
Deficit/(Profit) From First Run $1.00 $1.50
Typical Shortfall Funding Source International Syndication Domestic Syndication "Off Net"
Upside Limited Potentially substantial.
Cable Broadcast
Average Production Budget/Hour $0.35 $0.90
Average License Fee From Network $0.40 $1.00
Deficit/(Profit) From First Run ($0.05) ($0.10)
Typical Shortfall Funding Source International Syndication International Syndication
Upside Limited Limited
Cost/Profit Profile For Network Scripted Content (in mm)
Cost/Profit Profile For Network Non-Fiction Content (in mm)
But highly dependent on success as it takes 5 seasons
to accumulate enough content.
There are almost no cases where off-net
"stripping" has occurred. International
can deliver some upside.
Opportunity tends to come from
format monetization rather than
original productions.
Source: RBC Capital Markets, TV By The Numbers
Media's New Opportunities From Old ThreatsApril 7, 2011
20. 20
One might ask, why is it that scripted content costs so much more than non-fiction content to produce for both broadcast and cable
networks? The answer lies in the lack of need for writers, regular cast members, and even production facilities. You don’t really need
to build pre-existing sets for a non-fiction show about fishing crews (the boats already exist), addiction interventions (the “cast” shows
up at the person’s home), or pawn shop operators (they work at a pre-existing pawn shop). These writing and production
facility/personnel–related fees can make up 30–50% of the budget. Additionally the cost of the cast members in non-fiction tends to
pale in comparison to successful scripted content. However, there is one exception to that rule: when a show “blows up” into a bona
fide big hit, the salaries also tend to go up materially. This will happen in the second or third season of the series.
Exhibit 18: Cost per Episode of TV Talent (in 000’s)
Hugh Laurie (House) $400 Charlie Sheen (Two and a Half Men ) $2,000
Christopher Meloni (Law & Order: SVU ) $395 Jon Cryer (Two and a Half Men ) $550
David Caruso (CSI: Miami) $375 Marcia Cross (Desperate Housewives ) $400
Marg Helgenberger (CSI) $375 Teri Hatcher (Desperate Housewives ) $400
Mark Harmon (NCIS ) $375 Felicity Huffman (Desperate Housewives ) $400
Laurence Fishburne (CSI) $350 Eva Longoria (Desperate Housewives ) $400
Kyra Sedgwick (The Closer) $350 Dan Castellaneta (The Simpsons ) $400
Denis Leary (Rescue Me) $350 Julie Kavner (The Simpsons ) $400
Gary Sinise (CSI: NY ) $275 Tina Fey (30 Rock ) $400
Non-Fiction First Cycle Later Cycles
David Letterman (The Late Show ) $133 Kate Gosselin (Kate Plus 8 ) $25 - $250
Jay Leno (The Tonight Show ) $119 Real World Contestants $0 - $0
Conan O'Brien (Conan ) $48 Cast members of Big Brother $1 - $1
Ellen DeGeneres (The Ellen DeGeneres Show ) $38 Cast Members of Real Housewives $3 - $100
Jimmy Kimmel (Jimmy Kimmel Live ) $29 Nicole "Snooki" Polizzi (Jersey Shore ) $5 - $30
Chelsea Handler (Chelsea Lately ) $17 Catelynn Lowell (Teen Mom ) $5 - $5
Ozzy Osbourne (The Osbournes ) $5 - $1,000
Donald Trump (The Apprentice ) $50 - $100
Late-night
Drama Sitcom
First run cable network non-fiction cast
salaries are a "rounding error" versus
sitcoms/dramas.
Broadcast late night talent is 70% less expensive
per episode than drama/comedy and cable network
is a fraction of that.
Source: TV Guide, Entertainment Weekly, RBC Capital Markets estimates
At the end of the day, scripted content can be incredibly lucrative in domestic syndication from sales to cable networks alone for off-
network stripping. We’d note though, it’s the existing ecosystem of general market cable, such as USA, TNT and TBS, being included
in basic cable channel tier packages and further being able to command strong affiliate fees that allows for the profitable monetization
of this content. The largest threat to the disruption of this ecosystem is the exclusion of some of these networks from basic cable
carriage (TNT, for instance isn’t included in the Time Warner Essentials package) or more importantly, competition for viewership of
syndicated content from online video distributors such as Netflix, or even Hulu.
While there is a potentially longer term opportunity to create a similar distribution channel for premium video content online, it’s
unlikely to be matched by the existing ecosystem. In other words, the fate of the off network syndication market is directly tied to the
long-term prospects of the general market cable channels that primarily feature this type of programming. For today, it’s simply the
only way to generate ~$2 million per hour for a procedural drama or a big budget situation comedy on an off-network basis (outside of
very few special circumstances such as the recent Kevin Spacey House of Cards Netflix deal).
Media's New Opportunities From Old ThreatsApril 7, 2011
21. 21
Exhibit 19: Off-Network Cable Syndication Deals
Off-net
Launch Program Studio
License Fee
per Episode
(in mm)
Channel
Licensee Comments
2005 Sopranos HBO $2.50 A&E
One of very few high profile serialized syndication
deals and viewed as a ratings failure.
2009 The Mentalist Warner Brothers $2.20 TNT Syndicated before Season 3.
2009 NCIS-LA CBS $2.20 USA Network
Remarkable, given that only a few episodes had
aired before the deal was struck.
2010 The Big Bang Theory CBS $2.00
TBS and Fox
Stations
TBS paying $1.5mm while Fox stations paying
$0.5mm. Set a record for off network sitcom
purchases and syndicated during season 3.
2004 Law & Order: CI NBC Universal $1.90 Bravo/USA -
2002 CSI Warner Brothers $1.90 Spike -
2010 Modern Family Fox $1.40 USA Network Syndicated before season 3.
2004 Without A Trace Warner Brothers $1.40 TNT TNT took a major write-down in 4Q09
2007 Two and a Half Men Warner Bros. $0.80 FX
Initially syndicated off-net to Tribune in
broadcasting. Cable rights kicked during 2010.
2009 30 Rock NBC Universal $0.80
Comedy Central/
WGN America
Syndicated after Season 4.
2006 NCIS CBS $0.75 -
2009 How I Met Your Mother Fox $0.75 Lifetime Syndicated after Season 4.
2010 Glee Fox $0.50 Oxygen Network
Includes rights to make Glee themed specials. Also
surprisingly syndicated before the typical 4-season
mark.
2010 The Cleveland Show Fox $0.50
TBS and Fox
Stations
Syndicated before the typical 4 season mark.
2010 New Adventures of Old Christine Warner Bros. $0.35 Lifetime
2008 Lost ABC Studios $0.20 Syfy/G4
2007 Heroes NBC $0.30 G4
2006 Desperate Housewives ABC Studios $0.50 Lifetime
2010 Prison Break Fox $0.10 SiTV
2009 Ugly Betty ABC Studios $0.20 TV Guide
Very solid ratings performers in first run that
basically found "no home" in off-net cable
syndication compared to procedurals and
situation comedies.
Source: TV Guide, Broadcasting And Cable, TV By The Numbers, RBC Capital Markets
Domestically, content producers are also able to monetize situation comedies through local broadcast stations off-network, most often
through stripping. Much like the procedural drama, situation comedies are often somewhat self-contained. While characters are
generally more important than they are in procedurals, they probably aren’t as important as the overall storyline. Unlike with a
serialized drama, a viewer can come into a sitcom “cold” (without ever having seen an episode before) and follow the story.
Furthermore, the half-hour format of the sitcom fits scheduling needs well for adjacent access programming. Unlike procedurals,
however, sitcoms rarely have broad international appeal.
Media's New Opportunities From Old ThreatsApril 7, 2011
22. 22
Exhibit 20: Select Off-Network Series to Station Syndication
Off-Net
Launch Program Studio
Off-
Network
License
Fee/Episode
($ mm)
2001 King of the Hill 20th Century Fox FOX 3.0
2001 Everybody Loves Raymond CBS CBS 2.5
2002 Dharma & Greg 20th Century Fox ABC 2.8
2002 Will & Grace Warner Bros. NBC 1.3
2004 Malcolm in the Middle 20th Century Fox FOX 2.0
2005 My Wife and Kids Buena Vista/ABC ABC 2.2
2005 Bernie Mac Show, The Twentieth TV FOX 2.0
2006 According to Jim Buena Vista/ABC ABC 2.0
2007 Two and a Half Men Warner Bros. CBS 1.5
2009 Office, The NBC Universal NBC 1.8
2010 How I Met Your Mother 20th Century Fox CBS 1.4
Source: SNL Kagan
While syndication figures are less available on the international side, our industry sources indicate to us the major franchise shows
generally index around 1x for rest-of-world versus domestic. In other words, for a show like NCIS: LA, which generated ~$2.2 million
in domestic syndication revenues per episode in its first window, it should also generate ~$2.2 million for syndication in the rest of the
world.
But other non-procedural content is far more difficult to monetize internationally. Situation comedies, for example, while being
another major staple of both off-net cable and local broadcast programming, are incredibly difficult to monetize internationally.
Humor is a somewhat culturally driven sensibility and it varies from country to country. For this same reason, the film industry has
tended to focus on action adventures for tent-pole movie production since it is far easier to monetize abroad than comedies.
One odd hybrid method of monetization (not quite first-run and not quite monetization) of non-fiction based programming is the sale
of not actual content, but rather content format. For example, The Biggest Loser may not syndicate well, nor may Real Housewives of
Orange County, but the producers of that content (Fox through Shine Media Group and NBC Universal, respectively) are able to sell a
format to local producers. We have also seen such an opportunity with situation comedies as well. There is almost no expense
associated with a sale (they come from existing scripts and developed ideas), and they offer very little risk to the buyer since the
content tends to have at least some sort of proven track record. That said, international companies have tended to fair much better in
that competitive landscape than have domestic U.S. producers.
Exhibit 21: International TV Programming Sales by U.S. Suppliers
0
500
1,000
1,500
2,000
2,500
3,000
3,500
4,000
4,500
1998
1999
2000
2001
2002
2003
2004
2005
2006
2007
2008
2009
20102011E2012E
2013E2014E
2015E2016E2017E
(in$mm)
Source: RBC Capital Markets estimates and SNL Kagan
Media's New Opportunities From Old ThreatsApril 7, 2011
23. 23
Exhibit 22: Content Creation/Monetization Chain
Domestic Syndication To Cable Nets
Domestic Syndication To Broadcast
International Syndication
First Run TV Content License Fees
Studio Produces TV Show
Source: RBC Capital Markets
Additionally, new OTT distributors (such as Netflix and Hulu) are providing another new window for distribution revenues. These
deals tend to be more multi-title package (or library) based, as opposed to being priced by title. It’s unclear how large a market OTT
could become, but it has grown to a substantial marketplace from virtually nothing in only a few short years. We expect the OTT
ecosystem to be a new and highly effective platform for the monetization of content that was historically under-exploited.
In the initial examples below, reflective of the first stage of evolution of the ecosystem, OTT distributors have generally taken the
form of purchasing content that was historically leveraged on traditional syndicated platforms—TV sitcoms and some dramas—that
had essentially played themselves out in the traditional syndication world. In other words, much of this content was simply
unsyndicatable: it was either too old and circulated for a new buyer to come in and pay a material price for exclusivity (in fact, in the
case of the recent CBS deal, much of it was actually available for free on the web), or it was a premium serialized drama that was very
difficult to syndicate.
Media's New Opportunities From Old ThreatsApril 7, 2011
24. 24
Exhibit 23: Recent Online Syndication Deals
Studio/Network
Online
Distributor Terms Content Comments
Disney/ABC Netflix
Press reports indicate
~$200mm/year, one-year
deal.
Previous seasons of current series on
ABC such as Grey's Anatomy , old
series such as Lost , ABC
Family/Disney Channels that have
aired as recently as 15 days prior.
Previously, cable channel content was
generally not available on-line.
CBS Netflix
Press reports indicate
~$100mm/year, two-year deal,
non-exclusive.
~10% of CBS/Paramount TV archive
library. Examples include Family
Ties, Cheers, Star Trek, etc.
Virtually all of this content was
available for free on ad-based
streaming basis at CBS.com
Viacom/Comedy
Central/MTV
Hulu/Hulu
Plus
Terms unknown
Content includes recent episodes of
Jon Stewart, Colbert and Jersey
Shore.
Previously, cable channel content was
generally not available on-line.
Time
Warner/Warner
Brothers
Netflix $200K/episode
Off network syndication rights to
Nip/Tuck.
Given the risqué content and limited
number of runs, this content would
have gone largely unmonetized
through traditional distribution.
Kevin
Spacey/David
Fincher
Netflix
Not disclosed, but press
reports indicate ~$4mm per
episode, for 20 episodes.
First run syndication deal for original
series "House of Cards".
First major initiative for programming
on Netflix as "first window" content.
News Corp./20th
Century Fox
Netflix Terms unknown
First season of Glee, first two
seasons of Sons of Anarchy, library
series such as Ally McBeal and The
Wonder Years
Non-exclusive multi-year agreement;
extension of a prior agreement that
included several library series
Source: RBC Capital Markets and company reports
Future Monetization of TV Content Is at the Heart of the OTT Conflict
The conflict that these OTT monetization opportunities highlight is the following: if the content companies attempt to increase
monetization of content by pulling it forward to certain new windows (à la OTT), they run the risk of pulling the viewer from other
windows that are further back. Thus, they could cannibalize the existing highly profitable ecosystem with the incremental, emerging
one. We think concerns over the issue, given the incremental content approach, have probably been overstated.
Monetizing Primetime Content
So how does a network monetize the cost of content for that initial “first window” period? Traditionally, the answer lies largely in the
amount of advertising revenue a distributor (TV network or individual station) can generate to help offset the cost of content. The key
driver in that assessment is the cost per thousand eyeballs (or CPM) that a network can generate during the program. These CPMs for
primetime broadcast network programming typically range from ~$20 at the low end to ~$40 at the higher end. For cable networks,
CPMs have traditionally fallen anywhere from 30% to 50% lower than they are for the broadcast nets. However, the cable networks
tend to have a) lower programming costs overall (they tend to re-run more of their original programming often), b) affiliate fees to
supplement advertising revenues (though clearly with retransmission consent fees, broadcast networks are likely to benefit from a
similar model), and c) the ability to retain more of the total amount of advertising units available for a show—broadcast networks
allocate a far greater proportion of advertising commercials, or units, to their broadcast affiliates versus cable networks, which allocate
far less to the local cable systems that serve as their primary distribution vehicles. The chart below illustrates typical primetime costs
per unit of advertising (30 second spots) for broadcast networks during the Fall/Winter 2010 schedule.
Media's New Opportunities From Old ThreatsApril 7, 2011
25. 25
Exhibit 24: Illustrative Cost Per Spot for Fall Season 2010 (in $ 000's) -- Broadcasting
Networks Spot Sunday Monday Tuesday Wednesday Thursday Friday Saturday Additional Comments
8PM 127 204 107 111/114 91 60 100 Saturday night ABC College Football.
9PM 210 204 167 193/141 222 75 Grey's Anatomy on Thursday at 9 on ABC is standout.
10PM 131 134 112 117 142 71
8PM 115 142/151 150 153 195/113 60 22
9PM 153 206/190 154 121 147 84 30 Two and a Half Men on Monday at 9PM is standout.
10PM 101 134 109 110 156 68 34
8PM 415 94 134 91 66 50 16 Sunday Night Football on NBC is standout along with The Office
9PM 137 134 95 213/122 50 22 Thursday night The Office is major driver for NBC.
10PM 87 100 81 99 68 37
8PM 253/188 226 272 100 132 62 41/45 Glee on Tuesday Night is a major CPM driver.
9PM 259/173 140 125 121 122 62 47
High 259 226 272 193 213 84 100
Low 131 87 100 81 91 50 22
Average 197 137 149 119 140 65 40
Average For Week 121
Average Audience -- 18 - 49 Demographic 4.0mm
Average CPM $33
Note: / delineates half hour shows. Additionally, we have not included the CW, where CPMs are ~30% to 70% lower, on average.
Fox
ABC
CBS
NBC
Fridays and Saturdays are the graveyard of TV with
lowest audiences and unit cost.
Source: RBC Capital Markets, Ad Age
The other major driver for advertising revenue in a network TV program is the audience watching the show. In its most simplistic
form, the revenue of a show is the total number of “M”s multiplied by the CPM, or total number of 1000 eyeballs times cost per 1000
eye balls:
Audience/1000 * CPM * Number of Commercials = Total Advertising Revenues
In reality though, a) the network doesn’t keep all the advertising units that are run in a show (in a broadcast network, ~10–12 of the 32
units, which are ~30 seconds in length in any hour of prime-time programming, are allocated to the local stations, while ~22 are
allocated to the broadcast network or cable network), and b) the total audience isn’t the audience that is actually monetized, it’s rather
target demographic. Generally, we speak in terms of 18 to 49–year-olds for primetime broadcast networks (cable networks often have
more niche demographic targets). So, the core audience population of 18 to 49–year-olds is ~131 million in the U.S. A rating point
represents one percent of this population in the target demo. In general, we quote audience sizes where each rating point is a
percentage of the U.S. TV population in that demographic group and equals: 2.90 million viewers, 1.31 million adults 18 to 49, 0.68
million adults 18 to 34 and 1.24 million adults 25 to 54.
Even for a broadcast network, the average program is monetized twice off of its original license fee. It’s monetized in one premier run
(usually during the Fall and Spring) and one rerun (usually during the Summer or Winter).
Media's New Opportunities From Old ThreatsApril 7, 2011
26. 26
Exhibit 25: Cable CPMs and Cable Ratings Trail Broadcast, Leading to Different Monetization Models
Primetime CPMs
$13
$28
$0
$5
$10
$15
$20
$25
$30
Cable -- Top 10 Broadcast
Primetime Ratings
0.83%
2.50%
0.0%
0.5%
1.0%
1.5%
2.0%
2.5%
3.0%
Cable -- Top 10 Broadcast
Given that cable gets half the CPM and 30% to 50% the ratings (for a premium, top 10 rated network), the cable
network needs to monetize original content more efficiently. This is accomplished through multiple runs of the
same episode. Additionally, affiliate fees help defray costs that advertising cannot cover.
Source: RBC Capital Markets estimates
The chart below is an attempt to illustrate the economics of primetime broadcast TV show, assuming a range of production costs, as
well as CPMs and audience levels. Note that we have made some assumptions about audience levels and CPMs across genres and
seasons. Ratings are somewhat seasonal with the third quarter being lower than average. But generally, broadcast networks will
average ~2.5–2.75 Adult 18 to 49. We think reruns tend to generate audiences ~60% of first run, on average. Comedies tend to repeat
better than serialized dramas. Interestingly, the economics reflected in the chart below are not inclusive of the impact of
retransmission consent payments, which when allocated to particular programs, could greatly enhance profitability.
Media's New Opportunities From Old ThreatsApril 7, 2011