1. Utilities Sector, Electric Utilities Industry
Alliant Energy Corporation (LNT)
1
Market Profile
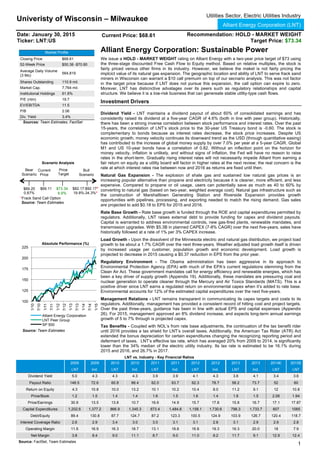
Closing Price $68.61
52-Week Price $50.38 -$70.80
Average Daily Volume
(3 Mo)
564,819
Shares Outstanding 110.9 mil.
Market Cap. 7,764 mil.
Institutional Holdings 61.8%
P/E (ntm) 19.7
EV/EBITDA 11.5
P/B 2.06
Div. Yield 3.4%
Sources: Team Estimates, FactSet
Scenario Analysis
*Frack Sand Call Option
Source: Team Estimates
Source: Team Estimates
Alliant Energy Corporation: Sustainable Power
We issue a HOLD - MARKET WEIGHT rating on Alliant Energy with a two-year price target of $73 using
the three-stage discounted Free Cash Flow to Equity method. Based on relative multiples, the stock is
fairly priced versus other firms in its industry. However, we believe the maket is not fairly pricing the
implcict value of its natural gas expansion. The geographic location and ability of LNT to serve frack sand
miners in Wisconsin can warrant a $10 call premuim on top of our secnario analysis. This was not factor
in the target price because if LNT does not pursue this expansion, the call option can expire to zero.
Morever, LNT has disticnctive advatages over its peers such as regulatory relationships and capital
structure. We believe it is a low-risk business that can genereate stable utiltiy-type cash flows.
Investment Drivers
Dividend Yield - LNT maintains a dividend payout of about 60% of consolidated earnings and has
consistently raised its dividend at a five-year CAGR of 4.6% (both in line with peer group). Historically,
there has been a strong inverse correlation between stock performance and interest rates. Over the past
15-years, the correlation of LNT’s stock price to the 30-year US Treasury bond is -0.60. The stock is
complementary to bonds because as interest rates decrease, the stock price increases. Despite US
economic growth, money velocity continues its downward trend as the USD (through quantitative easing)
has contributed to the increase of global money supply by over 7.0% per year at a 5-year CAGR. Global
M1 and US 10-year bonds have a correlation of 0.82. Without an inflection point on the horizon for
money velocity, inflation is unlikely, and without signs of inflation, the Fed will have no reason to raise
rates in the short-term. Gradually rising interest rates will not necessarily impede Alliant from earning a
fair return on equity as a utility board will factor in higher rates at the next review; the real concern is the
rate at which interest rates rise between now and 2016 as returns are fixed until then.
Natural Gas Expansion - The explosion of shale gas and sustained low natural gas prices is an
increasing popular alternative than propane and electricity because it is cleaner, more efficient, and less
expensive. Compared to propane or oil usage, users can potentially save as much as 40 to 60% by
converting to natural gas (based on two-year, weighted average cost). Natural gas infrastructure such as
the construction of Marshalltown Generating Station and Riverside Expansion provides growth
opportunities with pipelines, processing, and exporting needed to match the rising demand. Gas sales
are projected to add $0.18 to EPS for 2015 and 2016.
Rate Base Growth - Rate base growth is funded through the ROE and capital expenditures permitted by
regulators. Additionally, LNT raises external debt to provide funding for capex and dividend payouts.
Capital is warranted to address environmental controls, new gas-fired plants, renewable mandates, and
transmission upgrades. With $5.3B in planned CAPEX (7-8% CAGR) over the next five-years, sales have
historically followed at a rate of 1% per 3% CAPEX increase.
Load Growth - Upon the dissolvent of the Minnesota electric and natural gas distribution, we project load
growth to be about a 1.7% CAGR over the next three-years. Weather adjusted load growth itself is driven
by increased usage per customer, population growth and economic development. Load growth is
projected to decrease in 2015 causing a $0.37 reduction in EPS from the prior year.
Regulatory Environment - The Obama administration has been aggressive in its approach to
Environmental Protection Agency (EPA) with much of the EPA’s current regulations stemming from the
Clean Air Act. These government mandates call for energy efficiency and renewable energies, which has
been a key driver of supply growth (Appendix 19). Additionally, these mandates are pressuring coal and
nuclear generation to operate cleaner through the Mercury and Air Toxics Standards (MATS). This is a
positive driver since LNT earns a regulated return on environmental capex when it’s added to rate base.
Environmental accounts for 12% of the estimated capital expenditures over the next five-years.
Management Relations - LNT remains transparent in communicating its capex targets and costs to its
regulators. Additionally, management has provided a consistent record of hitting cost and project targets.
Over the past three-years, guidance has been in line with actual EPS and capital expenses (Appendix
26). For 2015, management approved an 8% dividend increase, and expects long-term annual earnings
growth of 5 to 7% through is projected capex.
Tax Benefits - Coupled with NOL’s from rate base adjustments, the continuation of the tax benefit rider
until 2016 provides a tax shield for LNT’s overall taxes. Additionally, the American Tax Rider (ATR) Act
extended the bonus depreciation for certain expenditures changing the recognizing reporting period and
deferment of taxes. LNT’s effective tax rate, which has averaged 20% from 2009 to 2014, is significantly
lower than the 34% median of the electric utility industry. Its tax rate is estimated to be 16.1% during
2015 and 2016, and 26.7% in 2017.
Bear
Scenario
Current
Price
Price
Target
Bull
Scenario
$69.20
0.87%
$69.11 $73.34
6.9%
$82.17-$92.17*
19.8%-34.3%*
100
125
150
175
200
225
1/10
7/10
1/11
7/11
1/12
7/12
1/13
7/13
1/14
7/14
1/15
Absolute Performance (%)
Alliant Energy Corporation
LNT Peer Group
SP 500
Date: January 30, 2015
Ticker: LNT:US
Current Price: $68.61 Recommendation: HOLD - MARKET WEIGHT
Target Price: $73.34
2009 2009 2010 2010 2011 2011 2012 2012 2013 2013 2014E 2015E
LNT Ind. LNT Ind. LNT Ind. LNT Ind. LNT Ind. LNT LNT
Dividend Yield 5.0 4.3 4.3 4.3 3.9 3.9 4.1 4.3 3.6 4.1 3.4 3.6
Payout Ratio 148.5 72.6 60.8 88.4 62.0 63.7 62.3 78.7 58.2 73.7 52 60
Return on Equity 4.3 10.8 10.0 13.2 10.1 10.2 10.4 8.0 11.2 9.1 12 10.8
Price/Book 1.2 1.5 1.4 1.4 1.6 1.5 1.6 1.4 1.8 1.5 2.06 1.94
Price/Earnings 30.9 13.5 13.8 10.7 16.6 14.9 15.7 17.8 15.8 16.7 17.1 17.87
Capital Expenditures 1,202.6 1,377.2 866.9 1,345.3 673.4 1,484.8 1,158.1 1,730.6 798.3 1,733.7 607 1085
Debt/Equity 89.4 130.8 87.7 124.7 87.2 123.3 100.5 124.9 103.9 126.7 120.4 118.7
Interest Coverage Ratio 2.6 2.9 3.4 3.0 3.0 3.1 3.1 2.8 3.1 2.9 2.9 2.8
Operating Margin 11.6 16.9 16.3 18.7 13.1 18.8 16.8 19.3 16.3 20.0 18 7.9
Net Margin 3.8 8.4 9.0 11.1 8.7 9.0 11.0 8.2 11.7 9.1 12.9 12.4
Source: FactSet, Team Estimates
LNT vs. Industry - Key Financial Ratios
Univeristy of Wisconsin – Milwaukee
2. 2
Business Description
Alliant Energy Corporation is as a utility holding company that provides regulated electricity and natural
gas service to 1.4 million customers in Iowa, Minnesota, and Wisconsin. It operates through two public
utility subsidiaries: Interstate Power and Light Company (IPL) and Wisconsin Power and Light Company
(WPL). In addition, LNT maintains a non-regulated Resources Portfolio of wholly owned subsidiaries and
additional investments. The company was founded in 1981 and is headquartered in Madison, WI.
LNT generates revenue by providing electricity, natural gas, and steam to its customers by charging a
fixed rate for their use. Rates and return on equity are regulated by the Public Service Commission of
Wisconsin (PSCW) and Iowa Utilities board (IUB), which makes LNT a regulated electric utility. LNT
Company revenues are generated through four segments:
Ø Utility Electric Operations - Its 69,000 mile territory covers 992,408 customers. This accounts for
83% of total operating revenues in 2013. Sales increased 3.9% from 2012-2013 because of a
below-average colder winter, which increased demand per customer. For the next three-years,
electric sales are projected to grow at a weather adjusted 1.9% CAGR.
Ø Utility Gas Operations - In 2013, 417,210 natural gas customers were serviced providing 14% of
total operating revenues. Sales increased 17.4% from 2012-2013 due to the polar vortex. 2014
natural gas sales are projected to grow 4.6% due to increase customer expansion in natural gas.
Ø Utility Other - Includes steam operations and the unallocated portions of the utility business.
Ø Non-regulated, Parent and Other - Includes administrative support services.
IPL supplies electric and natural gas services in selective markets in Iowa and southern Minnesota to
53% and 56% of LNTs customers, respectively. WPL services electric and natural gas services in
selective markets in Wisconsin to 46% and 44% of LNT’s customers, respectively. Both IPL and WPL
have base rate freezes, which keep electric rates unchanged through the end of 2016. Neither IPL nor
WPL own or operate electric transmission facilities; however, IPL and WPL use of ITC Midwest (ITC) and
American Transmission Company (ATC) transmission systems. LNT also has 16% ownership of ATC.
IPL and WPL own a generation portfolio that includes nearly 1,200 megawatts of generated renewable
and alternative energy sources. In addition, LNT acquires energy from renewable sources beyond its
renewable portfolio standards. The portfolio generation comes from wind farms (8% of total generated
power) across Iowa, southern Minnesota and Wisconsin, with a small amount from biomass and biogas.
Additionally, Iowa is the number two state for wind power generation.
LNT’s Resource Portfolio contains several natural gas-fired generating facilities in Wisconsin and Iowa.
In addition, it manages CRANDIC (short-line freight business), IEI Barge Services (storing and loading of
dry bulk), Williams Bulk Transfer (coal terminal station), and other non-regulated investments including
the Whiting Petroleum tax sharing agreement receivable. The final receipt of the LNT’s tax separation
agreement with Whiting Petroleum was received in 2014.
Company Strategies
The company’s strategic plan focuses on three key elements:
Ø Competitive Costs - Provide predictable energy and control costs to maintain competitive rates for
its customers. In order to better focus on customer demands, LNT signed an agreement to sell
IPL’s Minnesota electric and gas distribution business for $128 million in 2015. This represents
less than 4% of LNT’s customer base.
Ø Safe and Reliable Service - Focus on upgrading infrastructure to continually improve service. In
addition to electric transmission upgrades, LNT works maintains and expands natural gas
distribution systems in its service territories to serve new customer demand. Maintenance and gas
system expansions are projected to be $150 and $75 million, respectively.
Ø Balance Generation - Maintain a flexible portfolio of resources that includes natural gas, coal,
Power Purchasing Agreements (PPA), and renewables while adhering to emission controls and
regulation. LNT’s generation fleet protects it from relying on one fuel source or PPA, and provides
diversity in choosing the most cost effective power source.
PPAs and purchased electricity from wholesale energy markets help to meet the electricity demand of
customers and accounts for 40% of LNT’s power sources in 2013. PPA’s are expected to decrease due
to the renewal of the Duane Arnold Energy Center (DAEC) nuclear Purchase Power Agreement (PPA)
not containing minimum payments for electric generating capacity.
Management Direction - The company increases shareholder value by constantly raising the dividend.
Management increased dividend consecutively for the past five-years at a 4.6% CAGR. Additionally,
future strategic investments focused on electric and gas distribution, environmental controls and new
generation investments such as the Marshalltown Generating Station and Riverside Expansion to
generate reasonable return on invested capital.
Industry Overview and Competitive Positioning
Interest Rate Environment - The Federal Reserve policy of quantitative easing and its aftermath has
exacerbated the falling interest rate environment. The regulated utility industry is highly sensitive to interest
rates because it is regulated, capital intensive, and a primary return driver is dividend yield. Regulated
utility rates are predetermined by operating cost, capital investments, and the cost of capital.
Source: Company
Source: Company
Source: Company, Team Estimates
1924-1925
WPL & IPL
created separately
through
consolidation
1953
WPL takes over
IPL’s Wisconsin
operations
1981
LNT is incorporated
1988
WPL Holdings, Inc.
is established
1990
IPL merges with IES
2014
LNT announces to sell
Minnesota operations
Time Line
Source: Company
American Transmission Co (ATC): LNT
owns a 16% ownership interest. ATC is an
independent transmission company that
allows energy producers to transport
electric power from where it’s generated to
where it’s needed. During 2013, ATC
distributed $34 million in the form of
dividends to LNT (1.1% of 2013 revenues).
5.88% CAGR
3. 3
Regulators set utility rates partially
based on the cost of debt, which is i
Regulators set utility rates partially based on the cost of debt, which is influenced by new interest rates
derived from the new issuance of debt for capital investments. If interest rates rise, then cost of debt will
rise above its allowable returns and this negatively impacts earnings until the next rate case in 2016. The
opposite is true as rates fall. Rising interest rates also make the sector less attractive as its dividend yield
does not necessarily rise with rates on comparative investments with similar risk. Given the record low
interest rate environment and investor demand for yield, utility stocks are trading at high multiples. Alliant
Energy benefits from this environment because its 3% dividend yield is much more attractive than the
current less than 2% yield from a 10-year US Treasury (Appendix 18). However, if interest rates rise then
it would hurt the firm and its sector resulting in a compression in both relative and absolute utility
valuations.
Seasonality - The volatility in weather makes predicting heating and cooling degree days relatively
difficult. LNT’s heating and cooling days, the difference between average daily temperatures and a base
of 65 degrees Fahrenheit, were above the its normal degree days by 7 and 17%, respectively. In 2014,
the Midwest heating days were 12% below, and cooling days were not calculated because temperatures
were in range of normal. However, retail and commercial customers demand dynamics are pegged
towards the seasonality of weather. After seasonal weather and inventory adjustments, natural gas can
be shown to track that of WTI crude oil prices. Warmer than average winters, along with greater
efficiency in electric powered appliances, will drive down demand.
Regulation - Utility companies are natural monopolies that provide a necessary service to its customers.
To provide protection from high rates, the federal government established the Federal Energy Regulatory
Commission (FERC). Over the last 15-years, wholesale power markets were deregulated to allow for
more competition. On April 24, 1996, Order 888 was established and addressed two important issues:
transmission service and stranded costs. Order 888 required utility companies that had transmission
lines to provide transmission service for wholesale transactions on an open, nondiscriminatory basis.
Stranded cost occurs when a utility is unable to recover its investment in plants and deferred cost occurs
when wholesale customers switch providers. FERC endorsed the idea of full recovery of stranded cost.
On December 20, 2000, Order 2000 was established, reaffirming the FERC position on developing a
competitive power market by encouraging public and nonpublic utilities to replace the control of
their transmission facilities from independent to regional transmission organization. Regional
transmission organizations were created to eliminate discrimination and increase efficiency and reliability.
Current regulation that could affect LNT is the physical security of the U.S. electric grid. Severe cold
weather or a cyber-attack can cause outages in different regions. Requirements to build a more
sophisticated and interconnected power grid are a leading issue with lawmakers. The effect of new
legislation will benefit Alliant Energy because it will have to spend more funds to update its grid, which it
will earn earnings based on regulated cost of capital.
EPA Reduction of Emissions - The Obama administration has deployed executive authority to reduce
carbon pollution by 30% from the 2005 levels. Currently, the utility sector accounts for one-third of all
greenhouse gas emissions; however, the Clean Power Plan will require the utility sector to cut carbon
pollution from its current plants and future plants by 25% by 2030 (Appendix 19). LNT has been proactive
by restructuring current plants to use natural gas or cleaner coal rather than existing coal, and its future
plants are powered by natural gas. The management team has set forth an environmental compliance
strategy in which they will spend $615 million to have better emission controls and improved efficiency.
The environmental compliance strategy has driven LNT to retire and sell 943 MW of plants to reduce
emission. Another industry example, Wisconsin Energy, finished its Power the Future campaign. Its plans
deployed capital to reduce carbon emission by building more efficient plants as well as convert existing
plants to natural gas powered plants.
Competitive Positioning
Coal Consumption - EPA rules pressure coal fired generation plants to be cleaner and more efficient.
The EPA projects that the standards will lead to the shutdown of roughly 10% of the US coal-fired
generation. These trends are shifting the power generation fleet away from coal and toward natural gas
and renewables over the next few years. The majority of LNT’s competitors purchase coal from the
Wyoming Powder River Basin of Wyoming and Montana. LNT’s coal consumption constitutes 48% of
LNT’s power source and is primarily transported by rail car from the Wyoming Powder River Basin.
Powder River coal costs less, but has lower-energy content. LNT new generation projects, such as
Riverside, shifts away from the lower output coal.
Interest Rate Sensitivity - LNT is sensitive to interest rates, as U.S. treasury yields rise, the stock price
falls, as seen below. From 1971 till 2000, utilities were inversely correlated with the ten-year treasury at -
0.77. More recently, through quantitative easing, the utilities industry has been less inversely correlated
at -0.59. Currently, competitive positioning in this environment lends Alliant to a favorable position to take
on cheaper debt and expanded its business. Conversely, it also exposes them to increasing yields.
Utility Sector P/E vs. 15 yr. Historical Avg.
Source: FactSet
Source: Bloomberg
Oil vs. Natural Gas
Source: Bloomberg
US Renewables GWH
Source: EIA Short-Term Energy Outlook
0%
1%
2%
3%
4%
5%
6%
$0
$10
$20
$30
$40
$50
$60
$70
2005 2006 2007 2008 2009 2010 2011 2012 2013 2014
LNT vs. US 30-yr Bond vs. US Utility Div. Yield
Alliant Energy Corporation - Price (Left) US Benchmark Bond - 30 Year - Yield (Right)
United States / Electric Utilities -IND - Div Yld - LTM (Left)
Source: FactSet
Fed reveals
quantitative
easing
Fed begins talks
about tapering
quantitative easing
4. 4
Competitive Markets - High-volume customers have the option to relocate to a different service territory
with lower rates or buy power from an independent producer. A large industrial customer could turn to
self-generation or nontraditional energy sources. Retail electric customers do not have the ability to
choose their electric provider, and IPL and WPL have obligations to serve all retail electric customers in
its service territory. Although electric service is regulated, IPL and WPL still face competition from self-
generation by large industrial customers, owners of distributed generation, and alternative energy
sources. Major customers for LNT include John Deere and Kohler Company. IPL has higher sales
concentration with industrial customers with exposures to market cyclicality. Compared to the US
average, LNT rates per $/kWh sales are in line with the industry average.
Load Growth - Utility companies form a natural monopoly in its service territory; furthermore, growth in
service territory is driven by new housing starts. An improving economy spurs job growth and wage
growth. Recent improvements in housing should follow this trend. Low interest rates are also promoting
new home sales. As economic growth drives these factors higher, regulated utility companies must meet
this new demand by expanding its generating capacity. As new home construction increases utility
companies are then provided with more customers to service. New housing starts have increased at a
three-year CAGR of 7.8% for WPL and 6.8% for IPL.
Retail customers are the more stable portions of regulated utility companies’ cash flow; however, retail
sales have contracted because of advancements in energy efficiency. According to the EIA, U.S. new
homes built from 2000-2009 are 30% larger than homes built before 2000. While this should benefit utility
companies, new homes built from 2000 to 2009 only consume 2% more energy than homes built before
2000 as houses have become more energy efficient. The combination of commercial and industrial
customers’ revenue has offset stagnant retail growth. Traction in economic growth will drive demand for
electricity. From these segments, as the economy improves, commercial building will result from the
creation of small businesses as well as expansion by multi-national firms. For example, John Deere is
one of LNT largest customers in its Iowa territory. Deere capacity utilization of its plants is highest during
acceleration of growth in the economy, which leads to escalated demand for power.
Rate Base Growth - Utilities are allowed to earn a regulated return on capital expenditures when added
to rate base. Capital investments through environmental controls, new plant construction, transmission
upgrades, and renewable mandates drive the ROE and capital structure permitted by the regulators
(Appendix 25). To grow rate base, good relations and transparency with regulatory and political officials
are warranted. Furthermore, utilities that have a strong relationship are able to reduce regulatory lag and
make a stronger case for infrastructure investment. According to Standards and Poor’s, Iowa and
Wisconsin have extremely favorable policies with regulators; however, the average awarded and
requested ROE has decreased across the US. (Appendix 24). LNT’s Marshalltown Generation Station
was awarded an 11% ROE, which is currently above the 10% industry average. The Marshalltown
investment should drive above average earnings and consistent returns in a low risk regulatory
environment.
Purchasing Power Agreements - Purchasing Power Agreements allow utilities to have contracts with
power generating stations in order to provide energy needs and additional capacity. Additionally, utilities
are required to provide electricity from renewable and alternative generators. PPAs can fill these
requirements by locking in prices without being exposed to variable pricing in the wholesale market. LNT
has multiple PPAs, and relies on these contracts to provide a balanced generation portfolio to meet
customers’ demands. LNT’s DAEC PPA was renewed in 2014 and does not contain minimum payments
for electric generating capacity. The elimination of purchased electric capacity payments provides
flexibility in choosing an appropriate power source. With natural gas prices low, it’s advantageous not to
rely on this PPA, or run un-cost effective plants and make purchases from the wholesale market.
Meters - Energy efficiency programs and the impact of smart grid meter deployment provide customers
better information on power usage. Currently, over 43% of the US is served by smart grid meters
(Appendix 14). These devices provide utilities with information on usage trends and corresponding ways
to improve electrical usage. WPL reached full deployment of meters to customers in 2011. IPL is
currently testing pilot programs.
Alliant Energy’s Call Option: An Industrial Growth Opportunity
Alliant Energy is uniquely positioned to service miners like Hi-Crush Partners LLC (HCLP), Emerge
Energy Services (EMES), and US Silica (SLCA) located in rural Wisconsin. If demand for industrial gas
distribution to these miners can be formally established, regulatory approval is almost certain as Alliant
Energy is required accommodate the demand of its service area. The possibility of rapid future expansion
of LNT’s gas distribution is not currently priced into consensus estimates as discussed at the end of the
Valuation Section (p.9).
Four million pounds of sand may be required to frack just a single well and these large scale incumbent
firms supply frack sand to drilling companies across all of the major shale deposits in the United States.
Wisconsin is centrally located in the US with cost effective access to the major railways used to transport
the sand. In addition, Wisconsin has stellar geology when it comes to sand quality. Wisconsin’s white
quartz sand is rounded compared to the common brown sand located around regions like Texas’ Eagle
Ford shale deposit where most of US shale drilling activity currently takes place. Oil and gas E&Ps like
Pioneer Natural Resources (PXD) has discovered that by blasting more quartz sand through the porous
shale, output per well can increase by over 30%. These superior results imply low double-digit demand
growth for quartz sand through 2020 (Wall St. Journal, Aug. ‘14). The supply disparity is so great that
SCLA, the largest of the three aforementioned miners, has sold out production through mid-2018. To
combat the sand shortage, each of frack sand majors has devoted significant CAPEX toward boosting
Wisconsin production. HCLP is on pace to triple its production by the end of 2016, while EMES will
increase its production by about two-thirds over the same time period. Meanwhile, SLCA will double its
production by the end of 2017.
Source: EIA
Housing Starts vs. Unemployment
Source: Bloomberg
2014 Capital Expenditures in Millions
Source: Company
YoY US Sales vs. WPL vs. IPL Sales
Source: EIA
5. 5
The rapid adaptation of using more frack sand has undoubtedly exacerbated US overproduction with oil
inventories at record levels. In just four-years, the US has gone from supplying 4% to 8% of global oil
supply. As the US reduced oil imports, the US economy has strengthened along with the US dollar (up
20% against currency major basket JPY, CNY, EUR in just five-years), which in turn has made all
commodities denominated in US dollars more expensive to foreign countries on a relative basis. In the
face of oversupply coupled with weaker global demand (in part because of the stronger US Dollar), a 40%
decline in WTI Crude Oil prices has been witnessed since October 2014. The peak downward acceleration
was spurred by Saudi Arabia’s firm stance to maintain current output levels at the annual OPEC meeting
on November 27th. Natural gas prices, which are highly correlated to oil prices and future gas output
projections, have followed suit.
Amidst commodity price and energy sector volatility, it is important to point out that Eagle Ford drillers,
which are located near the bottom of the US oil production cost curve, can extract oil profitably even at a
$40-$50 WTI spot rate. Eagle Ford’s advantage is a result of not only good geology, but the utilization of
quartz sand, which is currently limited on the supply side. As of October 2014, only about 20% of drillers
were using an optimal quantity of frack sand, but this relatively new technique could be applied to 80% of
all shale wells if enough sand were made available (RBC Capital Markets, Oct. ‘14). As more quartz sand
becomes available, a parallel shift downward in the US oil production cost curve becomes a realistic
possibility. In order to remain cost competitive, the entire shale drilling industry, especially the abundant
highly leveraged oil and gas E&Ps, will be forced to bear the cost of using more sand at best and avoid
bankruptcy at worst. Meanwhile, sand demand from Wisconsin is expected to remain relatively inelastic.
When first mined, sand is wet and weighs about 3500lbs/yd3, but sand only weighs 2700lbs/yd3 when
dry; frack sand miners would therefore incur 30% higher costs to ship wet sand by rail than to ship dry
sand by rail. To alleviate this problem, miners bake the sand in ovens to remove the moisture. Given the
remote location of many rural Wisconsin sand mining operations, LP is currently the preferred energy
source to heat the ovens due to lack of economically available alternatives. By converting from LP to
natural gas (which are both cheaper than electricity), miners could potentially save on production costs
while Alliant Energy’s natural gas segment of operations would experience significant growth.
Financial Statement Analysis
Financial statement analysis highlights important details about LNT’s historical income statement and
balance sheet line items as well as justification for many forecasting assumptions. Sales are forecasted
to grow as the benefits of CAPEX are realized. LNT is purchasing less power than it has in the past, as
well as realizing operational efficiency through scale and reduced need for manpower. LNT can
comfortably cover interest expenses in a low interest rate environment, and enjoys favorable tax
treatment relative to its competitors. Earnings and reporting quality are high. When combined, these
factors lead to persistent FCFs, which will lead to higher future dividends and earnings. Each subheading
indicates the appropriate appendices to be read alongside written analysis.
Income Statement (Appendix 2); Assumption Summary (Appendix 1)
Source: Team Estimates
Sales Growth & Margin Stability - LNT has a three-Year CAGR for consolidated sales and EBIT of
1.8% and 5.6%, respectively. Alliant Energy’s electric segment (82% of total revenue and EBIT
contribution) and the gas segment (15% of total revenue and 10% of EBIT contribution) deserve primary
attention when analyzing LNT’s top line growth and operating margins. While the other two operating
segments are growing faster, in particular LNT’s non-regulated investment in ATC, contribution to total
sales is still relatively small and/or operations are just becoming profitable.
2014’s Q4 estimates are partially based on LNT’s Q3 YTD performance and updated balance sheet.
Seasonality was taken into account after reviewing LNT’s last 40 quarters. Quarterly sales as a
percentage of annual sales are as follows: Q4 is 25% and the least volatile based on standard error;
during peak capacity in Q3, 27% of sales are realized; Q2 falls in at just 22%; and Q1 represents 26%
with the greatest historical volatility.
Sales growth in 2015 was originally estimated to be on the low side due to more extreme weather
conditions in 2014, including the relatively new weather phenomena known as a polar vortex which drove
arctic air across LNT’s service area in Q1 of 2014. Our sales growth expectations are further reduced by
LNT’s planned sale of the MN operating segment (2.5% of 2013 base assets). The $0.27 reduction in
2015 EPS is expected to be partially offset by the trend of improving sales and SG&A synergies in the
non-electric operating segments. Dividends are on pace to grow by 9.7% based on our payout
projections of 60% net income.
Fiscal year 2016’s EPS driver graph is a better representation of LNT’s historical and future earnings
growth. Sales will rise 3.5% as LNT begins to feel the benefit of CAPEX increases and from WPL’s late
cycle exposure to industrials; EPS will increase $.022 YOY at 6.0% with a similar increase in dividends.
Primary Shale Deposits
Source: EIA
Natural Gas Expansion
Source: EIA
USD vs. JPY/CHY/EUR
Source: FactSet
3M Rolling Energy Sector Volatility
Source: FactSet, Team Estimates
YoY Margins as % of Sales
Source: FactSet, Team Estimates
Jan. ’10 to Jan. ‘15
6. 6
Cost of Goods Sold - Of recent significance, is LNT’s reduction of Purchased Electricity made possible
through newly drafted Purchasing Power Agreements (PPAs). As previously discussed under industry
analysis, this cost reduction is a driver for future improvement of operating margins and higher earnings.
Rate mechanisms and derivatives help to establish +/- 2% commodity input corridor that is already
reflected in the income statement without need for further adjustment. The ability to pass some of the
costs onto the consumer and offset costs with tax benefits leads to a historically stable gross profit
margin. COGS are expected to grow in line with sales. Note, the gas segment COGS as a percentage of
segment revenue have been somewhat erratic due to the customarily higher volatility experienced in
natural gas prices. More fluctuation in COGS is expected in the future, as the gas segment grows
proportionately larger versus other segments.
Selling, General & Administrative - Installation of electronic vs. manual meters throughout the WPL
service area, which was performed in 2011, has been a driver behind reducing SG&A due to the reduced
need for labor while concurrently improving employee safety. The Electric Segment’s SG&A fell 3.3%
while the Gas Segment’s SG&A fell 6.5% from 2011 to 2012. IPL’s regulators have not yet approved the
installation of electronic meters and still rely entirely on manual meters. A quick glance at electronic
meter saturation by state (Appendix 14) enforces that electronic meter installation for IPL is not a
question of if, but when. Increased operational efficiency through general scale economies and eventual
transition to electronic meters will help allow LNT to outbid possible competitors in an increasingly non-
regulated and therein competitive utility market. A modest SG&A reduction of 1.0% is part of our
projections by 2016.
Depreciation & Allowance for Funds Used During Construction - The continual and sizable capital
expenditures required by utilities leads to high depreciation expenses and capitalized interest expenses
(AFUDC) on the income statement. LNT’s depreciation, an operating expense, has consistently averaged
around 10% of total revenues over the past five-annual accounting periods while AFUDC, a non-
operating expense, has averaged about 1-2% of total revenues over the same period. Due to flexibility in
accounting conventions, how depreciation and AFUDC are recognized can significantly affect earnings
quality, which is evaluated in greater detail at the conclusion of this section.
Interest Expense - Due to the fixed capital-intensive nature of utilities, interest expense, which is
generated primarily by long-term debt, is the most significant non-operating expense of LNT’s
consolidated income statement. It has averaged about 5% of total revenues over 2009-2014. The current
low interest rate environment allows: 1) existing debt to be called back (Appendix 6) and refinanced at
lower rates thus increasing current profitability; and 2) new projects can be funded with cheap debt thus
lowering LNT’s overall cost of capital without jeopardizing future profitability.
Effective Tax Rate - LNT’s effective tax rate, which has averaged just 20% from 2009 to 2014, is
significantly lower than the 34% median of the electric utility industry (Appendix 12). The most notable
adjustment to LNT’s effective tax rate stems from IPL tax credits. Rate cases are generally the best
means to adjust rates; however, state commissions allow various revenue-adjustment mechanisms, or
riders, to account for incremental investments made without requiring the utility to file a formal rate case.
For IPL, the Tax Benefit Rider provides a mechanism to refund amounts retained in regulatory liability
with potential tax benefits from changes in accounting methods. The ability to utilize tax capital losses
and net operating losses lowers LNT’s overall tax rate. Year to date, LNT has $471 NOLs available for
use with the earliest expiration date coming due in 2018. LNT’s long-term effective tax rate has been
given careful consideration and estimated to be 16.1% during 2015 and 2016, and 26.7% in 2017 and
beyond (Appendix 8) despite a 34% industry median. Details on the complexity of LNT’s effective tax rate
are documented in Appendix 8.
Balance Sheet (Appendix 4); Assumption Summary (Appendix 1)
Working Capital - According to management discloses, there is no significant build up in allowance for
doubtful accounts receivable, nor is any disclosed on the balance sheet. An uncharacteristic decrease in
current liabilities is expected in 2014, but perceived to be temporary, likely correcting itself by the end of
2015. Future working capital investment is perceived to be negligible with increases in current assets and
liabilities set to grow proportionately at historical turnover ratios of 3.25 and 3.00, respectively.
Plant, Property, Equipment - Regulatory oversight and the growth of base assets being required to
earn an authorized return on common equity makes Gross PPE growth regular, transparent, and easy to
forecast. New projects will generally be approved only to meet either new EIA emission standards or to
meet an anticipated need for additional capacity. LNT’s Gross PPE has experienced a 7.3% CAGR from
2012-2014. A nine-year analysis across LNT’s six comparable evaluating sales growth and CAPEX
growth indicates a 3% increase in CAPEX will drive sales over the same period higher by 1% on
average. Management projections, which have been approved by the utility boards, were taken at face
value when forecasting fixed asset turnover ratios that translate into Gross YOY PPE growth of around
8.5%. In short, LNT’s CAPEX budget of $5B over the next five-years will help continue to drive future
returns on capital and taken into consideration when forecasting sales.
The process of retiring plants prior to recognizing full-accumulated depreciation can cause the need for
frequent restatements and impact shareholders equity without hitting net income. LNT has averaged only
0.25% of extraordinary losses from discontinued operations as a percentage of revenue over the past
five-fiscal periods; no add-backs or other adjustments were deemed necessary.
Construction Work-in-Process - Consistent with the rest of the industry, LNT has accelerated its
recognition of AFUDC as a percentage of CWIP from 40-50% in 2010-2012 to 90-100% in 2013-2014. By
expensing these costs sooner, LNT essentially recovers the costs of capital expenditures faster, and
LNT’s earnings are considered to be of higher quality. The current 90% CWIP is assumed for future
periods.
YoY Margins as % of Sales
Source: FactSet, Team Estimates
Interest Coverage Ratio
Source: FactSet, Team Estimates
2014-2018 Capital Expenditures
Source: Company
7. 7
Deferred Assets & Liabilities - Both short-term and long-term tax, other regulatory assets, and liabilities
are omnipresent on LNT’s balance sheet given the regulatory complexity and fixed capital intensity of utility
operations. These line items do not appear to be growing disproportionately on the balance sheet. As
already discussed, some of these items indirectly impact LNT’s income statement through adjustments in
the effective tax rate. The IPL tax benefit riders are expected to run out by the end of 2016 increasing the
effective tax rate from 16.1% in 2015 & 2016 to an estimated 26.7% in future periods. As long as CAPEX
does not slow significantly, other deferred tax assets and liabilities are unlikely to reverse themselves or
materially impact earnings
Pension Benefit Obligation & Other Medical Plans - Actuarial assumptions can have a material impact
on the funded status of LNT’s pension plan. Under US GAAP, the discount rate, rate of compensation
increase, and expected return on plan assets can have material implications for both the periodic cost
reported on the income statement and net obligation reported on the balance sheet. Internal assumptions
between compensation growth and the plan’s discount rate were deemed consistent. LNT’s expected
return on plan asset seemed reasonable when cross referenced with our own asset allocation parameters;
the small difference of 6.5% vs. 7.5% was likely due to timing. Due to the fact that pension assets
ultimately do not belong to either shareholders or creditors, the underfunded obligation was subtracted
when calculating enterprise value.
Debt & Leverage - Historically, LNT has maintained a capital structure of equal parts long-term debt to
equity on a trailing basis. Since reporting Q3 earnings, LNT has increased the amount of debt outstanding
by issuing two new long-term bonds for total proceeds of $500M. LNT’s current ratio of debt to equity still
remains below the industry mean of 1.20. LNT’s S&P debt rating is B+, which is on par with comparable
companies (Appendix 12) and has individual senior corporate bonds which all carry a rating of A-
(Appendix 6). Even with the increased D/E ratio of 1.20 assumed, interest coverage will fall around 2.85
and consistent with historical averages. Management’s decision to increase debt levels should be
approached with caution from the standpoint of risk to an equity investor. However, this change in capital
structure was ultimately determined to be a prudent after a thorough review of industry dynamics and given
the persistence of LNT’s future cash flows.
Cash & Liquidity - Proceeds from the new debt issued and the sale of MN assets (sleighed for regulatory
approval in 2015) should provide ample liquidity to fund budgeted capital expenditures and long-term debt
retirements scheduled for the next two-years even when more bearish assumptions about operating
performance are assumed. Again, no significant buildup of current liabilities has been detected with current
assets growing in proportion to current liabilities. Historically, management has demonstrated excellent
cash flow management by deploying cash only when needed to fund expansion and leaving little to remain
idle on the balance sheet. LNT’s cash as a percentage of total assets being less than 1% would be
considered low as compared to other sectors, but not compared to other utilities which customarily need
little excess cash due to low variability in operating cash flows.
Quality of Accounting & Returns (Appendix 5)
Cash Flows - As opposed to relying on cash flows from financing, stable cash flows from operations allow
management to consistently distribute approximately 60% of earnings to common shareholders through
dividends while retaining 40% to fund future growth opportunities. Net earnings have increased at a rate of
8.1% and dividends at a rate 6.1% based on a 3-Year CAGR. Note that these increases are present even
after more aggressively deducting ADUFC and include the minimal effect of share dilution through the
issuance of stock options, which better align management and shareholder interests.
Return on Capital - A 5-Stage DuPont ROE (Appendix 5) indicates LNT has steadily delivered between a
3.3-3.8% ROA for the past five-years. After accounting for leverage, the actual return on an equity
investment increases to 10.4-12.0%. LNT’s actual ROE is important to watch when paired against its
authorized return on common equity as specified by relevant rate case details (Appendix 9), which are
essentially known and fixed through 2016. If for instance, LNT’s actual ROE was consistently exceeding
authorized return, a rate cut might be imminent and concerning to equity investors. Of equal analytical
importance, is to compare LNT’s authorized vs. geographically similar COMPS to see if the authorized
rates are out of sync with the rest of the region and deduce the likelihood of mean reversion (Appendix 9).
Neither LNT’s actual vs. authorized ROE nor do LNT’s authorized ROE vs. COMPS’ authorized ROE seem
out of alignment, thus sending no clear signals as the decision of the utility boards when base rate cases
are reviewed next post 2016. Iowa & Wisconsin are both ranked in the top quartile of utility boards in terms
of consistently authorizing close to the returns requested by utilities as well as timely review of base asset
adjustments and new asset additions. It is also important to reiterate that gradually rising interest rates will
not necessarily impede utilities from earning a fair return on equity as a utility board will factor in higher
rates at the next review; the real concern is the rate at which interest rates rise between now and 2016 as
returns are fixed until then.
Accruals - Accruals accounting methods can lead to the tendency of manipulating line items to benefit the
current period at the detriment of future reporting periods. To assist in detecting manipulative accounting,
an accruals ratio was calculated for each of the past five-fiscal years (Appendix 5). LNT’s accruals ratio
has been historically controlled ranging from 3.4-10.4% from 2010 to 2013 and was just 2.6%, the lowest it
has been in a five-period, in 2014. In short, no deterioration of accounting quality was detected and it was
determined LNT’s quality of earnings appears to be neither overstated nor unsustainable.
Investment Summary
Macroeconomic Backdrop - As previously mentioned, LNT along with the rest of the Utilities Industry
has a strong negative correlation of -0.60 with the US Government Treasuries due to their high degree of
leverage. Looking back over the past fifteen-years, you would be correct to assume that Utilities have
performed well as interest rates have dwindled from 6% to below 2%. That, however, is only half of the
story. Utilities are defensive and perform well amidst broader market uncertainty. After a five-year bull
market that rallied from the start of the Fed’s QE1, investors are approaching the S&P 500 reaching 2000
with caution amidst uncertainty regarding a slowdown in global growth, energy price volatility, and the
possibility of yet another round of bailouts and government defaults. Meanwhile, the US economy is
Efficient Frontier: Optimal Portfolio
Source: Morningstar Asset Classes
Plan Assets: Expected Returns & Risk
Source: Morningstar Asset Classes
Operating Revenue (in millions)
Source: Company
8. 8
booming by means of comparison to its global peers and the Fed keeps hinting at raising interest rates. It
might seem logical to assume the only way interest rates can go is up; this logic however is misguided.
Despite US economic growth, money velocity, or the rate at which money changes hands continues its
downward trend. Without an inflection point on the horizon for money velocity, inflation is unlikely, and
without signs of inflation, the Fed will have no reason to raise rates. Furthermore, whether the Fed halts
QE for good, it may have little impact on the trajectory of money velocity or treasure yields. The US is not
the only country that has been printing money. The USD, EUR, JPY, & CYH make up roughly 75% of the
global money supply denominated in dollars; all countries mentioned have joined the renaissance of cheap
debt and printing paper. It is no surprise that these currency majors have increased the global money
supply by over 7.0% per year whether looking at a 3, 5, or 10-year CAGR! Global M1 and US 10 Year
Bonds have a correlation of 0.82. Numbers like that certainly are not attractive when compared to a 2-6%
treasury yield. Utilities are perfect for combatting this low interest rate environment by providing a superior
dividend yield, as well as enough capital appreciation to combat the global printing machine.
Investment in Fixed Capital - Alliant has been ramping up CAPEX to take advantage of the low
interest rate environment. While some caution low interest rates could cause utility boards to lower
authorized rates of return, we feel that LNT’s favorable utility board jurisdiction will remain supportive. With
$5B in planned CAPEX (7-8% CAGR) over the next five-years, sales have historically followed at a rate of
1% per 3% CAPEX increase.
Financial Strength & Quality Earnings - LNT’s management has done a stellar job of managing
capital and cash flows, growing assets while simultaneously boosting dividends, and positioning LNT to
switch between fuel sources while achieving security through a diverse mix of residential, commercial, and
industrial users. Though scale economies and SG&A efficiency, LNT enjoys stable and improving margins
that will cushion its transition into what is becoming an increasing deregulated and therein competitive
industry. The accounting is clean and free from perceived manipulations.
Frack Sand Industry - Consensus estimates already recognize LNT as fairly valued investment
opportunity worth holding. While collecting a reasonable dividend, LNT is well suited to long-term investors
willing to wait to see if LNT can unlock value from this blossoming industry. This call option could boost
share prices $10-$20 per share from existing levels if gas contracts with frack miners can be signed.
Valuation
Alliant Energy, as part of the highly regulated defensive utility sector, is in the lowest quintile of systematic
risk if one were to compare the levered betas of the 66 GICs industries. Accordingly, LNT enjoys a low
cost of raising capital. However, just as the equity markets are dynamic, so too are investors’ perception of
risk. To reflect for this fact, the valuation section first considers how systematic risk can be monitored and
quantified over time through aggregating financial data. This methodology arrives at cost of equity of
5.24%, which is then used to discount all future cash flows to equity, which are projected over seven-years
and subdivided into three distinct stages. Two important goals of this three-step process are to reflect a full
business cycle and to alleviate the problem of overweighting a terminal multiple. The model is also
consistent with macroeconomic and financial theory. Finally, the model takes the perspective that the
market is in affect a weighing machine. An investment may appeal to one type of investor, but not another
for the same or even different reasons. In identifying the types of investors most suited purchases shares
of LNT, different terminal multiples are considered. The valuation concludes with a check that no internal
assumptions are violated before performing a sensitivity analysis on the weighted terminal values justified
and cost of capital. Based on our analysis, we have determined that Alliant Energy is a quality company
that is fairly priced by the market when weighing risk and reward; it is deserving of “market weight” in a
balanced portfolio. As a parting consideration, we reiterate the added value that a long-term investor might
unlock given LNT’s unique exposure to the frack sand mining industry of Wisconsin.
Cost of Capital (Appendix 6)
After Tax Cost of Debt
Debt Outstanding - Prevailing market yields and prices of short-term and long-term debt were used to
calculate the cost of debt. If LNT were to issue new debt, an YTM of 3.15% would be assumed.
Ø Modified Duration - Despite the low interest rate environment, LNT’s corporate bonds are stable
when considering small changes in interest rates with a modified duration of 0.40. For example, if
interest rates increase 1.0%, the value of LNT’s bonds decrease by 0.40%.
Ø Call Feature - LNT’s corporate bonds are all callable, meaning that LNT can voluntarily buy the
bonds back from creditors and refinance them if desired. This feature, in addition to perceived low
risk in the electric utility industry, help keep modified duration low.
Ø Tax Shield - LNT’s relatively low effective tax rate increases its cost of debt and WACC.
Cost of Common Equity
Ø Risk-free rate - From the standpoint of a US investor, the US 10-Year Treasury Bond was selected
as the most appropriate representation of a riskless investment.
Ø Equity Risk Premium - Given historical performance of the US equity markets, an equity risk
premium of 5.50% was assumed. Again assuming the standpoint of a US investor, no additional
adjustments to the equity risk premium were required as would have been the case for a foreign
equity.
Ø Unlevered (Cash-Corrected) Industry Beta - To understand how much systematic risk electric
utilities have when compared to the equity market while eliminating possible multi-colinearity in
regards to size, the Russell 1000 (a purely large capitalization US Index) was deconstructed into
10 sectors and 66 industries using GICS taxonomy. Debt was stripped away from comparable
electric companies, taking into account different effective tax rates and any cash on the balance
sheet. As LNT’s gas segment grows to comprise more of LNT’s total operating earnings, expect
more volatility in LNT’s consolidated EBIT margin, thus introducing more risk to LNT’s future
operating performance. To reflect this transition over time, the unlevered (cash-corrected) beta for
gas utilities was also taken into account; a weighted average (based on sales) of the betas
2014 vs. 2015 EPS
Source: Team Estimates
2015 vs. 2016 EPS
Source: Team Estimates
$3.76
$3.76
$3.89
$3.88
9. 9
was utilized. As a frame of reference, gas utilities were found to have an unlevered beta
approximately 0.15 higher than electric utilities over the last three-years.
Ø LNT’s Levered Beta - Taking the unlevered industry beta from the prior step, LNT’s beta was
calculated using LNT’s firm specific 26.7% long-term effective tax rate and 1.20 D/E capital
structure. Finally, this process was repeated until a levered beta for LNT was derived over a 3-
year, 1-year, and 3-month time frame. To reflect for the mean reverting quality of beta, the 3-year
and 1-year beta were each, given a 30% weight. The 3-month beta was assigned a 40% weight to
reflect a higher emphasis on the current market perceptions of risk and LNT’s most current capital
structure. The weighted average is a beta of 0.58.
Ø (International) CAPM - Combining the risk-free rate, equity risk premium, and LNT’s levered beta
produces a cost of common equity of 5.24% prior to a size risk premium adjustment.
Ø Size Premium - Based on available market data, a company with a market capitalization of $5B.0+
has a size factor beta of 1.0. If LNT was smaller, a size risk premium would have been needed
because the factor beta would have been greater than 1.0.
Cost of Preferred Equity - LNT has approximately $200M in preferred stock on which it pays a 5.0%
annual dividend prior to distributing dividends to common shareholders.
Capital Structure - To reiterate, a long-term debt-to-equity ratio of 1.20 was assumed in 2015 and
beyond. While LNT is more levered than it has been in the past, increasing leverage has been a trend in
the utility sector over the past three-years (Appendix 7). While this ratio is used to forecast book values of
debt from equity on the balance sheet, market values are incorporated into the WACC and cost of debt
calculation.
Effective Tax Rate - The low effective tax rate reduces future operating cash flows, is important for
leveraging and unleveraged betas, and impacts the magnitude of the tax shield on debt.
Weighted Average Cost of Capital - The incremental cost of raising new capital while keeping the
proportion of debt, common stock, and preferred stock constant is 4.19%.
Financial Analysis - Discounting Future Cash Flows (Appendix 10)
H-Model - LNT’s intrinsic value of the target price was determined using a three-stage Free Cash Flow to
Equity (FCFE) step function version of the H-Model Model:
Ø Stage 1 (Detailed Forecasting) - Next the IS & BS were forecasted in detail for the next two
full annual reporting periods.
Ø Stage 2 (Mean Reversion) - After 2016, base rate cases will be up for review. To reduce
uncertainty, sales growth was allowed to revert to a long-term sustainable growth rate of 1.5%
in a step-function fashion similar to the linear H-Model. Other line items were forecasted to
grow in proportion with sales during this stage. This relatively low long-term sales growth rate
is intended to reflect the long-term US rate of potential GDP growth consistent with broad EIA
utility capacity growth forecasts through 2040. Furthermore, macroeconomic theory governs
that this relationship holds true for any equity security:
%ΔP = %ΔGDP + %ΔE/GDP + %ΔP/E
…where %ΔE/GDP and %ΔP/E both must revert to a mean of zero over time
Ø Stage 3 (Going Concern) - A terminal value (TV) for LNT was calculated seven years from
the date of valuation to help ensure a full business cycle is reflected in the model. While utilities
are not cyclical, this method is still good practice as it helps diminish the overweighting a TV
can hold in any DCF model. When considering appropriate possible TV multiples, the range
and volatility of historical multiple were assessed for LNT as compared to electric utility
industry multiples. The multiples selected via historical analysis are listed below along with
corresponding logical underpinnings
Ø DIVS/P (25% weight) - When utility dividend yields are high compared to US treasuries, utilities
can offer affluent high income tax bracket investors a reasonable return that is not subject to
severe taxation and this category of investor represents the largest percentage of utility shares
outstanding. Utility boards also use dividend growth rates as a benchmark to set authorized
returns on capital.
Ø P/B (25% weight) - Predictable returns on equity when paired against book value of equity
create a compelling method (R
2
=0.95) to price utilities especially when attempting to value a
utility relative to its peers. LNT’s position on the linear regression line indicates that it trading at
fair value on a short-term relative basis.
Ø P/E (25% weight) - Price to earnings is the quintessential valuation multiple widely used and
accepted by the vast majority of market participants. However, it can be problematic to use
especially in the event of poor reporting quality. Given LNT’s quantifiable quality of reporting,
this terminal multiple was still given consideration.
Ø EV/EBITDA (15% weight) and EV/S (10% weight) - Low interest rates and the economic
benefit of scale economies in an industry that is trending toward becoming more competitive,
has led heightened M&A activity in recent years (Appendix 17). Most notably was Wisconsin
Energy’s acquisition of Integrys Energy, both close geographic comparable companies. A bid
for LNT at a premium is realistically possible. Trailing EV multiples are customarily used when
considering M&A activity with operating efficiency weighed slightly more than sales.
Target Price, Sensitivity Analysis, & Concluding Remarks
Even if every line item of the income statement and balance sheet was predicted perfectly, almost all
models are very sensitive to both the assumed discount rate and the terminal value selected. For that
reason, these two factors have dominated the discussion of LNT’s valuation thus far. The 3-stage model
produces a sensitivity analysis, which tests a range of weighted terminal values against a range of
levered betas. These ranges are intended to cover +/- two standard deviations around the mean (our
best guess). Put differently, the graphical representation below should indicate a range of prices for LNT
LNT Multiples
Source: FactSet
.
Industry Multiples
Source: FactSet
P/B = ROE * (payout) / (Re – g)
Source: Team Estimates
Sensitivity Monte Carlo
Source: Team Estimates
10. 10
with 95% accuracy (assuming a normal distribution). For instance, our base case produces out target price of $73.34 indicating a 10% upside and a
$69.22-$77.44 confidence interval. To conclude our valuation, we stress test the model by altering income statement and balance sheet assumptions
in 2015 & 2016, knowing that the prediction of each of these line items with 100% accuracy is impossible in practice. A full list of assumptions under
LNT’s bear / base / bull scenario is available in Appendix 1. To highlight some key differences, the bear case uses a sales growth rate that is 1.5%
below the base case and electric COGS that is 2% higher; the bull case uses a growth rate 1.5% above the base case and an electric COGS that is
2% lower.
Source: Team Estimates
Each scenario produces 81 trials, and this process is repeated in a Monte Carlo simulation. Aggregating the results we can see the probability of
achieving specific target prices. To summarize the results, the bull case has a target price of $82.17 or a 20% upside and the bear case has a target
price $69.20 or a 1% upside. Our findings concur with the P/B vs. NTM ROE short-term valuation already discussed. LNT, as it stands today, is fairly
priced by the market. However, LNT does offer a competitive dividend higher than current bond yields (Appendix 12). A long-term investor could
comfortable wait to see if a bullish catalyst materializes, risking little on the downside even under bearish assumptions while collecting a steady
dividend. We estimate this call option could be work a premium of $10-20 per share using conservative forecasts in Appendix 27. LNT is highly
deserving of a market weight recommendation.
Risks (Appendix 15 & 16)
Sensitivity to Fluctuations in the Weather - Demand for electricity peaks in summer months due to higher air conditioner needs. Conversely, natural
gas demand is influenced by weather patterns in winter months. LNT’s revenue streams are significantly impacted by fluctuations in average weather
temperatures, which can have a material impact on LNT’s operating performance. Historically, warmer winter and cooler summer temperatures
adversely affect utility companies.
Limited Control of the Wholesale Prices of Natural Gas and Coal - Wholesale prices of energy commodities are generally driven by the demand
and supply dynamics in the general market. Natural gas prices have recently had a tighter correlation to oil prices and with further weakness in oil
prices coupled with continued growth in natural gas prices will put downward pressure on pricing. Utility companies drive coal demand; however,
current EPA requirements are focused on reducing emissions from utility companies which is decreasing demand for coal. Fluctuations in natural gas
and coal prices can have material impacts on operating performance.
Lower Housing and Commercial Property Growth - Adverse economic condition will have a negative effect on growth in residential housing as well
as commercial property growth. Since generating capacity expansion is driven from new home starts, when the economy contracts expansion of
generating capacity will halt which will contract growth in allowed return on equity. Furthermore, commercial property growth follows the same path as
housing starts.
State Energy Efficiency Programs - State energy efficiency programs will drive LNT to further improve operations to meet these requirements. These
requirements will drive capital expenditures in the short-run, and will expand allowed return on equity. Additionally, it will reduce operating expenses
and lower allowed returns in the long run.
More Efficient Appliances and Lighting - Efficiency in appliances and lighting has been a detriment to utility companies’ retail revenue. We believe
this problem will continue to be a headwind for utility companies’ revenue and further diminish demand for generating capacity.
Interest Rate Risk - The interest rate environment today is at a low point versus its history. If interest rates rise dramatically in the short run then it will
raise interest expense for the new debt used to fund current capital expenditures and LNT will not have enough time to ask regulators for a higher
allowed return on equity.
EPA Mercury and Air Toxics Standards - EPA’s final rule set standards for all hazardous air pollutants emitted by coal and oil fired electric
generating units with a capacity of 25 megawatts or greater. Furthermore, all regulated electric generating units are considered major and utilities have
up to four years to comply with MATS. We believe these requirements will take power supply off of the market, which will put upward prices on market
power prices.
Renewable Energy - Renewable energy mandates by federal and state governments have added increased pressure on energy prices. Utility
companies that are required to have a percentage of generating capacity in renewable energy are required to keep back up generation and capacity.
Since utility companies receive tax credits for running renewable energy generators, they run capacity at negative prices that adds upward prices on
coal and gas fired plants. Higher energy prices will lead industrial customer to buy energy on the open market.
Valuations High - The sector is trading at 16% premium to the market verse a historical 10-12% discount. The forwarded P/E of 16 is at the high end
of the historic range. Some premium is warranted given the low interest environment. However, these premiums are not supported by level of growth.
Economic growth and interest rates will normalize at some point posing a serious risk for utility valuations. Utilities typically underperform the market
during periods of rising long-term interest rates.
Cybersecurity - Cyber security is an ongoing concern since it can cause disruptions to the power grid and widespread blackouts. In 2008, the North
American Electric Reliability Corporation (NERC) has developed mandatory security standards on critical infrastructure protection. The Cybersecurity
At of 2013 was introduced to for companies operating critical infrastructures. This federal bill is estimated to cost $56 million, but has not been passed
yet.
Credit Rating Change - A downgrade in the credit rating would result in higher borrowing costs. LNT has ratings triggers, which it may need to provide
credit equal to the amount of the exposure or it may need to unwind the contract and pay the underlying obligation.
30. 30
Appendix 13: Heating Degree Days (Extreme 2014)
Source: Weather Data Depot, Feb. ‘15
Appendix 14: Automatic Meter Service Area Saturation
Source: Edison Foundation, Aug. ‘13
31. 31
Appendix 15: Business & Industry Analysis
Source: Analyst Computations, 01/31/15
1. Threat of New Entrants – Regulated utility companies has a competitive advantage when it comes to barriers to entry. New generation plants have
high fixed costs and new power producers require tremendous capital to enter the market. The time frame for gaining regulatory approval is long and
complicated process.
2. Power of Suppliers – The regulated utility industry is dominated by modest amount of competitors. As a regulation pushes companies into
consolidation, competition amongst each other will diminish.
3. Power of Buyers – New regulation has given power to buyers of power from the open market. Electricity is commodity making it no different to
purchase power from two different utility companies. Furthermore, buyers are searching for the company that has the lowest cost of power.
4. Availability of Substitutes – Power has no substitute and is a necessity for the world. Power demand in the short-term is inelastic thus, increases in
prices has minimal effect on demand. However, long term power demand can be affected by higher prices because it will cause customers to look for
alternative ways to produce energy.
5. Competitive Rivalry – Rivalry among regulated utility companies have increased lately. Utilities have to fight for market share to be able to create
economies of scale to drive down prices.
33. 33
Appendix 17: M&A Activity for Electric Utility Industry
Source: Analyst Computations, 01/31/15
Appendix 18: Utility Index vs. U.S Government 10-Yr Treasury
Source: Bloomberg
1.00
1.50
2.00
2.50
3.00
3.50
4.00
4.50
5.00
5.50
90
100
110
120
130
140
150
160
170
180
190
United
States
/
Electric
U;li;es
-‐IND
-‐
Price
Index
(Right)
US
Govt
Yield
-‐
10
Yr
(LeL)
34. 34
Appendix 19: EPA Regulations
Source: EPA, Company Reports
Environmental Contingencies and Regulations
Alliant Energy is subject to various environmental regulations imposed by all levels of government. Alliant Energy monitors any environmental
regulation that may have a significant impact on future operations. Since some of these regulations have yet to be determined, the firm does not
currently know the impact on financial operations, however, it is clear that changing regulations will specifically have an impact on future capital
investments, specifically by implementing operational modifications and installing controls that reduce emissions. These regulations will be somewhat
offset by increasing levels of energy produced by wind farms. Some of the most impactful regulations are as follows:
Ø Clean Air Interstate Rule/Cross-State Air Pollution Rule: CSAPR replaced CAIR as of January 1, 2015, but has the same goal. The purpose
of these regulations is to make reductions to the amount of sulfur dioxide and nitrogen oxides emissions from power plants. These chemicals
are transported in the form of fine particulate matter and ozone and cause pollution in downwind states. Wisconsin and Iowa are among the
northeastern states that are charged with limiting outputs of both emissions types. CSAPR has annual projected costs of $800 million, along
with the $1.6 billion annual capital investments from CAIR. (www.epa.gov/crosssttaterule)
Ø Clean Air Visibility Rule: CAVR requires states to address visibility impairment, or haze. The implementation of this regulatory action requires
the use of Best Available Retrofit Technology, or BART, for any industrial facility emitting air pollutants. LNT has the ability to substitute
participation in CSAPR for source-specific BART emissions. (EPA Visibility Actions- http://www.epa.gov/visibility/actions.html)
Ø Mercury and Air Toxics Standards: MATS is the first federal standard that requires power plants eliminate 91% of emissions of hazardous air
pollutants like mercury, arsenic, and metals (Wholfe Trahan). Compliance of this rule is required by April of this year, with reasonable requests
for a one year extension. (epa.gov/mats & company presentations)
Ø National Ambient Air Quality Standards- Ozone: This portion of the NAAQS rule requires the reduction of nitrogen oxides in particular non-
attainment areas. Sheboygan County in Wisconsin has been named as one of these areas and LNT must achieve compliance in the Edgewater
and Sheboygan Falls plants.
Ø New Standards of Performance for Greenhouse Gas Emissions: NSPS for GHG is expected to impact electric generating units using new
fossil fuels through the limitation of CO2 emissions. The Marshalltown plant is expected to be impacted by this new regulation, though a date for
finalizing and complying with these standards has not yet been set.
Ø Water Quality Regulations: Section 316(b) of the Federal Clean Water Act modifies cooling water intake rules due to adverse impacts on
water ecology systems. This act insures cooling water intake uses the best technology available to minimize adverse effects for aquatic life. This
could mean significant capital investment each time a new technology is developed.
Ø Hydroelectric Fish Passage System: Wisconsin Power and Light is currently required to install an approved fish passage device at the Prairie
du Sac hydro plant by July 2015. Problems, including impact of nonnative fish and other environmental issues, have caused problems with the
development. This could be particularly cost intensive as hydroelectric energy becomes more common place.
To comply with changing environmental regulation, Alliant Energy has established an integrated three tier planning process. The first tier involves
installing fully controlled emissions units and improving efficiency to reduce carbon intensity. Capital expenditures of $515 million are in process with
received approval for tier 1. During the second tier, LNT plans to explore low cost control options, respond to the changing compliance rules, and select
a compliance strategy, with capital expenditures 2014 through 2018 of approximately $30 million for emissions controls. The third tier involves exiting
existing units when various factors dictate. One candidate for not installing emissions controls and exiting is 943 MW ($164 million book value). Alliant
Energy currently has the following construction and implementation projects planned:
Project
Approved
Budget
Current
Estimate
Percent
Complete
Edgewater 5 SCR $154 $135 100%
Columbia Scrubber/Baghouse $627 $595 100%
Ottumwa Scrubber/Baghouse $345 $337 96%
Ottumwa Efficiency Upgrades $154 $154 76%
Lansing Scrubber $58 $58 40%
Columbia Efficiency Upgrades $158 $141 27%
Edgewater 5 Scrubber/Baghouse $414 $300 20%
Marshalltown Gas Plant and
Pipeline $700 $700 9%
Total: $2,610 $2,420
-‐
50,000
100,000
150,000
200,000
250,000
300,000
350,000
2010
2011
2012
2013
2014
Est.
2015
GDP
in
LNT
Opera/ng
Region
Iowa
Wisconsin
35. 35
Appendix 20: Oil Projections
Source: EIA
0
10
20
30
Henry
Hub
Brent
History Projections
2040
=
3.2
2018
=
3.4
2012
=
7.1
Oil-‐to-‐gas
Price
Ra/o
2012
Source: Comparison of spot prices for Brent crude oil and Henry Hub natural gas, 1990-
2040: History: U.S. Energy Information Administration, Monthly Energy Review September
2013, DOE/EIA-0035 (2013/09) (Washington, DC, September 2013).
Projections: AEO2014 National Energy Modeling System, run REF2014.D102413A.
0
2
4
6
8
10
12
Lower 48 onshore
Lower 48 offshore
Alaska
Total
History Projections2012
36. 36
Appendix 21: RPS Reporting
Source: EIA
State RPS BY
Arizona 15% 2025
California 33% 2020
Colorado 20% 2020
Connecticut 23% 2020
Delaware 20% 2019
District of Columbia 20% 2020
Hawaii 40% 2030
Illinois 25% 2025
Iowa 105mw N/A
Kansas 20% 2020
Maine 10% 2017
Maryland 20% 2022
Massachusetts 15% 2020
Michigan 10% 2015
Minnesota 25% 2025
Missouri 15% 2021
Montana 1% 2015
Nevada 2% 2025
New Ha 24% 2025
New Jersey 23% 2021
New Mexico 20% 2020
New York 29% 2015
North Carolina 13% 2021
Ohio 25% 2025
Oregon 25% 2025
Pennsylvania 18% 2021
Rhode Island 16% 2020
Texas 5800mw 2015
Washington 15% 2020
Wisconsin 10% 2015
Appendix 22: Electrical Generation
Source: EIA
-‐
200,000
400,000
600,000
800,000
1,000,000
1,200,000
-‐
100,000
200,000
300,000
400,000
500,000
600,000
US Electrical Generation by Fuel Source
Coal
(LeL)
Petroleum
(LeL)
Natural
Gas
(LeL)
Nuclear
(LeL)
Hydroelectric
(LeL)
Renewables
(LeL)
All
Fuels
(Right)
37. 37
0
10
20
30
40
50
60
70
80
90
$0.00
$1.00
$2.00
$3.00
$4.00
$5.00
$6.00
$7.00
$8.00
$9.00
$10.00
2000
2001
2002
2003
2004
2005
2006
2007
2008
2009
2010
2011
2012
2013
2014
2015
2016
Natural
Gas
Prices
and
Produc/on
Growth
Natural
Gas
Henry
Hub
Spot
Price
($/mcf)
(LeL)
Natural
Gas
Total
Marketed
Produc;on
(Right)
Appendix 23: Corporate Structure & Management
Source: Bloomberg, Company Reports
Alliant Energy Organizational Structure
Electric and gas services in
M (NIPL) (a)
Corporate Services
Electric and gas services in
IA (ILP)
Electric and gas services in
WI (WLP)
16% interest in ATC (WLP)
Non-regulated Generation
(Resources)
Transportation (Resources)
Parent Company
Utility and Corporate
Services
Alliant Energy Corporation
Non-regulated and
Parent
38. 38
Appendix 24: Authorized ROE
Source: Company Reports
Alliant Energy Senior Management
Name
Title and Tenure Prior Experience
Patricia Leonard Kampling Chairman, President, Chief Executive
Officer & COO; 2005 Ms. Patricia L Kampling is also Chairman & Chief
Executive Officer at Interstate Power & Light Co. and
Wisconsin Power & Light Co., and Independent
Director at Briggs & Stratton. She was previously
employed as Treasurer by IPSCO, Inc., CFO & Senior
VP by Exelon Enterprises, Treasurer by
Commonwealth Edison Co., Unicom Corp., and
Exelon Corp., Rate Division Engineer by Philadelphia
Electric Co., and President & Director by Look to the
Future Foundation.
Thomas L. Hanson Chief Financial Officer & Senior Vice
President; 1980
Mr. Thomas L. Hanson is also CFO & Senior Vice
President at Wisconsin Power & Light Co. and at
Interstate Power & Light Co. He is on the Board of
Directors at Community Development Authority,
Riverland Conservancy, Oakwood Homes, and Henry
Vilas Zoo.
John O. Larson Senior Vice President- Wisconsin Power
and Light; 1997
Mr. John O. Larson is also Senior Vice President-
Generation at Interstate Power & Light Co. and Alliant
Energy Corp and Member-Energy Supply Committee
at Edison Electric institute. He is on the Board of
Directors at Alliant Energy Foundation, Junior
Achievement of Wisconsin, Inc., and Greater Madison
Chamber of Commerce.
James H. Gallegos Senior Vice President & General
Counsel; 2010
Mr. Douglas R. Kopp is Senior Vice President at
Wisconsin Power & Light Co. and Interstate Power &
Light Co. He is on the Board of Directors at United
Way of East Central Iowa. Mr. Kopp was previously
the senior Vice President by Alliant Energy Corp.
Douglas R. Kopp Senior Vice President- Interstate Power
and Light; 1992
Mr. James H. Gallegos is also Senior Vice President
and General Counsel at Wisconsin Power & Light Co.
and Interstate Power & Light Co. He was previously
employed as Vice President & General Counsel by
BNSF Railway Co. and Burlington Northern Railroad
Co, Market Analyst by Burlington Northern Santa Fe
Corp. and Soo Line Railroad Co., and Trial Attorney by
US Department of Justice.
WI IA MN IL MI
Alliant
Energy
Corp 10.40% 11.50% 1035% -‐-‐ -‐-‐
Xcel
Energy
Inc 10.20% -‐-‐ 10.50% -‐-‐ -‐-‐
DTE
Energy -‐-‐ -‐-‐ -‐-‐ 11.00%
Wisconsin
Energy
Corp 10.40% -‐-‐ -‐-‐ -‐-‐ -‐-‐
Integrys
Energy
Group 10.20% -‐-‐ 9.70% 10.25% 10.25%
Allete,
Inc -‐-‐ 10.38% -‐-‐ -‐-‐
Madison
Gas
&
Electric 10.30% -‐-‐ -‐-‐ -‐-‐ -‐-‐
Authorized
Return
on
Equity
39. 39
Appendix 25: Capital Expenditures
Source: Company Report
9%
10%
11%
12%
13%
Average Awarded ROE Average Requested ROE
Marshalltown
Generating Station
11% ROE
0
200
400
600
800
1000
1200
2014 2015 2016 2017 2018
2014 - 2018 Capital Expenditures
Marshalltown Riverside Energy Complex Maint. & Performance
Improvements
Environmental Compliance
Distribution Systems Electric Systems Gas Systems Other
44. 44
Legal Disclaimer:
This report has been prepared for education purposes only.
This report has not been prepared by a registered investment adviser / investment advisor representative nor a registered broker-dealer / agent of a
broker dealer as defined by the U.S. Securities Exchange Commission.
This report should not be considered personalized investment advice and is not tailored to the investment needs of any specific person or legal
entity. It is encouraged that you seek personal advice from your professional investment, tax, or legal advisor(s) to determine the suitability of any
potential investment/security mentioned within based on your particular risk profile.
The information published within this report:
Ø is based on independent research and no compensation from companies mentioned within or from any undisclosed third party entities
was received;
Ø is based on opinion in addition to statistical and financial data which is believed to be accurate, but no responsibility is claimed for errors
or omissions, including those that result from the transfer of electronic information;
Ø uses words including but not limited to, "anticipates," "expects," "believes," "estimates," "seeks," "plans," "intends," "will," and similar
expressions which are forward-looking statements designed to fall within the securities law safe harbor definition of forward-looking
statements;
Ø does not constitute a recommendation to buy, sell, or hold that or any security, portfolio of securities, or transaction;
Ø does not promise, guarantee, or imply a particular investment decision will result in a profit or loss;
Ø Does not promise, guarantee, or imply facts discussing or figures presenting historical returns/performance are indicative of future
returns/performance results.
Employees, owners, independent contractors, and/or writers may own positions in the equities, options, and/or securities mentioned within.
However, no associated parties will intentionally engage in any transaction that directly or indirectly competes with the interests of our readers. By
taking action based on information provided in this report, you agree to indemnify, defend and hold us and our partners, agents, officers, directors,
employees, subcontractors, successors, assigns, third party suppliers of information and documents, attorneys, advertisers, product and service
providers, and affiliates harmless from any liability, loss, claim and expense, including reasonable attorney's fees.
Effective January, 2015