SlideShare une entreprise Scribd logo
1  sur  16
Télécharger pour lire hors ligne
Winter is coming?
“Go as far as you can see; when you get there, you’ll be able to see farther” – John Pierpont Morgan
From the feedback I received from my first article in the Mauritian press, my astonishment was
beyond measure by the colourful response I got. I believe it’s with contentious constructive
arguments which get someone closer to the truth. The subject was indeed vast but I modestly tried
to give an overview of what could be done in order to jumpstart the financial sector in Mauritius. I
have worked all my life abroad and I confess that, on developed financial markets, you are bound to
become cynical about the environment around you. I have developed a set of skills thanks to the
opportunities/failures I experienced. Economics has always been a mystery for me, as a student in
high school and during my university days, it just became something you should understand but in
no case should be portrayed as a superior truth. With years, I have been even more sceptical about
it especially when I start working on mathematical models in finance, economics and even human
behaviour. Very quickly, economic models assumptions became so far-fetched. For example, a
neoclassical model is heavily being used by Central Banks called the DSGE which stands for Dynamic
Stochastic General Equilibrium to predict the dynamics of the economy. This model tries to
overcome the Lucas Critique (past relationships will not hold in the future) but still avoid block like
money and financial institutions as agent in its hypothesis. Knowing how economies are financialized
and how Central Banks have taken such important leading roles, these models proved to be not very
useful in ”forecasting” the global financial crisis in 2008. However, combining some concepts of
economics with history, we can extract some useful insights about the dynamics of an economic
structure. So, I decided following the comments I got from my first article to analyse the economic
environment of Mauritius these past years under the magnifying glass of a quant hedge fund
manager. There will be no prediction because I don’t possess a crystal ball. But there will be an
effort to explain, in my point of view, how things have evolved since the past years and why we
arrived at the situation we are experiencing today. There are many solutions or explanations which
can be brought but instead of being precisely wrong I will try to be approximately right.
2015 was …
The GDP growth was around 3.9% (MCCI figures) with an unemployment rate neighbouring 8 %. The
country has also an inflation of 1.7%, a budget deficit of 3.8%, current account deficit north of 5%
and a debt equal to 55.5% of the output. The national debt is the sum of all past deficits plus all extra
government spending which need external funding. So, I will not indulge in fantasy but in economic
reality. Mauritius has always adopted Keynesian economics when it comes to economic policies i.e
significant government spending, state intervention anywhere and everywhere. The very basic
economic analysis shows that an economy will not be subject to economic cycles, only if its
consumption matches exactly its production. This is rarely possible, so to remedy to this issue,
borrowing and lending of capital help to consume or produce more. In return this economy will be
impacted by booms and bursts. Credit, hence, debt becomes an important element to judge a
country’s room to manoeuvre. The Mauritian debt dynamics¹ is still under control meaning that with
the primary deficit (difference between government revenues and spending before interest
payments), nominal growth and the one year yield on T Bills, our debt is manageable as the nominal
growth is still over the 10 year bond yield. Nevertheless, it is dangerously approaching the 65%
level, a high earmark for a small country. The duration of the debt is around 5 years, which shows
that we are exposed to short term refinancing risk, in terms of maturity and interest rates. With the
twin deficits, current account and budget, the state of Mauritius ability to undertake the structural
reforms is therefore becoming limited. A current account deficit means that the country is
consuming more than it’s producing, meaning we are selling rupees to buy foreign currencies. A
budget deficit is only the difference between the government receipts (taxes) and its spending
(welfare state, regalian functions, black swan events). Both deficits, combined contribute to the
accumulation of debt. So long, debt is being used to invest in productive activities, it will naturally
increase the GDP. With the multiplier effect, the debt/gdp ratio will naturally deflate. However, if
the state uses debt unwisely to increase its size, finance loss making para-statal bodies, providing
safety net and increasing moral hazard, the situation can become out of control as agents financing
this debt will demand higher returns to compensate for risks and inflation. Fortunately, our deficits
are mainly financed by domestic players.
Inflation in Mauritius
Inflation is a hidden tax. It is a steady increase in prices accompanied by a fall in the value of money.
Put it simply, does 10 rupees last year at this time can buy the same amount of goods today. If not,
there is either inflation or deflation ceteris paribus. The following diagrams depict the 2 sources of
inflation in Mauritius.
As we can see, the Mauritian inflation rate is very closely correlated to world oil prices and food
prices. These two commodities are imported which means that the country is very elastic to the
shocks occurring on these prices. However, theoretically there are two caveats to counterbalance
the effects of these fluctuations; a steady appreciating exchange rate, meaning a strong currency
and an increasing net productivity. The European Union is our main trading partner. Let’s check the
exchange rate EUR/MUR
0
2
4
6
8
10
12
0
50
100
150
200
250
12/1/2006
11/1/2007
10/1/2008
9/1/2009
8/1/2010
7/1/2011
6/1/2012
5/1/2013
4/1/2014
3/1/2015
0
2
4
6
8
10
12
0
20
40
60
80
100
120
140
160
12/18/2006
12/18/2007
12/18/2008
12/18/2009
12/18/2010
12/18/2011
12/18/2012
12/18/2013
12/18/2014
12/18/2015
Red Line – Food Price Index (WFO) LHS
Blue Line – Inflation Rate (%) RHS
Red Line –Brent Oil Price (USD) LHS
Blue Line – Inflation Rate (%) RHS
Stats Mauritius
To have an appreciating currency, you need to accumulate surpluses which signify you are capturing
trade market share (Nash non cooperative strategy) from other countries or there are high domestic
interest rates. The exogenous* factor can be that your trading partners are debasing their
currencies. In the above diagram, there is an appreciation of the MUR (risks on the EuroZone and
bond purchasing program initiated there) which should taper imported inflation. However, there is
an average annual productivity gain of 2.6% accompanied by an average annual increase in wages of
3.82%. Therefore, we can realistically purport that there is around 1.22% which is added annually to
the wage push inflation since 2006. Other factors contributing to inflation will add up to this
number, positively or negatively.
Conjunction of factors
The concept of prices is very important in an economy. Prices are not just a statement of value but a
system of information. On every market, prices encapsulate the forces of demand and supply but
also the chain of information which contains in its value. Any authority who tries to distort the price
discovery mechanism will not only disrupt investment/saving behaviour but can create
misallocation, capital and labour, in an economy.
In a nutshell, the economic growth rests on two building blocks: population and productivity.
Population determines how many workers a country will have and productivity is the output per
worker. For example, if a labour force grows by 1 % and the productivity by 1.5%, the potential
growth is 2.5%. Productivity depends on capital and ideas. You can raise productivity by equipping
workers with more capital, which means investing in land, buildings, equipment or specific training.
A rupee invested for tomorrow is a rupee not available to spend on the pleasures of life today. Thus,
investment requires saving. The more a society saves, whether its firms or households, the more
capital it accumulates. However, every rupee invested provides a smaller boost to production. This is
called the law of diminishing returns. So how we overcome the law of diminishing returns? Well,
with ideas. For example, by combining capital and labour in different ways could give newer
products at better costs. At first, there was Microsoft Internet Explorer which was attacked by
Firefox and now by Google Chrome. Entire countries can boost their development by copying the
ideas and technologies of other countries. The factors determining economic growth are thus:
35
40
45
50
12/18/2006
12/18/2007
12/18/2008
12/18/2009
12/18/2010
12/18/2011
12/18/2012
12/18/2013
12/18/2014
12/18/2015
EUR/MUR
 Human Capital
 Rule of Law not Rule of Lawyers
 Letting markets work
The following table summarises statistically, through an index, the two main determinants of future
growth.
Source: Dalio,Elliott
This study was based on 22 countries and the conclusions are crystal clear, competitiveness and
indebtedness are the main drivers of output. All the parameters are explicit and give a clear picture
of what the country needs to enhance to increase the growth potential.
Every economy is the sum of the transactions that make it up. A transaction consist of the buyer
giving money or credit to a seller and the seller giving a good, a service, a financial asset to the buyer
in exchange. A market consists of all the buyers and the sellers making exchanges for the same
things. For any market, if you would know the total amount of money/credit spent and the total
quantity sold, you would know everything you need to know. For example, the price of any good is
equal to the amount spent by buyers (total MUR value) divided by the total quantity sold by sellers
(total Q). The Total MUR spent is composed of money plus credit. If you go to a store to buy
something, you can pay either cash or by credit card. If you pay with a credit card, you have created
a credit, which is a promise to deliver money at a later date. All changes in the economic activity and
all changes in financial market prices are due to variations in the amounts of money and credit that
are spent on goods/services but also on the amounts which are sold. Any alterations in the total
MUR have a much bigger impact on the economic activity and prices than do changes in the total
units sold. This is because it’s easier to change the supply of money and credit. The clustering of
buyers can either be the private sector or the government. Inside the private sector, there is the
household category and the firm’s category. With such settings, the economy will have a long term
trend which will be based on the growth of productivity but also a short term cycle which is the
business cycle. It is mainly when the rate of growth in spending grows faster than the rate of growth
in the capacity to produce. This will lead to an increase in price. This is only curtailed by tight money
and credit done by Central Banks through interest rates. When this happens, there is a recession and
consequently the same Central Bank will lower interest rates to reduce debt service and to stimulate
new demand. This creates a wealth effect, causes stock prices to rise and encourages consumption,
theoretically speaking.
Money being at the heart of the system
Money is the system through which information about the current and future values of
goods/services. However, prices as a consequence of money contain two sub prices. The first price is
the exchange rate, which will allow a country to specialise in its comparative advantage. The second
price is the interest rate which will choose between investment/consumption and saving decisions.
Any effort to try to manipulate these two prices will potentially lead to economic disasters. For
example, having a single currency zone like Europe where nations with different competitiveness
sharing the same exchange and interest rates won’t work without internal transfers among these
countries. Thus, any attempt to manipulate these two sub prices will give fake prices in the
economy. Any rational entrepreneur will not take any investment decisions if he can’t assess the
“purity” of prices. The average entrepreneur borrows for two main reasons: Capital spending, which
takes place when business is expanding that is resources are needed to build new plants or hire
people. The second reason is financial engineering which is the ability to purchase existing cash
flows or any stream of income. Unfortunately, the second reason does not lead to an increase in the
stock of capital; it just leads in a change of ownership of capital. Very often this is done with debt.
And eventually leads to a concentration of asset ownership. Share buybacks and mergers &
acquisitions operations can be described as financial engineering here.
Referring to economic theory, Knut Wicksell, a Swedish economist, explained that there two rates in
an economy which should be monitored. A market rate which is the short rates determined by
supply/demand of credit and the natural rate is the simply the economy’s structural growth rate. So
any significant difference between these two prices will cause disruption in the economy. I will
compute these figures later to show when interest rates are not in line with the fundamentals of the
economy lead to misallocation of resources.
Velocity of Money
Velocity of money is a difficult concept to understand or to calculate. It can be defined as the
number of times one unit of currency is spent to buy and services per unit of time. Fisher gave a
formula to calculate the velocity but I will calculate it using this formula GDP/M2, which is an ex post
measurement. M2, for the uninitiated, is a measure of money which includes notes/coins in
circulation plus short term deposits in banks. To show how velocity and interest rates are correlated,
lets show the following the graph. Note there is a scarcity in Mauritian data, the period analysed will
be small, from 2006 to 2013.
Treasury Bills are short term bonds issued by the Central Bank. As shown above, there is a close
relationship between the change in the velocity of money and the change in the Treasury bill yield.
Due to a lack of deeper past and recent data, it will be interesting to see how this relationship held in
the past and right now. It is known that that any disruption of this relationship can have serious
consequences on the economy in terms of allocation of resources but also on the central bank
monetary policy. In Mauritius, there is a falling velocity of money in absolute terms mainly because
the money supply (M2) is rising faster each year.
Assessing the allocation of resources
The allocation of resources in any economy is very important. It is mainly driven by the credit which
is poured in the system and targeted towards projects which will return the best yield. So, any
interest rate which is set by the Central Banks, which will be diffused in every rates at all maturities
will bear two things, an inflation component and a real price component which is usually aimed at
incentivizing savers. However, these two components can move in opposite directions. So, the
Central Bank needs to fight inflationary pressures on one hand and on the other have a real interest
rate which will enable savers to save along with encouraging entrepreneurs to invest. So by
definition, there should be an environment where interest rates should be maintained as close as
possible to the economy’s structural growth rate. In other words, any investment which should be
done, by the public or private sector, should aim at pushing the structural growth rate further.
However, there is a caveat when interest rates are far too low compared to the fundamentals of the
economy. In this situation, investment and allocation of resources are directed towards existing
projects i.e real estate, sectors with low returns or in the worst case Ponzi-like structures which we
are well acquainted to in Mauritius. When this happens, there is an incentive to borrow massively,
this will cause a rise in prices of these assets and whenever this bubble pops out, an enormous
amount of capital is destroyed which will impact negatively exposed banks and as a consequence
significantly decrease the potential economic growth. The Wicksellian Spread* measures the
difference between the nominal GDP growth YoY%(year on year) and the 5 Year Treasury Notes.
Here it is:
-0.2
-0.15
-0.1
-0.05
0
-1
-0.5
0
0.5
1
2007 2008 2009 2010 2011 2012 2013
Change in Tbills Rate LHS
Change in Velocity RHS
There in an incentive to borrow massively from 2007 to 2008. It then became less interesting to
borrow, but from 2010 to 2014; there is again an incentive to borrow for public and private sector.
The question to be asked is where this money has been invested. As explained before, when the
Wicksellian Spread is positive, there is a global tendency to crowd out new investment which could
provide higher rate of returns with existing projects with lower yields. Let’s take for example, the
housing and construction sector. Note there is no land price index in Mauritius.
Red Circle – Period 2007 to 2008
Red Circle – Period 2011 to End 2012
0.00%
2.00%
4.00%
6.00%
8.00%
10.00%
12.00%
14.00%
16.00%
18.00%
2006 2007 2008 2009 2010 2011 2012 2013 2014 2015 2016
-10.00%
-5.00%
0.00%
5.00%
10.00%
2007 2008 2009 2010 2011 2012 2013 2014 2015
125.0
130.0
135.0
140.0
145.0
150.0
155.0
160.0
165.0
170.0
175.0
3/1/2007
6/1/2007
9/1/2007
12/1/2007
3/1/2008
6/1/2008
9/1/2008
12/1/2008
Contruction Price
Index 2007-2008
100.0
102.0
104.0
106.0
108.0
110.0
112.0
114.0
116.0
CPI HOUSING Base 100
Red Line – YoY % in Yield 5Y Bond
Blue Line – YoY% in nominal GDP growth
Blue Surface – Difference between red and
blue.
The above diagrams show that on period where the Wicksellian Spread was positive, there was a
significant enticement to borrow, and this went massively to the tourism/real estate/construction
sector.
In terms of balance sheet situation of corporates (main sectors) and households, the share of credit
to these sectors increased significantly
2005 – 2011 2012-2014
100.0
105.0
110.0
115.0
2011
2011
2012
2012
2012
2012
2013
2013
2013
2013
2014
2014
2014
2014
Contruction Price Index 2011 - 2014
90
95
100
105
110
115
120
2005
2006
2007
2008
2009
2010
2011
2012
2013
2014
No of
Hotels
The above statistics are pretty revealing. Most of the allocation of resources was directed towards
the real estate (land) and tourism sector. By extension, the latter is interdependent with the real
estate sector because of the capacity building which is necessary to accommodate incoming tourists.
The tourism sector has also spill-over effects on the domestic real estate market as it generates
rising asset prices which in turn requires more debt for newcomers who want to invest in land or
housing. This is shown in the leverage ratios of the tourism/real sector and the debt levels of
households. The equity multiplier for Construction/RealEstate is around 153% meaning that more
than half of the assets are being financed by debt. For Tourism sector, it’s around 237% which means
that a bit more than 40% of the assets are financed by leverage. The financial services sector is also
significantly indebted. To know the required rate of return for a business, a metric called Weighted
Average Cost of Capital(WACC) is calculated, for construction its around 7.6% compared to a return
on assets around 4% for the period 2005 to 2013. This means as a whole the sector is destroying
value. For the tourism sector, the WACC is around 6.5% compared to a return of assets of 2.5% on
the same period which is a result of a significant misallocation of resources.
On the household side, more than 60% of the disposable income is debt with housing credit and a
consumer credit portion. The consumer credit also comprises auto loans/leases which is one of the
worst debts possible. Leasing which is a common way of financing the purchase of a car (or home
appliances) is an investment which is totally a liability. Say, you are leasing a car which cost, for
simplicity, MUR 100000, and the lease contract requires you to pay around Rs2000 per month for
three years. After the depreciation curve effect, the buyer has paid Rs72000 after three years, but
still don’t have the right to sell the car as he is not the owner, but if ever he has the right to dispose
of his car at market price which is around Rs55000, then the buyer would have paid Rs127000 for a
car which was only worth Rs100000. For this reason, leasing is one of worse form of debt especially
when it concerns cars/home appliances. Regardless of the nature of the debt, there is no capital
creation with this kind of leverage. It’s sunk cost at best. Interestingly enough, banks or shadow
banking players (for car/home appliances lease mainly) finance these kind of credit.
Fortunately for the tourism sector, it is believed that it will encapsulate significant momentum as
Mauritius still enjoys a good reputation internationally. With better connectivity, it is believed that
the sector will be generating enough cash flows in the future. But the market positioning, air access
and the ability to attract dollar value tourists will be main challenges in the coming years.
Concerning the real estate sector as a whole, the reality check will come when the Central Bank will
be raising its interest rates or when the return will be so low(compared to servicing rate of debt)
that a debt deflation mechanism will start to operate. For this reason, “smart” cities development
must be conducted with extreme care.
Labour misallocation
We talked about capital misallocation but there is an important aspect called labour misallocation
which should not be ignored. It refers to an influx of labour in specific sectors where the marginal
gain is small. The following table shows the workforce distribution among different core sectors.
000’s
Let’s calculate a compounded annual growth rate of the workforce for each sector, the offshore
industry had an annual growth rate of around 14%, the construction industry around 0.8%, the
public sector around 1.8% and the tourism sector around 3.38%.
The following table shows some important metrics concerning sectors like Construction, Tourism
and financial services.
Bank of Mauritius
From the above metrics, all of these 3 sectors are heavily indebted and have a return on equity
around 10 %. But the ROE is known to be misleading especially when there is a high debt because of
the risks which are being taken. Equity tranche in balance sheet seem to be thin given the ratios
calculated in upper section. With this kind of leverage, the return on equity can be magnified
artificially. The strategy which seems to be the case here was to borrow heavily in order to increase
the return on equity. Unfortunately, this is merely financial engineering. On top of that, offshore and
tourism were employing more and more people. Now that the environment has become challenging
in the offshore centre, we can realistically say that excess capacity being built in the past years will
be shrinking in the coming years (conclusion based on the possible incomplete data of that analysis
as offshore centre is just a part of financial services).
As far the public sector is concerned, there is a steady rise of 1.8% each year. Given the debt/gdp
ratio of nearly 60%, increasing constantly public sector capacity which is unproductive will prove to
be damaging for the economy at large.
Monetary Policy and Financial Markets
The objective of the Central Bank is to provide the necessary amount of money to the economy and
making sure that price levels are stable. Some central banks have a double mandate that is inflation
targeting and setting the right economic environment for economic growth. The role of both
monetary policy (interest rates and money supply) and fiscal policy (government spending and
taxation) is to speed up the return to the underlying path of steady growth. In Mauritius, the repo
rate is considered as the source rate on which all other rates will rely on. This rate is very important
as it helps to anticipate future inflation and also allow arbitrating between consumption/investment.
The core structure of the transmission mechanism is as follows:
It exists a number of transmission channels of the monetary namely the interest rates, asset prices
and balance sheets. Equities and real estate are considered to be the last cavity in which money
flows. It’s very important to have a good transmission of monetary policy to the real economy
because it enables price discovery and also gives credibility/independence to the central bank. In
Mauritius, this connection is not fluid because the structure of the money market (maturity less than
a year) and bond market at large is not very efficient. Therefore, this creates an illiquid yield curve.
Equities + Real Estate
High Yield Bonds , Bank
Loans
>5 Year Notes, 10 Y
Bonds, 15 Year Bonds
2 Year Notes to 5
Years Bonds
3 Month Bills to
2 Years Notes
Repo
There is also an excess liquidity in the system which makes the transmission of monetary policy to
the real economy more challenging. A sterilisation process is necessary to remove that excess
liquidity from system but it comes with a cost. The funds raised by the issuance of government
securities to extract the excess cash in the system is usually invested in foreign currencies which
often will return much lower yields than the ones issued on local market. Consequently, losses are
realised by the Central Bank. Hopefully, the Bank of Mauritius will not make use of seigniorage* to
cover losses.
In terms of easing the transmission mechanism, different players should be encouraged to
participate in the repo, securities lending and bond market. Short selling should be introduced in
order to hedge trading books for market making desks. Central Banks should be on the forefront to
provide primary dealers with privileged information in order for them to undertake market making.
Instead of analysing directly the SEMDEX, I will divide the SEMDEX by the SP500, which is the US
index for the 500 biggest companies in America. This ratio will show us how if the SEMDEX is
overvalued/undervalued with regards to his US index. On the same graph, I have plotted the repo
rate.
During the circled periods (Wicksellian Positive Spread), there is an influx of capital in the stock
market. During the period 2007 to mid-2008, the local Stock Market outperformed the SP500 by
nearly 90%. But as from 2011, SEMDEX was sub performing compared to the SP500. On absolute
terms (second diagram), every circle where there is a Positive Wicksellian Spread we have an influx
3.00%
4.00%
5.00%
6.00%
7.00%
8.00%
9.00%
10.00%
0.60
0.80
1.00
1.20
1.40
1.60
1.80
2.00
SEMDEX/SP500
Repo Rate
3.00%
4.00%
5.00%
6.00%
7.00%
8.00%
9.00%
10.00%
-
500.00
1,000.00
1,500.00
2,000.00
2,500.00
SEMDEX
Repo Rate
of capital in the stock market. This happened with no significant repo rate cuts. We can therefore
purport that on average stock market enjoyed an inflow of funds at various times, all of them
corresponding to the moment where market rate of interest was low compared to the natural rate
of interest. This again confirms that allocation of resources was mainly directed to existing assets.
Conclusion
Price formation is decisive in an economy. Interest rate, being at the centre of the game, is of utmost
importance when it comes to quality of growth we want to obtain. For any Central bank to achieve
credibility and independence there is a need to have an efficient market structure for interest
bearing securities, which is very important in the fight against inflation and misallocation of
resources. Mauritius will not be able to get in the high income country category with non-productive
investments and lack of capital. By doing so and with an ageing population, we would potentially
create a lost generation with low salaries and as a result will cause a mismatch in the retirement
funds financing. My analysis foregoes a lot of other technicalities, at some point, it might even be
slightly inaccurate but the global picture is that during many years the investment opportunities
have been targeted towards projects/sectors with poor long term returns. This is a direct
consequence of the difficulty to discriminate between good and bad projects.
Obviously, there are sections in the real estate or other sectors, where the returns are fairly good,
but on average, these activities will not prove to be generating long run returns, either for structural
reasons or regulatory ones. Their benefits for most of them don’t trickle down. Any investment
which is undertaken, by government or the private sector, should push the structural growth
further. We should also make sure that each investment which is realized is increasing the stock of
capital. For this reason, the Central Bank must encourage people to save with much higher real
interest rates. Unfortunately, with the level of indebtedness of the industrial tissue it is highly
unlikely that this will happen. Also, the Mauritian production of goods and services is very price
sensitive, and surprisingly enough, there are often attempts either by government or lobby groups
to influence the MPC. Currency war is not an option; we are too small and already too expensive in
our lifestyle compared to our productivity.
Achieving structural economic growth will not be easy. There is a global environment which is
becoming very challenging because of technology, artificial manipulation of prices and interest rates,
enormous amount of liquidity in the global financial system and deflationary pressures in major
countries. All these factors will create volatility especially for emerging markets. For Mauritius, to
overcome this situation, a long-term investment plan should be enacted. This should gravitate
around technology, education, technical training, global infrastructures and personal responsibility.
To meet these objectives, the following costs should be either lowered or be made much productive.
 Cost of Labour
 Cost of Land
 Cost of Government
 Cost of Energy
 Cost of Capital
If these elements are made more productive/efficient, it will drive automatically investment. But
again any investment should front run major global changes which are happening in the world. We
should not as a country fall behind the curve of innovation. Investment and ideas should be
nurtured. An honest government and trustworthy laws will encourage investors to take risks. The
system should also ensure that dying and unproductive industries are winnowed so that growing
industries can attract capital and human capital.
Davin Appanah.
Views expressed in this article are solely mine and do not reflect those of any corporation or firm.
Debt Dynamics Formula:
Dt = (1+ Ʊt) Dt-1 – Pt
Where
Ʊt = (it – gt) ÷ 1 + gt
Dt-1 = Debt to GDP of last Year (2015).(61.5%)
Pt = Pimary Surplus (+) or Primary Deficit (-). (-2% -IMF)
gt = nominal growth of GDP.(5.7%)
it = 10 Year Bond Yield. (5.46%)
Computing these gives us a Dt of 63.36%. As long as it < gt the debt will be sustainable but the 10 year bond yield is approaching
dangerously our nominal growth. (5.46 vs 5.7)
Exogenous – External Cause
Spread – Difference
Seigniorage – Profit made by Central Banks. It accounts for the difference between the face value of
money and the cost to produce it.
All diagrams without a source legend come from the author.
Note due to the lack of data, my assumptions are only based on the information collected on the
internet, this can be incomplete.
Winter is coming (1) (2)

Contenu connexe

Tendances

International Capital Flows and Inclusive Growth in Nigeria
International Capital Flows and Inclusive Growth in NigeriaInternational Capital Flows and Inclusive Growth in Nigeria
International Capital Flows and Inclusive Growth in Nigeria
International Journal of Economics and Financial Research
 
Hyre Weekly Commentary
Hyre Weekly CommentaryHyre Weekly Commentary
Hyre Weekly Commentary
hyrejam
 
Dissertation
DissertationDissertation
Dissertation
Interdax
 
A Checklist for Wanna-be Helicopter Pilots
A Checklist for Wanna-be Helicopter PilotsA Checklist for Wanna-be Helicopter Pilots
A Checklist for Wanna-be Helicopter Pilots
Andrea Iannelli
 

Tendances (20)

Capstone
CapstoneCapstone
Capstone
 
Tl243
Tl243Tl243
Tl243
 
International Capital Flows and Inclusive Growth in Nigeria
International Capital Flows and Inclusive Growth in NigeriaInternational Capital Flows and Inclusive Growth in Nigeria
International Capital Flows and Inclusive Growth in Nigeria
 
EIU Global Forecast Report Q4/2020
EIU Global Forecast Report Q4/2020EIU Global Forecast Report Q4/2020
EIU Global Forecast Report Q4/2020
 
Caution gcc economies
Caution gcc economiesCaution gcc economies
Caution gcc economies
 
The crowding out effect of budget deficits on private investment in nigeria
The crowding out effect of budget deficits on private investment in nigeriaThe crowding out effect of budget deficits on private investment in nigeria
The crowding out effect of budget deficits on private investment in nigeria
 
CASE Network Studies and Analyses 156 - Evaluating Government Policy in Trans...
CASE Network Studies and Analyses 156 - Evaluating Government Policy in Trans...CASE Network Studies and Analyses 156 - Evaluating Government Policy in Trans...
CASE Network Studies and Analyses 156 - Evaluating Government Policy in Trans...
 
Deloitte 2014: Global Powers of Luxury Groups
Deloitte 2014: Global Powers of Luxury GroupsDeloitte 2014: Global Powers of Luxury Groups
Deloitte 2014: Global Powers of Luxury Groups
 
Hyre Weekly Commentary
Hyre Weekly CommentaryHyre Weekly Commentary
Hyre Weekly Commentary
 
Xs65
Xs65Xs65
Xs65
 
Dissertation
DissertationDissertation
Dissertation
 
Gi French Connection
Gi French ConnectionGi French Connection
Gi French Connection
 
2016. central banks
2016. central banks2016. central banks
2016. central banks
 
Clouds on economic growth in emerging markets
Clouds on economic growth in emerging marketsClouds on economic growth in emerging markets
Clouds on economic growth in emerging markets
 
Petrocapita - Thoughts on 2011
Petrocapita - Thoughts on 2011Petrocapita - Thoughts on 2011
Petrocapita - Thoughts on 2011
 
A Checklist for Wanna-be Helicopter Pilots
A Checklist for Wanna-be Helicopter PilotsA Checklist for Wanna-be Helicopter Pilots
A Checklist for Wanna-be Helicopter Pilots
 
04.2013, REPORT, Mongolia Economic Update, World Bank
04.2013, REPORT, Mongolia Economic Update, World Bank  04.2013, REPORT, Mongolia Economic Update, World Bank
04.2013, REPORT, Mongolia Economic Update, World Bank
 
Globalisation essay
Globalisation essayGlobalisation essay
Globalisation essay
 
Spant e
Spant eSpant e
Spant e
 
OCR F585 Economics - Extract 2 - Globalisation and Trade Imbalances
OCR F585 Economics - Extract 2 - Globalisation and Trade ImbalancesOCR F585 Economics - Extract 2 - Globalisation and Trade Imbalances
OCR F585 Economics - Extract 2 - Globalisation and Trade Imbalances
 

En vedette

Arbre de tardor
Arbre de tardorArbre de tardor
Arbre de tardor
petit mon
 
Fons de colors de tardor
Fons de colors de tardorFons de colors de tardor
Fons de colors de tardor
petit mon
 
Ref Letter Kathy Brockman
Ref Letter Kathy BrockmanRef Letter Kathy Brockman
Ref Letter Kathy Brockman
Brenda Boles
 
m2015196- edge product brochure-7-pb-rev2-lr
m2015196- edge product brochure-7-pb-rev2-lrm2015196- edge product brochure-7-pb-rev2-lr
m2015196- edge product brochure-7-pb-rev2-lr
Pamela Azevedo
 
Law Enforcement Line-1
Law Enforcement Line-1Law Enforcement Line-1
Law Enforcement Line-1
Jennifer Hawes
 
Presentation1
Presentation1Presentation1
Presentation1
smallslol
 

En vedette (20)

Parecer Revisão do PDE do relator da Comissão de Política Urbana
Parecer Revisão do PDE do relator da Comissão de Política UrbanaParecer Revisão do PDE do relator da Comissão de Política Urbana
Parecer Revisão do PDE do relator da Comissão de Política Urbana
 
Codigo Ambiental do Município de São Paulo PL 252 /2009
Codigo Ambiental do Município de São Paulo PL 252  /2009Codigo Ambiental do Município de São Paulo PL 252  /2009
Codigo Ambiental do Município de São Paulo PL 252 /2009
 
Absolutely Fantastic Slideshow
Absolutely Fantastic SlideshowAbsolutely Fantastic Slideshow
Absolutely Fantastic Slideshow
 
MIFC (1)
MIFC (1)MIFC (1)
MIFC (1)
 
Organisasi
OrganisasiOrganisasi
Organisasi
 
Misturando os números do Sistema Cicloviário de São Paulo
Misturando os números do Sistema Cicloviário de São PauloMisturando os números do Sistema Cicloviário de São Paulo
Misturando os números do Sistema Cicloviário de São Paulo
 
Arbre de tardor
Arbre de tardorArbre de tardor
Arbre de tardor
 
Expansão urbana e o Meio Ambiente
Expansão urbana e  o  Meio Ambiente Expansão urbana e  o  Meio Ambiente
Expansão urbana e o Meio Ambiente
 
Организация оплачиваемых общественных работ и временного трудоустройства граж...
Организация оплачиваемых общественных работ и временного трудоустройства граж...Организация оплачиваемых общественных работ и временного трудоустройства граж...
Организация оплачиваемых общественных работ и временного трудоустройства граж...
 
Peri
PeriPeri
Peri
 
Transcrição da audiência pública sobre o pl 655-09 que altera a lei 14.266 qu...
Transcrição da audiência pública sobre o pl 655-09 que altera a lei 14.266 qu...Transcrição da audiência pública sobre o pl 655-09 que altera a lei 14.266 qu...
Transcrição da audiência pública sobre o pl 655-09 que altera a lei 14.266 qu...
 
Test
TestTest
Test
 
WHPC's Letter
WHPC's LetterWHPC's Letter
WHPC's Letter
 
didgori
didgorididgori
didgori
 
Fons de colors de tardor
Fons de colors de tardorFons de colors de tardor
Fons de colors de tardor
 
Ref Letter Kathy Brockman
Ref Letter Kathy BrockmanRef Letter Kathy Brockman
Ref Letter Kathy Brockman
 
m2015196- edge product brochure-7-pb-rev2-lr
m2015196- edge product brochure-7-pb-rev2-lrm2015196- edge product brochure-7-pb-rev2-lr
m2015196- edge product brochure-7-pb-rev2-lr
 
Law Enforcement Line-1
Law Enforcement Line-1Law Enforcement Line-1
Law Enforcement Line-1
 
Hello test doc
Hello test docHello test doc
Hello test doc
 
Presentation1
Presentation1Presentation1
Presentation1
 

Similaire à Winter is coming (1) (2)

Global Powers of Luxury Goods 2014
Global Powers of Luxury Goods 2014Global Powers of Luxury Goods 2014
Global Powers of Luxury Goods 2014
Rudy Belouad
 
1 10The Real Economy in the Long RunECO372The.docx
1     10The Real Economy in the Long RunECO372The.docx1     10The Real Economy in the Long RunECO372The.docx
1 10The Real Economy in the Long RunECO372The.docx
honey725342
 
Pricing And Non-Pricing Strategies
Pricing And Non-Pricing StrategiesPricing And Non-Pricing Strategies
Pricing And Non-Pricing Strategies
Sonia Sanchez
 

Similaire à Winter is coming (1) (2) (10)

Euro Crisis Immediate Solutions
Euro Crisis Immediate SolutionsEuro Crisis Immediate Solutions
Euro Crisis Immediate Solutions
 
The real effects of debt bis
The real effects of debt bisThe real effects of debt bis
The real effects of debt bis
 
Economy Essay
Economy EssayEconomy Essay
Economy Essay
 
Global Powers of Luxury Goods 2014
Global Powers of Luxury Goods 2014Global Powers of Luxury Goods 2014
Global Powers of Luxury Goods 2014
 
Les réflexions de comptoir 2 - Oct2016
Les réflexions de comptoir   2 - Oct2016Les réflexions de comptoir   2 - Oct2016
Les réflexions de comptoir 2 - Oct2016
 
1 10The Real Economy in the Long RunECO372The.docx
1     10The Real Economy in the Long RunECO372The.docx1     10The Real Economy in the Long RunECO372The.docx
1 10The Real Economy in the Long RunECO372The.docx
 
Doubleplus_Finserve_Newsletter-Apr-23.pdf
Doubleplus_Finserve_Newsletter-Apr-23.pdfDoubleplus_Finserve_Newsletter-Apr-23.pdf
Doubleplus_Finserve_Newsletter-Apr-23.pdf
 
Jetin Presentation FTT
Jetin Presentation FTTJetin Presentation FTT
Jetin Presentation FTT
 
Global Powers of Consumer Products 2013
Global Powers of Consumer Products 2013Global Powers of Consumer Products 2013
Global Powers of Consumer Products 2013
 
Pricing And Non-Pricing Strategies
Pricing And Non-Pricing StrategiesPricing And Non-Pricing Strategies
Pricing And Non-Pricing Strategies
 

Winter is coming (1) (2)

  • 1. Winter is coming? “Go as far as you can see; when you get there, you’ll be able to see farther” – John Pierpont Morgan From the feedback I received from my first article in the Mauritian press, my astonishment was beyond measure by the colourful response I got. I believe it’s with contentious constructive arguments which get someone closer to the truth. The subject was indeed vast but I modestly tried to give an overview of what could be done in order to jumpstart the financial sector in Mauritius. I have worked all my life abroad and I confess that, on developed financial markets, you are bound to become cynical about the environment around you. I have developed a set of skills thanks to the opportunities/failures I experienced. Economics has always been a mystery for me, as a student in high school and during my university days, it just became something you should understand but in no case should be portrayed as a superior truth. With years, I have been even more sceptical about it especially when I start working on mathematical models in finance, economics and even human behaviour. Very quickly, economic models assumptions became so far-fetched. For example, a neoclassical model is heavily being used by Central Banks called the DSGE which stands for Dynamic Stochastic General Equilibrium to predict the dynamics of the economy. This model tries to overcome the Lucas Critique (past relationships will not hold in the future) but still avoid block like money and financial institutions as agent in its hypothesis. Knowing how economies are financialized and how Central Banks have taken such important leading roles, these models proved to be not very useful in ”forecasting” the global financial crisis in 2008. However, combining some concepts of economics with history, we can extract some useful insights about the dynamics of an economic structure. So, I decided following the comments I got from my first article to analyse the economic environment of Mauritius these past years under the magnifying glass of a quant hedge fund manager. There will be no prediction because I don’t possess a crystal ball. But there will be an effort to explain, in my point of view, how things have evolved since the past years and why we arrived at the situation we are experiencing today. There are many solutions or explanations which can be brought but instead of being precisely wrong I will try to be approximately right. 2015 was … The GDP growth was around 3.9% (MCCI figures) with an unemployment rate neighbouring 8 %. The country has also an inflation of 1.7%, a budget deficit of 3.8%, current account deficit north of 5% and a debt equal to 55.5% of the output. The national debt is the sum of all past deficits plus all extra government spending which need external funding. So, I will not indulge in fantasy but in economic reality. Mauritius has always adopted Keynesian economics when it comes to economic policies i.e significant government spending, state intervention anywhere and everywhere. The very basic economic analysis shows that an economy will not be subject to economic cycles, only if its consumption matches exactly its production. This is rarely possible, so to remedy to this issue, borrowing and lending of capital help to consume or produce more. In return this economy will be impacted by booms and bursts. Credit, hence, debt becomes an important element to judge a country’s room to manoeuvre. The Mauritian debt dynamics¹ is still under control meaning that with the primary deficit (difference between government revenues and spending before interest payments), nominal growth and the one year yield on T Bills, our debt is manageable as the nominal growth is still over the 10 year bond yield. Nevertheless, it is dangerously approaching the 65% level, a high earmark for a small country. The duration of the debt is around 5 years, which shows
  • 2. that we are exposed to short term refinancing risk, in terms of maturity and interest rates. With the twin deficits, current account and budget, the state of Mauritius ability to undertake the structural reforms is therefore becoming limited. A current account deficit means that the country is consuming more than it’s producing, meaning we are selling rupees to buy foreign currencies. A budget deficit is only the difference between the government receipts (taxes) and its spending (welfare state, regalian functions, black swan events). Both deficits, combined contribute to the accumulation of debt. So long, debt is being used to invest in productive activities, it will naturally increase the GDP. With the multiplier effect, the debt/gdp ratio will naturally deflate. However, if the state uses debt unwisely to increase its size, finance loss making para-statal bodies, providing safety net and increasing moral hazard, the situation can become out of control as agents financing this debt will demand higher returns to compensate for risks and inflation. Fortunately, our deficits are mainly financed by domestic players. Inflation in Mauritius Inflation is a hidden tax. It is a steady increase in prices accompanied by a fall in the value of money. Put it simply, does 10 rupees last year at this time can buy the same amount of goods today. If not, there is either inflation or deflation ceteris paribus. The following diagrams depict the 2 sources of inflation in Mauritius. As we can see, the Mauritian inflation rate is very closely correlated to world oil prices and food prices. These two commodities are imported which means that the country is very elastic to the shocks occurring on these prices. However, theoretically there are two caveats to counterbalance the effects of these fluctuations; a steady appreciating exchange rate, meaning a strong currency and an increasing net productivity. The European Union is our main trading partner. Let’s check the exchange rate EUR/MUR 0 2 4 6 8 10 12 0 50 100 150 200 250 12/1/2006 11/1/2007 10/1/2008 9/1/2009 8/1/2010 7/1/2011 6/1/2012 5/1/2013 4/1/2014 3/1/2015 0 2 4 6 8 10 12 0 20 40 60 80 100 120 140 160 12/18/2006 12/18/2007 12/18/2008 12/18/2009 12/18/2010 12/18/2011 12/18/2012 12/18/2013 12/18/2014 12/18/2015 Red Line – Food Price Index (WFO) LHS Blue Line – Inflation Rate (%) RHS Red Line –Brent Oil Price (USD) LHS Blue Line – Inflation Rate (%) RHS
  • 3. Stats Mauritius To have an appreciating currency, you need to accumulate surpluses which signify you are capturing trade market share (Nash non cooperative strategy) from other countries or there are high domestic interest rates. The exogenous* factor can be that your trading partners are debasing their currencies. In the above diagram, there is an appreciation of the MUR (risks on the EuroZone and bond purchasing program initiated there) which should taper imported inflation. However, there is an average annual productivity gain of 2.6% accompanied by an average annual increase in wages of 3.82%. Therefore, we can realistically purport that there is around 1.22% which is added annually to the wage push inflation since 2006. Other factors contributing to inflation will add up to this number, positively or negatively. Conjunction of factors The concept of prices is very important in an economy. Prices are not just a statement of value but a system of information. On every market, prices encapsulate the forces of demand and supply but also the chain of information which contains in its value. Any authority who tries to distort the price discovery mechanism will not only disrupt investment/saving behaviour but can create misallocation, capital and labour, in an economy. In a nutshell, the economic growth rests on two building blocks: population and productivity. Population determines how many workers a country will have and productivity is the output per worker. For example, if a labour force grows by 1 % and the productivity by 1.5%, the potential growth is 2.5%. Productivity depends on capital and ideas. You can raise productivity by equipping workers with more capital, which means investing in land, buildings, equipment or specific training. A rupee invested for tomorrow is a rupee not available to spend on the pleasures of life today. Thus, investment requires saving. The more a society saves, whether its firms or households, the more capital it accumulates. However, every rupee invested provides a smaller boost to production. This is called the law of diminishing returns. So how we overcome the law of diminishing returns? Well, with ideas. For example, by combining capital and labour in different ways could give newer products at better costs. At first, there was Microsoft Internet Explorer which was attacked by Firefox and now by Google Chrome. Entire countries can boost their development by copying the ideas and technologies of other countries. The factors determining economic growth are thus: 35 40 45 50 12/18/2006 12/18/2007 12/18/2008 12/18/2009 12/18/2010 12/18/2011 12/18/2012 12/18/2013 12/18/2014 12/18/2015 EUR/MUR
  • 4.  Human Capital  Rule of Law not Rule of Lawyers  Letting markets work The following table summarises statistically, through an index, the two main determinants of future growth. Source: Dalio,Elliott This study was based on 22 countries and the conclusions are crystal clear, competitiveness and indebtedness are the main drivers of output. All the parameters are explicit and give a clear picture of what the country needs to enhance to increase the growth potential. Every economy is the sum of the transactions that make it up. A transaction consist of the buyer giving money or credit to a seller and the seller giving a good, a service, a financial asset to the buyer in exchange. A market consists of all the buyers and the sellers making exchanges for the same things. For any market, if you would know the total amount of money/credit spent and the total quantity sold, you would know everything you need to know. For example, the price of any good is equal to the amount spent by buyers (total MUR value) divided by the total quantity sold by sellers (total Q). The Total MUR spent is composed of money plus credit. If you go to a store to buy something, you can pay either cash or by credit card. If you pay with a credit card, you have created a credit, which is a promise to deliver money at a later date. All changes in the economic activity and all changes in financial market prices are due to variations in the amounts of money and credit that are spent on goods/services but also on the amounts which are sold. Any alterations in the total MUR have a much bigger impact on the economic activity and prices than do changes in the total units sold. This is because it’s easier to change the supply of money and credit. The clustering of buyers can either be the private sector or the government. Inside the private sector, there is the household category and the firm’s category. With such settings, the economy will have a long term trend which will be based on the growth of productivity but also a short term cycle which is the
  • 5. business cycle. It is mainly when the rate of growth in spending grows faster than the rate of growth in the capacity to produce. This will lead to an increase in price. This is only curtailed by tight money and credit done by Central Banks through interest rates. When this happens, there is a recession and consequently the same Central Bank will lower interest rates to reduce debt service and to stimulate new demand. This creates a wealth effect, causes stock prices to rise and encourages consumption, theoretically speaking. Money being at the heart of the system Money is the system through which information about the current and future values of goods/services. However, prices as a consequence of money contain two sub prices. The first price is the exchange rate, which will allow a country to specialise in its comparative advantage. The second price is the interest rate which will choose between investment/consumption and saving decisions. Any effort to try to manipulate these two prices will potentially lead to economic disasters. For example, having a single currency zone like Europe where nations with different competitiveness sharing the same exchange and interest rates won’t work without internal transfers among these countries. Thus, any attempt to manipulate these two sub prices will give fake prices in the economy. Any rational entrepreneur will not take any investment decisions if he can’t assess the “purity” of prices. The average entrepreneur borrows for two main reasons: Capital spending, which takes place when business is expanding that is resources are needed to build new plants or hire people. The second reason is financial engineering which is the ability to purchase existing cash flows or any stream of income. Unfortunately, the second reason does not lead to an increase in the stock of capital; it just leads in a change of ownership of capital. Very often this is done with debt. And eventually leads to a concentration of asset ownership. Share buybacks and mergers & acquisitions operations can be described as financial engineering here. Referring to economic theory, Knut Wicksell, a Swedish economist, explained that there two rates in an economy which should be monitored. A market rate which is the short rates determined by supply/demand of credit and the natural rate is the simply the economy’s structural growth rate. So any significant difference between these two prices will cause disruption in the economy. I will compute these figures later to show when interest rates are not in line with the fundamentals of the economy lead to misallocation of resources. Velocity of Money Velocity of money is a difficult concept to understand or to calculate. It can be defined as the number of times one unit of currency is spent to buy and services per unit of time. Fisher gave a formula to calculate the velocity but I will calculate it using this formula GDP/M2, which is an ex post measurement. M2, for the uninitiated, is a measure of money which includes notes/coins in circulation plus short term deposits in banks. To show how velocity and interest rates are correlated, lets show the following the graph. Note there is a scarcity in Mauritian data, the period analysed will be small, from 2006 to 2013.
  • 6. Treasury Bills are short term bonds issued by the Central Bank. As shown above, there is a close relationship between the change in the velocity of money and the change in the Treasury bill yield. Due to a lack of deeper past and recent data, it will be interesting to see how this relationship held in the past and right now. It is known that that any disruption of this relationship can have serious consequences on the economy in terms of allocation of resources but also on the central bank monetary policy. In Mauritius, there is a falling velocity of money in absolute terms mainly because the money supply (M2) is rising faster each year. Assessing the allocation of resources The allocation of resources in any economy is very important. It is mainly driven by the credit which is poured in the system and targeted towards projects which will return the best yield. So, any interest rate which is set by the Central Banks, which will be diffused in every rates at all maturities will bear two things, an inflation component and a real price component which is usually aimed at incentivizing savers. However, these two components can move in opposite directions. So, the Central Bank needs to fight inflationary pressures on one hand and on the other have a real interest rate which will enable savers to save along with encouraging entrepreneurs to invest. So by definition, there should be an environment where interest rates should be maintained as close as possible to the economy’s structural growth rate. In other words, any investment which should be done, by the public or private sector, should aim at pushing the structural growth rate further. However, there is a caveat when interest rates are far too low compared to the fundamentals of the economy. In this situation, investment and allocation of resources are directed towards existing projects i.e real estate, sectors with low returns or in the worst case Ponzi-like structures which we are well acquainted to in Mauritius. When this happens, there is an incentive to borrow massively, this will cause a rise in prices of these assets and whenever this bubble pops out, an enormous amount of capital is destroyed which will impact negatively exposed banks and as a consequence significantly decrease the potential economic growth. The Wicksellian Spread* measures the difference between the nominal GDP growth YoY%(year on year) and the 5 Year Treasury Notes. Here it is: -0.2 -0.15 -0.1 -0.05 0 -1 -0.5 0 0.5 1 2007 2008 2009 2010 2011 2012 2013 Change in Tbills Rate LHS Change in Velocity RHS
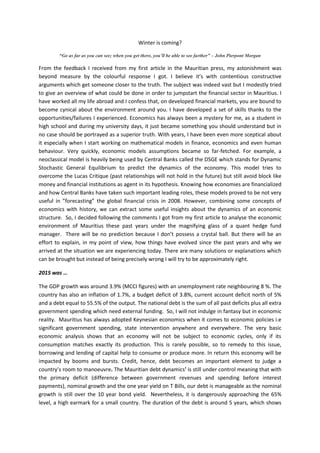
  • 7. There in an incentive to borrow massively from 2007 to 2008. It then became less interesting to borrow, but from 2010 to 2014; there is again an incentive to borrow for public and private sector. The question to be asked is where this money has been invested. As explained before, when the Wicksellian Spread is positive, there is a global tendency to crowd out new investment which could provide higher rate of returns with existing projects with lower yields. Let’s take for example, the housing and construction sector. Note there is no land price index in Mauritius. Red Circle – Period 2007 to 2008 Red Circle – Period 2011 to End 2012 0.00% 2.00% 4.00% 6.00% 8.00% 10.00% 12.00% 14.00% 16.00% 18.00% 2006 2007 2008 2009 2010 2011 2012 2013 2014 2015 2016 -10.00% -5.00% 0.00% 5.00% 10.00% 2007 2008 2009 2010 2011 2012 2013 2014 2015 125.0 130.0 135.0 140.0 145.0 150.0 155.0 160.0 165.0 170.0 175.0 3/1/2007 6/1/2007 9/1/2007 12/1/2007 3/1/2008 6/1/2008 9/1/2008 12/1/2008 Contruction Price Index 2007-2008 100.0 102.0 104.0 106.0 108.0 110.0 112.0 114.0 116.0 CPI HOUSING Base 100 Red Line – YoY % in Yield 5Y Bond Blue Line – YoY% in nominal GDP growth Blue Surface – Difference between red and blue.
  • 8. The above diagrams show that on period where the Wicksellian Spread was positive, there was a significant enticement to borrow, and this went massively to the tourism/real estate/construction sector. In terms of balance sheet situation of corporates (main sectors) and households, the share of credit to these sectors increased significantly 2005 – 2011 2012-2014 100.0 105.0 110.0 115.0 2011 2011 2012 2012 2012 2012 2013 2013 2013 2013 2014 2014 2014 2014 Contruction Price Index 2011 - 2014 90 95 100 105 110 115 120 2005 2006 2007 2008 2009 2010 2011 2012 2013 2014 No of Hotels
  • 9. The above statistics are pretty revealing. Most of the allocation of resources was directed towards the real estate (land) and tourism sector. By extension, the latter is interdependent with the real estate sector because of the capacity building which is necessary to accommodate incoming tourists. The tourism sector has also spill-over effects on the domestic real estate market as it generates rising asset prices which in turn requires more debt for newcomers who want to invest in land or housing. This is shown in the leverage ratios of the tourism/real sector and the debt levels of households. The equity multiplier for Construction/RealEstate is around 153% meaning that more than half of the assets are being financed by debt. For Tourism sector, it’s around 237% which means that a bit more than 40% of the assets are financed by leverage. The financial services sector is also significantly indebted. To know the required rate of return for a business, a metric called Weighted Average Cost of Capital(WACC) is calculated, for construction its around 7.6% compared to a return on assets around 4% for the period 2005 to 2013. This means as a whole the sector is destroying value. For the tourism sector, the WACC is around 6.5% compared to a return of assets of 2.5% on the same period which is a result of a significant misallocation of resources. On the household side, more than 60% of the disposable income is debt with housing credit and a consumer credit portion. The consumer credit also comprises auto loans/leases which is one of the worst debts possible. Leasing which is a common way of financing the purchase of a car (or home appliances) is an investment which is totally a liability. Say, you are leasing a car which cost, for simplicity, MUR 100000, and the lease contract requires you to pay around Rs2000 per month for three years. After the depreciation curve effect, the buyer has paid Rs72000 after three years, but still don’t have the right to sell the car as he is not the owner, but if ever he has the right to dispose of his car at market price which is around Rs55000, then the buyer would have paid Rs127000 for a car which was only worth Rs100000. For this reason, leasing is one of worse form of debt especially when it concerns cars/home appliances. Regardless of the nature of the debt, there is no capital creation with this kind of leverage. It’s sunk cost at best. Interestingly enough, banks or shadow banking players (for car/home appliances lease mainly) finance these kind of credit. Fortunately for the tourism sector, it is believed that it will encapsulate significant momentum as Mauritius still enjoys a good reputation internationally. With better connectivity, it is believed that the sector will be generating enough cash flows in the future. But the market positioning, air access and the ability to attract dollar value tourists will be main challenges in the coming years. Concerning the real estate sector as a whole, the reality check will come when the Central Bank will be raising its interest rates or when the return will be so low(compared to servicing rate of debt) that a debt deflation mechanism will start to operate. For this reason, “smart” cities development must be conducted with extreme care. Labour misallocation We talked about capital misallocation but there is an important aspect called labour misallocation which should not be ignored. It refers to an influx of labour in specific sectors where the marginal gain is small. The following table shows the workforce distribution among different core sectors.
  • 10. 000’s Let’s calculate a compounded annual growth rate of the workforce for each sector, the offshore industry had an annual growth rate of around 14%, the construction industry around 0.8%, the public sector around 1.8% and the tourism sector around 3.38%. The following table shows some important metrics concerning sectors like Construction, Tourism and financial services. Bank of Mauritius From the above metrics, all of these 3 sectors are heavily indebted and have a return on equity around 10 %. But the ROE is known to be misleading especially when there is a high debt because of the risks which are being taken. Equity tranche in balance sheet seem to be thin given the ratios calculated in upper section. With this kind of leverage, the return on equity can be magnified artificially. The strategy which seems to be the case here was to borrow heavily in order to increase the return on equity. Unfortunately, this is merely financial engineering. On top of that, offshore and
  • 11. tourism were employing more and more people. Now that the environment has become challenging in the offshore centre, we can realistically say that excess capacity being built in the past years will be shrinking in the coming years (conclusion based on the possible incomplete data of that analysis as offshore centre is just a part of financial services). As far the public sector is concerned, there is a steady rise of 1.8% each year. Given the debt/gdp ratio of nearly 60%, increasing constantly public sector capacity which is unproductive will prove to be damaging for the economy at large. Monetary Policy and Financial Markets The objective of the Central Bank is to provide the necessary amount of money to the economy and making sure that price levels are stable. Some central banks have a double mandate that is inflation targeting and setting the right economic environment for economic growth. The role of both monetary policy (interest rates and money supply) and fiscal policy (government spending and taxation) is to speed up the return to the underlying path of steady growth. In Mauritius, the repo rate is considered as the source rate on which all other rates will rely on. This rate is very important as it helps to anticipate future inflation and also allow arbitrating between consumption/investment. The core structure of the transmission mechanism is as follows: It exists a number of transmission channels of the monetary namely the interest rates, asset prices and balance sheets. Equities and real estate are considered to be the last cavity in which money flows. It’s very important to have a good transmission of monetary policy to the real economy because it enables price discovery and also gives credibility/independence to the central bank. In Mauritius, this connection is not fluid because the structure of the money market (maturity less than a year) and bond market at large is not very efficient. Therefore, this creates an illiquid yield curve. Equities + Real Estate High Yield Bonds , Bank Loans >5 Year Notes, 10 Y Bonds, 15 Year Bonds 2 Year Notes to 5 Years Bonds 3 Month Bills to 2 Years Notes Repo
  • 12. There is also an excess liquidity in the system which makes the transmission of monetary policy to the real economy more challenging. A sterilisation process is necessary to remove that excess liquidity from system but it comes with a cost. The funds raised by the issuance of government securities to extract the excess cash in the system is usually invested in foreign currencies which often will return much lower yields than the ones issued on local market. Consequently, losses are realised by the Central Bank. Hopefully, the Bank of Mauritius will not make use of seigniorage* to cover losses. In terms of easing the transmission mechanism, different players should be encouraged to participate in the repo, securities lending and bond market. Short selling should be introduced in order to hedge trading books for market making desks. Central Banks should be on the forefront to provide primary dealers with privileged information in order for them to undertake market making. Instead of analysing directly the SEMDEX, I will divide the SEMDEX by the SP500, which is the US index for the 500 biggest companies in America. This ratio will show us how if the SEMDEX is overvalued/undervalued with regards to his US index. On the same graph, I have plotted the repo rate. During the circled periods (Wicksellian Positive Spread), there is an influx of capital in the stock market. During the period 2007 to mid-2008, the local Stock Market outperformed the SP500 by nearly 90%. But as from 2011, SEMDEX was sub performing compared to the SP500. On absolute terms (second diagram), every circle where there is a Positive Wicksellian Spread we have an influx 3.00% 4.00% 5.00% 6.00% 7.00% 8.00% 9.00% 10.00% 0.60 0.80 1.00 1.20 1.40 1.60 1.80 2.00 SEMDEX/SP500 Repo Rate 3.00% 4.00% 5.00% 6.00% 7.00% 8.00% 9.00% 10.00% - 500.00 1,000.00 1,500.00 2,000.00 2,500.00 SEMDEX Repo Rate
  • 13. of capital in the stock market. This happened with no significant repo rate cuts. We can therefore purport that on average stock market enjoyed an inflow of funds at various times, all of them corresponding to the moment where market rate of interest was low compared to the natural rate of interest. This again confirms that allocation of resources was mainly directed to existing assets. Conclusion Price formation is decisive in an economy. Interest rate, being at the centre of the game, is of utmost importance when it comes to quality of growth we want to obtain. For any Central bank to achieve credibility and independence there is a need to have an efficient market structure for interest bearing securities, which is very important in the fight against inflation and misallocation of resources. Mauritius will not be able to get in the high income country category with non-productive investments and lack of capital. By doing so and with an ageing population, we would potentially create a lost generation with low salaries and as a result will cause a mismatch in the retirement funds financing. My analysis foregoes a lot of other technicalities, at some point, it might even be slightly inaccurate but the global picture is that during many years the investment opportunities have been targeted towards projects/sectors with poor long term returns. This is a direct consequence of the difficulty to discriminate between good and bad projects. Obviously, there are sections in the real estate or other sectors, where the returns are fairly good, but on average, these activities will not prove to be generating long run returns, either for structural reasons or regulatory ones. Their benefits for most of them don’t trickle down. Any investment which is undertaken, by government or the private sector, should push the structural growth further. We should also make sure that each investment which is realized is increasing the stock of capital. For this reason, the Central Bank must encourage people to save with much higher real interest rates. Unfortunately, with the level of indebtedness of the industrial tissue it is highly unlikely that this will happen. Also, the Mauritian production of goods and services is very price sensitive, and surprisingly enough, there are often attempts either by government or lobby groups to influence the MPC. Currency war is not an option; we are too small and already too expensive in our lifestyle compared to our productivity. Achieving structural economic growth will not be easy. There is a global environment which is becoming very challenging because of technology, artificial manipulation of prices and interest rates, enormous amount of liquidity in the global financial system and deflationary pressures in major countries. All these factors will create volatility especially for emerging markets. For Mauritius, to overcome this situation, a long-term investment plan should be enacted. This should gravitate around technology, education, technical training, global infrastructures and personal responsibility. To meet these objectives, the following costs should be either lowered or be made much productive.  Cost of Labour  Cost of Land  Cost of Government  Cost of Energy  Cost of Capital If these elements are made more productive/efficient, it will drive automatically investment. But again any investment should front run major global changes which are happening in the world. We
  • 14. should not as a country fall behind the curve of innovation. Investment and ideas should be nurtured. An honest government and trustworthy laws will encourage investors to take risks. The system should also ensure that dying and unproductive industries are winnowed so that growing industries can attract capital and human capital. Davin Appanah. Views expressed in this article are solely mine and do not reflect those of any corporation or firm. Debt Dynamics Formula: Dt = (1+ Ʊt) Dt-1 – Pt Where Ʊt = (it – gt) ÷ 1 + gt Dt-1 = Debt to GDP of last Year (2015).(61.5%) Pt = Pimary Surplus (+) or Primary Deficit (-). (-2% -IMF) gt = nominal growth of GDP.(5.7%) it = 10 Year Bond Yield. (5.46%) Computing these gives us a Dt of 63.36%. As long as it < gt the debt will be sustainable but the 10 year bond yield is approaching dangerously our nominal growth. (5.46 vs 5.7) Exogenous – External Cause Spread – Difference Seigniorage – Profit made by Central Banks. It accounts for the difference between the face value of money and the cost to produce it. All diagrams without a source legend come from the author. Note due to the lack of data, my assumptions are only based on the information collected on the internet, this can be incomplete.