
Recommandé
Recommandé
Contenu connexe
Tendances
Tendances (20)
Similaire à Chmic economic report aug 2016
Similaire à Chmic economic report aug 2016 (20)
Dernier
Dernier (20)
Chmic economic report aug 2016
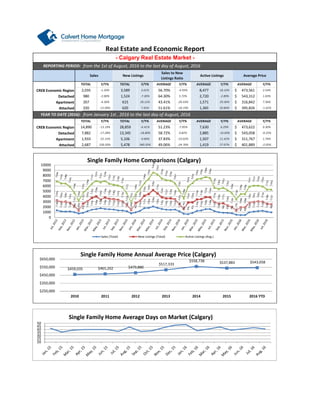
- 1. CREB Economic Region Detached Apartment Attached 2016 CREB Economic Region Detached Apartment Attached 1,507 11.42% 311,767$ 13,345 -18.80% 58.72% 0.82% 2,885 -16.69% 543,058$ 1.74% 2,687 230.50% 5,478 340.35% 49.06% -24.76% 1,419 27.07% 401,889$ -2.05% 1,933 -22.15% 5,106 -0.84% 37.83% -23.02% Real Estate and Economic Report Sales New Listings Sales to New Listings Ratio Active Listings Average Price 980 -2.00% 1,524 -7.30% 64.30% 5.72% TOTAL Y/Y% TOTAL Y/Y% AVERAGE Y/Y% from the 1st of August, 2016 to the last day of August, 2016 -1.50% 3,589 3.61% 56.70% -4.93% REPORTING PERIOD: AVERAGE Y/Y%Y/Y% 2,720 -2.89% 543,312$ 1.03% 267 -4.30% 615 20.12% 43.41% -20.33% 1,571 29.30% 316,842$ AVERAGE 8,477 18.10% 473,561$ 2.54%2,035 7.36% - Calgary Real Estate Market - 395,826$ -1.62%620 7.45% 51.61% -18.19% 1,365 20.80% from January 1st , 2016 to the last day of August, 2016 320 -12.09% -0.25% 14,890 TOTAL Y/Y% TOTAL Y/Y% AVERAGE Y/Y% YEAR TO DATE (2016): 0.30% AVERAGE Y/Y% AVERAGE Y/Y% -13.19% 28,859 -6.41% 51.23% -7.95% 7,630 6.29% 473,622$ 7,882 -17.28% $459,035 $465,202 $479,880 $517,333 $558,738 $537,883 $543,058 $250,000 $350,000 $450,000 $550,000 $650,000 2010 2011 2012 2013 2014 2015 2016 YTD Single Family Home Annual Average Price (Calgary) 0 1000 2000 3000 4000 5000 6000 7000 8000 9000 10000 Single Family Home Comparisons (Calgary) Sales (Total) New Listings (Total) Active Listings (Avg.) 20 25 30 35 40 45 50 Single Family Home Average Days on Market (Calgary)
- 2. Total Residential Single Family Detached Condominium Duplex/Rowhouse 2016 Total Residential Single Family Detached Condominium Duplex/Rowhouse 802 -26.29% 1,573 -14.88% 52.29% -11.38% 356,038$ 0.66% 5,025 -33.99% 10,177 -28.92% 50.24% -4.99% 442,245$ 0.70% 2,571 -28.20% 6,688 -10.24% 38.39% -20.02% 250,834$ -1.10% YEAR TO DATE (2016): from January 1st, 2016 to the last day of August, 2016 AVERAGE Y/Y% 8,511 -31.98% 18,913 -21.80% 45.43% -11.52% TOTAL Y/Y% 372,920$ -0.09% TOTAL Y/Y% AVERAGE Y/Y% 355 -13.63% 767 -0.78% 46.28% -12.67% 252,162$ -0.31% 87 -39.16% 163 -40.07% 53.37% 0.71% 369,139$ 1.36% 0.84% 623 -28.64% 1,136 -31.57% 54.84% 3.47% 443,645$ 1.46% 1,086 -25.72% 2,105 -24.20% 51.59% -2.00% 371,960$ TOTAL Y/Y% TOTAL Y/Y% AVERAGE Y/Y% AVERAGE REPORTING PERIOD: from the 1st of August, 2016 to the last day of August, 2016 Sales New Listings Y/Y% Sales to New Listings Ratio Average Price - Edmonton Real Estate Market - $383,226 $379,485 $392,446 $409,438 $431,882 $436,416 $442,245 $340,000 $360,000 $380,000 $400,000 $420,000 $440,000 $460,000 2010 2011 2012 2013 2014 2015 2016 YTD Single Family Home Annual Average Price (Edmonton) 941 854 773 782 623 419 528 648 923 1,022 1,179 1,198 1,125 983 857 863 673 436 485 747 917 1,147 1,213 1,324 1,158 1,019 1,020 908 777 439 390 547 876 1,001 1,078 1,243 1,111 884 873 728 680 435 342 517 605 691 775 802 670 623 1,455 1,380 1,266 1,082 769 409 955 1,115 1,467 1,569 1,911 1,586 1,491 1,349 1,268 1,059 783 415 1,070 1,082 1,585 1,818 2,085 1,829 1,601 1,354 1,335 1,260 794 534 1,298 1,428 1,883 1,964 1,974 1,886 1,782 1,741 1,660 1,283 1,059 719 1,308 1,584 1,241 1,279 1,283 1,216 1,130 1,136 0 500 1000 1500 2000 2500 Single Family Home Comparisons (Edmonton) Sales (Total) New Listings (Total) 0 50 100 150 200 < $100 $100 - $199 $200 - $299 $300 -$ 349 $350 - $399 $400 - $449 $450 - $499 $500 - $549 $550 - $599 $600 - $649 $650 - $699 $700 - $799 $800 - $899 $900 - $999 $1M + Aug-15 Aug-16 Number of Sales by Price Range (Calgary Total Sales)
- 3. Alberta Canada Unemployment Rate 2016 YTD in Alberta Retail Trade (mill. $'s) in Canada Jul-16 Total Mortgages May-16 -2.90% 1.17% 0.68% 29.79% Aug-16 $1,104.90 -4.16% $961.60 0.71% 2,169Mortgages 90 Day Arrears May-16 Avg. Weekly Earnings 13,155 1.90%in Canada Housing Starts (000's) 2015 1.20% 41.03%in Alberta No Data 0.00% 25.78 -3.50% -25.76% in Canada 4,692,874 43,763 7.10% 4.23% 2.89% 1.30% in Alberta in Alberta 7.79% in Canada 2015 Real GDP Growth Annual Y/Y%TOTAL Net Migration to AB Aug-16 576,089 -2.52%in Alberta 6,135 in Canada *the following information is based on current available data from: http://economicdashboard.albertacanada.com/, www.statcan.gc.ca/dai-quo/ and RBC Economic Outlook,http://www.cba.ca/en/component/content/publication/69-statistics, http://www.atb.com/SiteCollectionDocuments - Alberta Economic Indicators - TOTAL Y/Y%2016f 0 20 40 60 80 Average Days on Market (Edmonton) 1,149 1,146 1,118 $1,100 $1,120 $1,140 $1,160 2014 2015 2016YTD Average Weekly Earnings Average Weekly Earnings (Alberta) 0.20% 0.23% 0.25% 0.28% 0.30% 0.33% 0.35% 0.38% 0.40% 2015-01 2015-02 2015-03 2015-04 2015-05 2015-06 2015-07 2015-08 2015-09 2015-10 2015-11 2015-12 2016-01 2016-02 2016-03 2016-04 2016-05 Mortgages % of Arrears to Total Number of Mortgages (AB) % of Arrears to Total Number of Mortgages (Canada) Mortgage Arrears Ratio; Canada vs Alberta
- 4. Resources http://economicdashboard.albertacanada.com/ http://www.creb.com/ http://www.ereb.com/REALTORSAssociationOfEdmonton.html http://www.capp.ca/Pages/default.aspx http://homepriceindex.ca/hpi_tool_en.html http://www.cba.ca/en/component/content/publication/69-statistics http://www.finance.alberta.ca/aboutalberta/ http://www.statcan.gc.ca/dai-quo/ http://www.housepriceindex.ca/default.aspx?langue=EN http://www.bankofcanada.ca/wp-content/uploads/2014/12/fsr-december2014.pdf http://www.rbc.com/economics/economic-data/index.html $0.00 $10.00 $20.00 $30.00 $40.00 $50.00 $60.00 $70.00 WCS Oil Prices WTI Oil Prices WTI - WCS Price Differential WTI and WCS Pricing and Price Differential (US$) 4,000 4,100 4,200 4,300 2014 2015 2016YTD Population of Alberta Population (thousands)