1. Total Residential
Single Family
Condo
Townhouse
Real Estate and Economic Report
Sales New Listings
Sales to New
Listings Ratio
TOTAL Y/Y% TOTAL Y/Y% AVERAGE Y/Y% AVERAGE Y/Y% AVERAGE Y/Y%
8,141 11.14% 11,127 14.87% 74.21% ‐4.04% 7,163 7.84% $ 4 76,071 4.16%
4,041 4.07% 5,338 7.90% 77.59% ‐3.87%
YEAR TO DATE (2014): from January, 2014 to November, 2014
2014
Total Residential
Single Family
Condo
1,051 59.29% $ 3 23,703 6.08%
AVERAGE Y/Y% AVERAGE Y/Y%
940 25.03% $ 3 24,209 8.50%
TOTAL Y/Y% TOTAL Y/Y% AVERAGE Y/Y%
16,495 6.23% 23,226 11.05% 71.69% ‐4.96%
Townhouse 3,380 12.67% 4,738 21.92% 72.58% ‐6.53%
470 5.75% $ 3 63,997 6.41%
2,573 ‐5.89% $ 5 52,183 6.93%
4,535 19.69% 6,991 29.92% 64.70% ‐8.94%
6,894 ‐3.89% $ 4 74,650 5.30%
32,898 13.27% 48,134 11.23% 68.65% 1.00%
544 28.02% $ 3 63,351 2.53%
895 18.86% 1,171 25.51% 77.86% ‐5.65%
2,705 5.86% $ 5 61,007 9.00%
1,141 18.36% 1,764 39.78% 65.11% ‐15.56%
Active Listings Average Price
- Calgary Real Estate Market -
REPORTING PERIOD: from September, 2014 to November, 2014
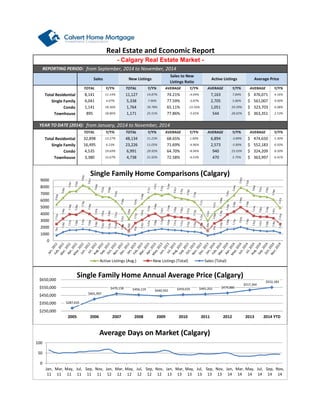
Single Family Home Annual Average Price (Calgary)
$287,635
$401,997
$470,158 $456,119 $440,592 $459,035 $465,202 $479,880
$517,344
$552,183
9000
8000
7000
6000
5000
4000
3000
2000
1000
$650,000
$550,000
$450,000
$350,000
$250,000
2005 2006 2007 2008 2009 2010 2011 2012 2013 2014 YTD
0
Single Family Home Comparisons (Calgary)
Active Listings (Avg.) New Listings (Total) Sales (Total)
100
50
0
Jan,
11
Mar,
11
May,
11
Jul,
11
Sep,
11
Nov,
11
Jan,
12
Mar,
12
May,
12
Jul,
12
Sep,
12
Nov,
12
Jan,
13
Mar,
13
May,
13
Jul,
13
Sep,
13
Nov,
13
Jan,
14
Mar,
14
May,
14
Jul,
14
Sep,
14
Nov,
14
Average Days on Market (Calgary)
2. - Edmonton Real Estate Market -
REPORTING PERIOD: from September, 2014 to November, 2014
Total Residential
Single Family
Condo
Townhouse
Average Price
Y/Y%
Sales New Listings
Sales to New
Listings Ratio
TOTAL Y/Y% TOTAL Y/Y% AVERAGE Y/Y% AVERAGE
3,919 0.64% 5,660 8.87% 73.67% ‐3.49% $ 373,188
2,534 5.89% 3,387 8.91% 76.67% ‐2.13% $ 435,105 5.52%
1,175 ‐1.84% 1,643 2.05% 70.33% ‐6.64%
8.07%
320 31.15% 425 18.72% 75.33% 7.62% $ 352,644 7.06%
YEAR TO DATE (2014): from January, 2014 to November, 2014
2014
Total Residential
Single Family
Condo
$ 256,717 6.46%
AVERAGE Y/Y%
$ 366,245 5.34%
$ 431,231 5.65%
TOTAL Y/Y%
TOTAL Y/Y% AVERAGE Y/Y%
16,607 2.32% 26,392 8.28% 64.09% ‐4.86%
10,222 2.23% 15,836 8.82% 65.36% ‐5.64%
4,960 3.64% 7,962 3.08% 62.09% ‐1.73% $ 250,961 4.40%
Townhouse 1,260 14.86% 1,802 19.18% 70.00% ‐4.11% $ 345,243 4.82%
Single Family Home Annual Average Price (Edmonton)
$370,240
$383,226 $379,485
$392,446
$409,438
$429,007
2,500
2,000
1,500
1,000
500
$440,000
$420,000
$400,000
$380,000
$360,000
$340,000
2009 2010 2011 2012 2013 2014 YTD
1,155
543
1,354
737
1,737
1,663
989
1,084
1,943
941
854
773
782
1,264
1,136
419
528
623
923
1,022
648
983
857
863
1,179
1,198
1,125
436
485
673
917
692
924
967
850
1,147
1,213
1,218
1,092
1,627
717
1,455
1,380
1,266
1,082
769
409
955
1,115
1,467
1,569
1,911
1,586
1,491
1,349
1,268
1,059
783
415
1,070
1,108
1,585
1,818
2,085
1,828
1,602
1,353
1,337
1,256
794
0
Single Family Home Comparisons (Edmonton)
Sales (Total) New Listings (Total)
100
50
0
Jan,
11
Mar,
11
May,
11
Jul,
11
Sep,
11
Nov,
11
Jan,
12
Mar,
12
May,
12
Jul,
12
Sep,
12
Nov,
12
Jan,
13
Mar,
13
May,
13
Jul,
13
Sep,
13
Nov,
13
Jan,
14
Mar,
14
May,
14
Jul,
14
Sep,
14
Nov,
14
Average Days on Market (Edmonton)
3. - Alberta Economic Indicators -
*the accuracy of the following information is based on current available data from: http://economicdashboard.albertacanada.com/ and RBC Economic Outlook.
AVERAGE Y/Y% TOTAL
Gross Domestic Product 3.90% 5.41% Net Migration No Data No
(Year 2013 to 2014) #REF! Data
Housing starts
September to November
Y/Y%
Unemployment rate 4.50% 0.00% 6,857 27.41%
Average Weekly Earnings $1,157.21 3.02% Building permits 1,615,867,000 6.00%
16.00%
in Alberta 26,662
in Canada 172,069 13.47% WCS Oil Price (WTI) $88.81 US/bbl -11.40% Vehicle Sales
6%
5%
4%
3%
2%
1%
0%
2011 2012 2013 2014F 2015F
Y/Y Growth (%)
Alberta's GDP Compared to Canada (Year / Year)
Canada AB
5.50%
4.60% 4.60% 4.50%
3.90%
7.20% 7.10% 6.90%
6.60%
0
0
0
0
0
0
2011 2012 2013 2014F 2015F
Value
Alberta's Unemployment Rate (%)
Compared to Canada (year / Year)
AB Canada
5000
4000
3000
2000
1000
0
Alberta's Housing Starts
Alberta's Average Weekly Earnings
$692.60 $716.74 $740.61 $782.93 $822.09 $870.57 $922.23 $948.49 $990.78 $1,033.89 $1,070.31 $1,107.75
$1,500
$1,000
$500
$0
2002 2003 2004 2005 2006 2007 2008 2009 2010 2011 2012 2013
6.80% 7.00% 6.90%
2.50%
7.90%
5.20%
3.20% 4.40% 4.10%
10%
8%
6%
4%
2%
0%
2011 2012 2013 2014F 2015F
Y/Y Growth (%)
AB vs CND Retail Sales growth
Canada AB
4. - Canada Economic Indicators -
Statistics for the period between SEPTEMBER, 2014 and NOVEMBER, 2014
*the accuracy of the following information is based on current available data from: http://www.rbc.com/economics/economic-data/pdf/canind.pdf
44%
22%
‐44%
27% 24%
14% 19%
53%
34%
11%
‐12%
44%
60%
40%
20%
0%
‐20%
‐40%
‐60%
Canada Real GDP
Growth Rate (Monthly)
7%
14%
17%
‐25%
‐4%
24%
14%
‐16%
‐5%
23%
‐6%
42%
24%
‐6%
50%
40%
30%
20%
10%
0%
‐10%
‐20%
‐30%
Canada Unemployment
Growth Rate (%)
201.33
194.93
186.67
177.11
190.92
157.43
195.69
195.64
198.29
203.00
196.35
197.36
183.60
250
200
150
100
50
0
Housing Starts
8.58%
9.84%
10.67%
9.54%
9.51%
6.68%
7.77%
7.11%
6.96%
5.22%
5.25%
5.58%
6.83%
12%
10%
8%
6%
4%
2%
0%
Average Housing
Prices (Y/Y %)
‐24%
0%
‐24%
33%
81%
56%
32%
48%
8%
‐16%
0% 8% 8%
100%
80%
60%
40%
20%
0%
‐20%
‐40%
Consumer Price Index (Y/Y %)
0
0
0
0
0
Motor Vehicle Sales
% change
1.04
1.06
1.06
1.11
1.11
1.11
1.10
1.08
1.07
1.09
1.09
1.12
1.13
1.14
120%
115%
110%
105%
100%
95%
Canadian $ to US $
5. 150
100
50
0
600000
500000
400000
300000
200000
100000
The above graph shows that in July 2008 oil was at $133.37 it dropped to a low of $39.09 in Feb of 2009 (71% drop in value).
In July 2008 the average Calgary single family house price was $456,380 and in January 2009 the average price dropped to
$413,049 (9.5% drop in value).
Notes:
Crude oil prices have dropped from $90 to $58.60 in the last 90 days
The TSX S&P has dropped 10.5% in the last 90 days.
Calgary and Edmonton real estate listings are on the rise, while sales are on the decline. (Seasonal impact)
TD Bank estimates CND real estate is 10% overvalued, IMF 10%, Fitch Ratings 20%, The Economist 30%
Bank of Canada is monitoring 3 key factors with relation to the finanical system:
1. Elevated level of household indebtedness
2. Inbalace in the householder market
3. Investor risk taking and illiquidity in financial markets
Other Bank of Canada comments:
Housing prices in Canada have had more growth than income.
Low mortgage rates continue to stimulate the Canadian real estate market.
CND resale of homes has picked up while housing starts have remained declined.
Resources
http://www.rbc.com/economics/economic-data/index.html
http://www.bankofcanada.ca/wp-content/uploads/2014/12/fsr-december2014.pdf
http://economicdashboard.albertacanada.com/
WTI Prices
0
Calgary Single Family Average House Price