1. The Concept
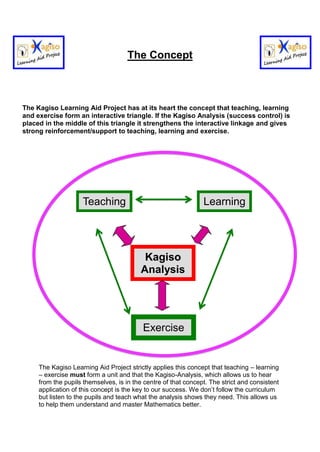
The Kagiso Learning Aid Project strictly applies this concept that teaching – learning
– exercise must form a unit and that the Kagiso-Analysis, which allows us to hear
from the pupils themselves, is in the centre of that concept. The strict and consistent
application of this concept is the key to our success. We don’t follow the curriculum
but listen to the pupils and teach what the analysis shows they need. This allows us
to help them understand and master Mathematics better.
Teaching
Exercise
Learning
Kagiso
Analysis
The Kagiso Learning Aid Project has at its heart the concept that teaching, learning
and exercise form an interactive triangle. If the Kagiso Analysis (success control) is
placed in the middle of this triangle it strengthens the interactive linkage and gives
strong reinforcement/support to teaching, learning and exercise.
2. 2
The Kagiso – Analysis
Tests, assignments and exam papers are usually evaluated in a way which shows us what the
pupil knows. If 11 out of 30 pupils get 80 or more percent the teacher regards this as a good
result. My experience in South Africa while working at different schools with grade 2 to grade 9
showed clearly that the percent achieved by the pupil very seldom reflects the pupil’s abilities
correctly.
Much more important than checking the knowledge of the pupil is finding out what the pupil
does not know. Which questions in a paper could not be answered correctly by how many
pupils? The Kagiso-Analysis is an easy way to find that out.
The Kagiso-Analysis is best done in Excel.
Example of a template: [here restricted to 10 learners and 10 questions.]
Question no 1 2 3 4 5 6 7 8 9 10 total % mistakes
1
2
3
4
5
6
7
8
9
10
total
%
Learners are numbered in alphabetic or any other fixed order. The numbers of the
learners are written in the first row (blue numbers).
The numbers of the questions are written in the left column (red numbers).
3. 3
The tests or papers have to be marked very strictly. The teacher can make own
rules.
[For instance we never give learners only one subtraction problem but at least
three mostly however five. We regard subtraction as understood when more than
50% of the results are correct. We avoid questions where learners can get the
correct answer by mere guessing like in “false or true” questions. We always try to
question in both directions; for instance, we give them 10 numbers and ask to
circle the odd number. But we also ask: “When is a number an odd number?]
This approach makes the composition of a test or assignment an extremely
important but also highly interesting task for the teacher. What questions are
necessary to find out, without any doubts, that the learners have understood and
master the important facts? The Kagiso-Analysis is a helpful tool to answer this
question.
After marking the papers carefully the Kagiso-Analysis can be done. Pupil by pupil
and question by question the wrongly answered questions get a 1 in the
template. In the example given below pupil number 1 could not answer question
number 2, 5, 6 and 9 correctly; pupil number 5 had no mistake.
After filling in the mistakes for all learner and all questions the number of mistakes
for each question is summed from left to right [blue numbers in column total].
In case one want to compare classes with different number of pupils the number
of mistakes has to be given in percent [column % mistakes].
The table below shows the results of a completed Kagiso-Analysis:
Question no 1 2 3 4 5 6 7 8 9 10 total
%
mistakes
1 1 1 10
2 1 1 2 20
3 1 1 1 3 30
4 0 0
5 1 1 1 1 1 1 1 1 5 90
6 1 1 9 20
7 1 1 1 1 1 5 50
8 0 0
9 1 1 1 1 1 1 1 1 8 80
10 1 1 10
total 4 4 2 5 0 5 3 3 2 2
% 60 60 80 50 100 50 70 70 80 80
4. 4
Since the red totals are the mistakes one has to be careful when calculating the
correct result for the pupils in %.
By pressing the graph button the sum or percent of mistakes for each question is
shown in Excel. For this the column must first be highlighted.
The graph clearly shows that question number 5 and 9 could not be answered
correctly even by learners who achieved 80%. If these are crucial questions
showing whether a learner has understood the topic or not, further explanation
and exercise must be done; otherwise a severe knowledge deficit is created and
enforced and will cause problems in higher grades.
Pupils in my class wrote at least one test every day. These tests were evaluated
with the Kagiso-Analysis. The results showed me what I had to do the next day in
class.
The Kagiso-Analysis can be used universally. We have used it in spelling and
grammar as well with great success.
5. 5
On the following two pages I give an example of the Kagiso-Analysis for our LAP-class
grade 4. The teaching topic was fractions, always a problem for pupil.
Below are the first six questions of the test and above is the Kagiso-Analysis for 18 of the
25 pupils. The analysis shows that question number 4 could not be answered by 16 of
the 18 pupils correctly. Without knowing what the denominator stands for, fractions and
even division are not understood.
6. 6
The result of the Kagiso-Analysis can also be shown on a graph.
Prof Dr Dieter J. von Willert
(Founder of the Kagiso Learning Aid Project)
Kagiso - Analysis
0
2
4
6
8
10
12
14
16
18
1 2 3 4 5 6
Number of Question
NumberofMistakes
![2
The Kagiso – Analysis
Tests, assignments and exam papers are usually evaluated in a way which shows us what the
pupil knows. If 11 out of 30 pupils get 80 or more percent the teacher regards this as a good
result. My experience in South Africa while working at different schools with grade 2 to grade 9
showed clearly that the percent achieved by the pupil very seldom reflects the pupil’s abilities
correctly.
Much more important than checking the knowledge of the pupil is finding out what the pupil
does not know. Which questions in a paper could not be answered correctly by how many
pupils? The Kagiso-Analysis is an easy way to find that out.
The Kagiso-Analysis is best done in Excel.
Example of a template: [here restricted to 10 learners and 10 questions.]
Question no 1 2 3 4 5 6 7 8 9 10 total % mistakes
1
2
3
4
5
6
7
8
9
10
total
%
Learners are numbered in alphabetic or any other fixed order. The numbers of the
learners are written in the first row (blue numbers).
The numbers of the questions are written in the left column (red numbers).](data:image/gif;base64,R0lGODlhAQABAIAAAAAAAP///yH5BAEAAAAALAAAAAABAAEAAAIBRAA7)