CBRE Ottawa Office Marketview Q1 2016
•
1 j'aime•153 vues

Strong deal velocity results in early gains for 2016.

Recommandé
Recommandé
Contenu connexe
Dernier
Dernier (20)
En vedette
En vedette (20)
CBRE Ottawa Office Marketview Q1 2016
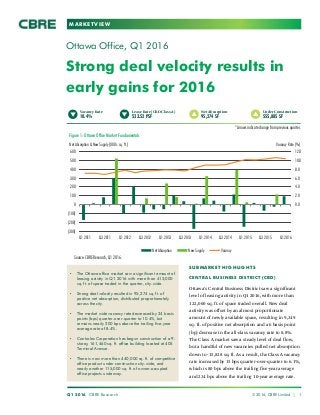
- 1. MARKETVIEW (6.0) (4.0) (2.0) 0.0 2.0 4.0 6.0 8.0 10.0 12.0 (300) (200) (100) 0 100 200 300 400 500 600 Q1 2011 Q3 2011 Q1 2012 Q3 2012 Q1 2013 Q3 2013 Q1 2014 Q3 2014 Q1 2015 Q3 2015 Q1 2016 Vacancy Rate (%)Net Absorption & New Supply (000s sq. ft.) Net Absorption New Supply Vacancy Strong deal velocity results in early gains for 2016 Ottawa Office, Q1 2016 SUBMARKET HIGHLIGHTS CENTRAL BUSINESS DISTRICT (CBD) Ottawa’s Central Business District saw a significant level of leasing activity in Q1 2016, with more than 122,000 sq. ft. of space traded overall. New deal activity was offset by an almost proportionate amount of newly available space, resulting in 9,349 sq. ft. of positive net absorption and a 6 basis point (bp) decrease in the all-class vacancy rate to 8.8%. The Class A market saw a steady level of deal flow, but a handful of new vacancies pulled net absorption down to -15,828 sq. ft. As a result, the Class A vacancy rate increased by 15 bps quarter-over-quarter to 6.1%, which is 80 bps above the trailing five-year average and 234 bps above the trailing 10-year average rate. Q1 2016 CBRE Research © 2016, CBRE Limited | 1 *Arrows indicate change from previous quarter. Figure 1: Ottawa Office Market Fundamentals Net Absorption 95,274 SF Under Construction 555,885 SF • The Ottawa office market saw a significant amount of leasing activity in Q1 2016 with more than 413,000 sq. ft. of space traded in the quarter, city-wide. • Strong deal velocity resulted in 95,274 sq. ft. of positive net absorption, distributed proportionately across the city. • The market wide vacancy rate decreased by 24 basis points (bps) quarter-over-quarter to 10.4%, but remains nearly 200 bps above the trailing five-year average rate of 8.4%. • Controlex Corporation has begun construction of a 9- storey, 161,460 sq. ft. office building located at 405 Terminal Avenue. • There is now more than 440,000 sq. ft. of competitive office product under construction city-wide, and nearly another 115,000 sq. ft. of owner-occupied office projects underway. Lease Rate (CBD Class A) $23.52 PSF Vacancy Rate 10.4% Source: CBRE Research, Q1 2016.
- 2. MARKETVIEW DEEP WEST The Deep West saw a steady level of new deal flow in Q1 2016, with little more than 88,000 sq. ft. of space traded in the quarter, almost exclusively in Kanata. New leasing activity was offset by a number of sizeable pockets of space that came available in the quarter, which resulted in 2,174 sq. ft. of negative net absorption. Most notably, DNA Genotek’s former space at 2 Beaverbrook Drive, totaling 23,544 sq. ft.; 12,865 sq. ft. of space at 1 Hines Road, vacated by TUC Managed IT Solutions; and 11,400 sq. ft. of sublease space offered by Golder Associates at 1931 Robertson Road. The all-class vacancy rate closed the quarter relatively flat at 12.1%, but remains 122 bps below the trailing five-year average rate of 13.3%. In Kanata, the all-class vacancy rate decreased by 31 bps quarter-over-quarter to 13.1%, which is more than 250 bps below the trailing five-year average rate of 15.6%. Two notable lease transactions in the quarter were: firstly, Equiis Technologies’ (formerly known as Article 12 Technologies) subleased 10 Brewer Hunt Way, totaling 17,287 sq. ft.; and secondly, Alion Science and Technology Corporation, leased 10,549 sq. ft. of space at 555 Legget Drive (Tower A). Q1 2016 CBRE Research © 2016, CBRE Limited | 2 OTTAWA OFFICE Both Class B and C markets saw moderate levels of leasing activity and relatively small gains in net absorption. The Class B market registered 4,858 sq. ft. of positive net absorption which resulted in a 10 bp decrease in vacancy to 10.7%. Similarly, the Class C market registered 20,319 sq. ft. of positive net absorption, due in part to the Harris/Decima deal at 123 Slater Street in the previous quarter. At 25.1%, Class C vacancy remains 555 bps above the trailing five-year average and nearly double the 10-year average. Notable vacancies in the CBD include: two full-floors vacated by the National Capital Commission at 40 Elgin Street, totaling 24,624 sq. ft.; a full-floor vacated by Brookfield Renewable Energy Partners at 180 Kent Street, totaling 20,793 sq. ft.; and, another full-floor vacated by Public Services and Procurement Canada at 410 Laurier Avenue. CENTRAL, EXCLUDING THE CBD Outside of the CBD, Ottawa’s fringe-core saw some new deal activity in Q1 2016, registering its first positive result in a year and a half, this time closing the quarter with 12,564 sq. ft. of positive net absorption. As a result, the all-class vacancy rate decreased by 48 bps quarter-over-quarter to 13.8%. (60) (40) (20) 0 20 40 60 CBD Central (excl. CBD) Deep West West South East Class A total: (39,202) Class B total: 104,726 Class C total: 29,750 Figure 2: Net Absorption by Building Class and Submarket (000s sq. ft.) Source: CBRE Research, Q1 2016.
- 3. MARKETVIEW Q1 2016 CBRE Research © 2016, CBRE Limited | 3 OTTAWA OFFICE Figure 3: Notable Lease Transactions Size (SF) Tenant Industry Address Submarket 42,500 Assent Compliance Information Technology 525 Coventry Road East 28,000 Desjardins Group Financial Services 1730 St. Laurent Boulevard East 17,287* Equiis Technologies Inc. Telecommunications 10 Brewer Hunt Way Kanata 13,000 Avaleris Inc. Information Technology 45 O’Connor Street CBD 10,549 Alion Science and Technology Defence & Space 555 Legget Drive – Tower A Kanata 5,500 Kivuto Solutions Inc. Information Technology 126 York Street Lowertown *Sublease Source: CBRE Research, Q1 2016. Figure 4: Notable Sale Transactions Size (SF) Price ($) Address Buyer Submarket 40,000 12,888,000 770 Broadview Avenue Mohawk Medical Properties REIT West 30,000 5,420,000 2283 St. Laurent Boulevard Takol Real Estate South Source: RealTrack, CBRE Research, Q1 2016. EAST Ottawa’s East-end saw a significant amount of leasing activity in Q1 2016, with nearly 78,000 sq. ft. of new deal activity in the quarter. The East-end recorded 22,081 sq. ft. of positive net absorption and a 55 bp decrease in the all-class vacancy rate quarter-over- quarter to 15.6%. Notable lease transactions behind the absorption numbers were: Assent Compliance having signed a phased-in occupancy deal at 525 Coventry Road totaling 42,500 sq. ft.; and Desjardins Group having leased a total of 28,000 sq. ft. at 1730 St. Laurent boulevard. Despite the recent and mainly supply-driven spike in vacancy, Controlex Corporation has begun construction of a 9-storey, 161,460 sq. ft. office building located at 405 Terminal Avenue. Given its proximity to Tremblay Station on Ottawa’s new Confederation Line, the building is well-positioned to generate interest from large user groups. WEST Ottawa’s West-end saw a moderate level of leasing activity in Q1 2016, with nearly 60,000 sq. ft. of space traded in the quarter. Relatively little space came back on the market, resulting in 32,108 sq. ft. of positive net absorption. The all-class vacancy rate declined by 46 bps quarter-over-quarter to 9.1%, but remains more than 190 bps higher than the trailing five-year average rate of 7.2%. SOUTH Ottawa’s South-end saw a moderate level of leasing activity in Q1 2016, with relatively few new availabilities that came to market. The South-end closed the quarter with 21,985 sq. ft. of positive net absorption which resulted in a 68 bp decrease in the all-class vacancy rate quarter-over-quarter. At 6.7%, the all-class vacancy rate is 200 bps below the trailing five-year average and remains the lowest all-class vacancy rate across the city.
- 4. MARKETVIEW Q1 2016 CBRE Research © 2016, CBRE Limited | 4 OTTAWA OFFICE Figure 5: Market Statistics Q1 2016 Submarket Inventory (SF) Vacancy Rate (%) Direct Space (SF) Sublet Space (SF) Net Absorption (SF) New Supply (SF) Under Construction (SF) Avg. Asking Lease Rate ($/SF/annum) CBD 16,085,877 8.8 1,318,574 103,344 9,349 0 0 18.60 Class A 10,082,583 6.1 524,442 94,861 (15,828) 0 0 23.52 Class B 4,893,055 10.7 519,383 5,014 4,858 0 0 16.80 Class C 1,110,239 25.1 274,749 3,469 20,319 0 0 12.60 Central (excl. CBD) 2,600,341 13.8 337,114 21,444 12,564 0 0 16.42 Class A 489,572 25.5 112,557 12,495 (12,495) 0 0 19.86 Class B 1,233,965 12.6 149,483 6,449 8,071 0 0 14.53 Class C 876,804 8.8 75,074 2,500 16,988 0 0 15.03 South 3,244,042 6.7 166,912 50,925 21,985 0 66,176 12.01 Class A 1,229,616 8.0 56,904 41,000 29,291 0 66,176 13.75 Class B 1,795,502 5.6 90,677 9,925 (4,260) 0 0 11.47 Class C 218,924 8.8 19,331 0 (3,046) 0 0 9.43 East 4,714,517 15.6 713,189 22,081 21,442 0 161,460 18.25 Class A 2,476,417 22.4 531,535 22,081 (15,057) 0 161,460 19.95 Class B 1,861,414 9.0 168,175 0 35,749 0 0 13.36 Class C 376,686 3.6 13,479 0 750 0 0 12.02 West 6,924,565 9.1 591,261 38,866 32,108 0 0 15.17 Class A 4,618,667 6.7 303,706 7,581 8,528 0 0 16.76 Class B 1,865,877 14.2 233,108 31,285 27,829 0 0 13.71 Class C 440,021 12.4 54,447 0 (4,249) 0 0 12.51 Deep West* 6,927,403 12.1 771,853 65,712 (2,174) 0 328,249 12.45 Class A 4,916,268 10.2 474,996 28,066 (33,641) 0 328,249 12.88 Class B 1,875,584 17.6 291,690 37,646 32,479 0 0 11.75 Class C 135,551 3.8 5,167 0 (1,012) 0 0 12.00 Overall Total 40,496,745 10.4 3,898,903 302,372 95,274 0 555,885 16.33 *Kanata accounts for 80.0% of total inventory in the Deep West. Source: CBRE Research, Q1 2016.
- 5. MARKETVIEW Disclaimer: Information contained herein, including projections, has been obtained from sources believed to be reliable. While we do not doubt its accuracy, we have not verified it and make no guarantee, warranty or representation about it. It is your responsibility to confirm independently its accuracy and completeness. This information is presented exclusively for use by CBRE Limited clients and professionals and all rights to the material are reserved and cannot be reproduced without prior written permission of CBRE Limited. CONTACTS Shawn Hamilton VP, Managing Director +1 613 782 3092 shawn.hamilton@cbre.com CBRE OFFICES CBRE Limited 333 Preston Street, 7th Floor Ottawa, ON K1S 5N4 Daniel Niedra Research Analyst +1 613 691 2113 daniel.niedra@cbre.com To learn more about CBRE Research, or to access additional research reports, please visit the Global Research Gateway at www.cbre.com/researchgateway. OTTAWA OFFICE