1. OCEANUS • 11
Ground-Truthing
the Paleoclimate Record
Sediment Trap Observations Aid Paleoceanographers
William B. Curry
Chairman, Geology and Geophysics Department
Dorinda R. Ostermann
Research Associate, Geology and Geophysics Department
T
he geological record contains a wealth of
information about Earth’s past environmen-
tal conditions. During its long geological
history the planet has experienced changes in
climate that are much larger than those recorded
during human history; these environmental
conditions range from periods when large ice sheets
covered much of the northern hemisphere, as
recently as 20,000 years ago, to past atmospheric
concentrations of greenhouse gases that warmed
Earth’s polar regions enough to melt all of the ice
caps 50 million years ago. Since human civilization
has developed during a fairly short period of
unusually mild and stable climate, humans have yet
to experience the full range of variability that the
planet’s natural systems impose. Thus, the geologi-
cal record has become an extremely important
archive for understanding the range of natural
variability in climate, the processes that cause
climate change on decadal and longer time scales,
and the background variability from which green-
house warming must be detected.
One of the principal archives of climate informa-
tion is the fossil record in deep sea sediments. For
many years it has been known that seawater
temperature plays an important role in the biogeog-
raphy of many organisms living in the oceans:
Tropical and polar regions foster different species.
Using the fossilized remains of these organisms in
deep sea sediment cores, marine geologists can
reconstruct past changes in sea surface tempera-
ture and produce records that document past
variations in sea surface conditions caused by
changes in the earth-sun orbital geometry and by
abrupt changes in ocean circulation. The major
fossil-producing organisms for this type of research
have been the foraminifera, single-celled animals
with planktonic (floating) and benthonic (bottom-
dwelling) varieties. These organisms produce an
easily identified sand-grain-sized structure made of
calcium carbonate (called a test) that is unique for
each species and is well preserved in sediments
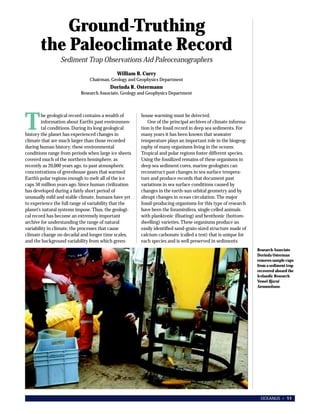
Research Associate
Dorinda Osterman
removes sample cups
from a sediment trap
recovered aboard the
Icelandic Research
Vessel Bjarni
Sæmundsson.
2. 12 • FALL/WINTER 1997
found in nearly all of the major ocean basins.
Early 1980s studies of the geographic occurrence
of the various species of foraminifera suggested that
temperature was a primary control on their distribu-
tion. The observations were based on plankton tows
of the upper water column and the distribution of
fossilized remains in surface sediments of the
seafloor below. The species could easily be grouped
into tropical, subtropical, and polar assemblages
(see figure below), and the parallels with the sea
surface temperature distribution were obvious. By
mapping the distributions of these species, esti-
mates of past sea surface temperatures were made
and paleoceanography was born.
The accuracy of these reconstructions, however,
is difficult to assess because biological systems are
affected by many more environmental variables
than temperature alone and because many of the
environmental factors co-vary. For instance,
salinity and temperature are highly correlated in
the oceans because warmer waters are more likely
to have experienced the evaporation that causes
greater salinity. Without culturing these organisms
in the laboratory (a difficult procedure that has
been successful for only a few
species), it is very hard to
differentiate the effects of
salinity changes from temperature changes. We are
left with finding alternative ways to document their
usefulness as temperature indicators. Using
modern observational systems, including sediment
traps and satellites, we are evaluating the reliability
of foraminifera for temperature estimates under
realistic conditions in today’s oceans.
Sediment traps are suspended on moorings to
sample debris settling through the water column,
debris that includes the fossil remains of plank-
tonic foraminifera. Since sediment traps can collect
time series samples with preprogrammed temporal
resolutions of several weeks to several months,
foraminifers, with several-week life spans, are
ideally suited for collection using these moored
instruments. Indeed, sediment trap samples often
contain foraminiferal abundances implying a
“rainfall” of several hundred to several thousand
individual tests per square meter per day. Joint
Global Ocean Flux (JGOFS) program studies of the
North Atlantic spring plankton bloom, upwelling in
the equatorial Pacific Ocean, the monsoon system
in the Arabian Sea of the Indian Ocean, and the
processes of the southern ocean around Antarctica
provide direct observations of the sensitivity of
foraminifers to sea surface temperature (and other
environmental conditions). They allow us to
“ground truth” foraminiferal abundance variations
for paleoclimate reconstructions.
During the last decade we merged
satellite observations of sea surface
temperature with a global data set of
sediment traps deployed by the
PARFLUX research group at
WHOI led by Susumu Honjo.
PARFLUX sediment trap systems have
been deployed in all of the major oceans basins
(top figure, opposite page) and have sampled the
complete range of temperature observed in the
oceans today. Satellite observations of sea
surface temperature, which are calculated
from infrared radiation emitted from the
sea surface, provide “real-time”
information on changes in surface
water temperatures and allow us
to evaluate the changes in foramin-
iferal abundance in terms of temperature
variations. Using the subset of samples from the
North Atlantic, we have been able to directly
compare foraminiferal abundances and sea
surface temperatures for three of the most
common and useful foraminiferal species
for climate reconstructions.
The relationships between
foraminiferal abundances and
temperature can be dramatic.
For instance, the tropical species
Globigerinoides ruber (named for the pink color
often found in its test) is not found in sediment90° W
60°
30°
0°
0°
30°
60°N
Distribution maps
and scanning
electron microscope
images for three
foraminifers. The
height of each bar
indicates the relative
abundance of the
species as a percent of
the total foraminifer
assemblege.
N. pachyderma (left
coiling) in the top
figure prefers water
colder than 8 degrees
centigrade.
G. bulloides in the
middle figure prefers
waters that are
influenced by the
Gulf Stream.
G. ruber in the
bottom figure
prefers warm
central North
Atlantic water.
Globigerinoides ruber
Neogloboquadrina pachyderma
Globigerina bulloides
Jayne Doucette
3. OCEANUS • 13
trap samples when surface temperatures fall
below 16˚C. When the surface water warms to
23˚C, the species abundances (expressed as the
percentage of the organism in the sample)
increase to a maximum of about 80 percent of the
assemblage. In the PARFLUX North Atlantic data
set, the surface water temperatures never ex-
ceeded 24˚C, so we are not sure of this species’
temperature relationship in warmer waters. For
paleoceanographic usefulness, finding this species
in a sample from a sediment core can immediately
determine that surface waters were warmer than
16˚C; finding it in very high abundances implies
that the surface waters were much warmer. Using
its abundance variations in
the past, we can place
constraints on the surface
water temperatures above
the sediment core at the
time the sediment was
deposited. When the
sediment deposits are
placed within a chronology
using radiocarbon dating,
we can reconstruct the past
variations in temperature,
observe their relationships
to changes in ocean and
atmospheric chemistry, and
determine the rate and
range of natural variations in
the climate system.
In the modern ocean there
are more than 30 species of
planktonic foraminifera, each
with its own tolerance range
of temperature and other
environmental variables. By
using the species together it is
possible to constrain tem-
peratures over the full range
of conditions observed in the oceans today. For
colder water species the relationships with tempera-
ture are just as striking and also have proven
extremely useful. The highest abundance of
Globigerina bulloides, for instance, is generally found
in the mid range of surface water temperatures,
from about 10 to 25˚C, with highest abundances at
about 17˚C. This species is also found in very high
abundance in regions with very high productivity
caused by coastal upwelling, which complicates its
relationship to temperature. For instance, G.
bulloides is in high abundance in Arabian Sea waters
as warm as 24˚C.
The polar bear of planktonic foraminifera,
Neogloboquadrina
pachyderma, is found only in
polar regions and comes in
two forms, differentiated by
its coiling direction. The left-
coiling variety, which runs
counterclockwise when
viewed on its aperture, is
found in greatest abundance
in the coldest waters of the
North Atlantic and is nearly
absent from regions where
surface waters are warmer
than 8˚C. The right-coiling
variety is almost never present
in the colder waters, but
dominates the
N. pachyderma population in
warmer waters. Thus this
coiling direction and abun-
dance change at 8˚C makes
the species especially useful
for tracing the past position of
the 8˚C isotherm. The
location of this isotherm is
closely related to the extent of
deep water convection
Equatorial Pacific, 9 °N – 12 °S
Panama Basin
Bay of Bengal
Arabian Sea
NABE 34 °N
NABE 47 °N
Reykjanes Ridge
Station P
Lofoten Basin
Norwegian Basin
Iceland Plateau
Bear Island
JGOFS – Southern Ocean, 53 °S – 76 °S
Sea of Okhotsk
Fram Strait
Denmark Strait
Norwegian Abyssal Plain
–5 0 5 10 15
Sea Surface Temperature ( °C)
20 25 30 35
All biogenic particles
arriving on the ocean
floor carry a memory
imprint of their
growth environment.
Fossil shells of
foraminifera contain
many clues to the
past oceanic
environment,
including tempera-
ture and salinity
information. The
chart above left shows
the range of sea
surface temperatures
sampled by WHOI
time-series sediment
traps around the
world from less than
-2°C to greater than
32°C. The world
map indicates the
locations of these
sediment traps.
0
10
20
30
40
50
60
70
80
90
100
%G.ruber
0 5 10 15 20 25 30
0
10
20
30
40
50
60
70
80
90
100
%G.bulloides
0 5 10 15 20 25 30
Distribution of G. ruber (percent of total foramini-
fer population) based upon temperature of surface
water obtained by Satellite data. The open circles
are from the JGOFS 47 N sediment trap; closed
circles are from the JGOFS 34 N sediment trap.
Distribution of G. bulloides (percent of total
foraminifer population) based upon temperature of
surface water obtained by satellite data. The open
circles are from the JGOFS 47˚N sediment trap; closed
circles are from the JGOFS 34˚N sediment trap.
JayneDoucetteJayneDoucette
JayneDoucette
4. 14 • FALL/WINTER 1997
-34 -30 -26 -22
0
2,000
4,000
6,000
8,000
10,000
12,000
14,000
16,000
100 80 60 40 20 0
N.pachyderma (left)
(Percent of total Foraminifera)
YearsBeforePresent
Air Temperature over Greenland (˚C)
Air Temperature
N. pachyderma (left)
0.0
0.1
0.2
0.3
0.4
0.5
0.6
0.7
0.8
0.9
1.0
0 5 10 15 20 25 30
%N.pachyderma(left)
0.0
0.1
0.2
0.3
0.4
0.5
0.6
0.7
0.8
0.9
1.0
N.pachy(left)/N.pachy(left/right)
0 5 10 15 20 25 30
8˚ Centigrade
8˚ Centigrade
N. pachyderma (left)
N. pachyderma (right)
Air temperature over Greenland (based on ice
core isotopic measurements) and sea surface
variability in the North Atlantic (based on left-
coiling N. pachyderma percentages). The
covariation of the records implies that variations
in the circulation of the North Atlantic are
strongly linked to temperatures in the region.
occurring in the North Atlantic (see Oceans and
Climate issue of Oceanus, Vol. 39, No. 2).
Past variations in the abundance of
N. pachyderma have documented that ocean
circulation is closely linked to the rapid changes in
climate observed throughout much of the last
glacial interval on earth and
that many of these rapid
oscillations in climate occur
on time scales as short as
several decades. Oscillations
in N. pachyderma abundance
document large geographic
swings in the position of the
sea surface temperature
fronts in the North Atlantic
Ocean, swings that are
apparently synchronous with
large, rapid changes in air
temperature (fluctuations of
more than 12˚C in several
decades) as recorded by
changes in the chemistry of
ice in cores extracted from
the Greenland ice sheet.
These fluctuations in
N. pachyderma abundance
document the incursions of
warm salty waters into the
high latitude regions where
deep water production
occurs. Cooling of this salty
water increases its density,
causing it to sink and form
deep water that flows
southward at depth. This
process releases heat from
the surface water, causing
The top panel shows
distribution of
Neogloboquadrina
pachyderma (left
coiling) as a percent
of total foraminifer
population based on
surface water
temperature
obtained from
satellite data.
Abundances of this
species increase in
water below 8˚C. The
lower panel shows an
abrupt change in N.
pachyderma coiling
direction from left to
right when the
surface water warms
above 8˚C.
the North Atlantic region to warm by nearly 5˚C.
The extent to which we understand the link
between climate change and ocean circulation
depends to a great extent on these geological
records because measurements of atmospheric
conditions and oceanic convection are reliable for
only about the last 50 years. Though there are
clearly identifiable links emerging from the
atmospheric and oceanic records for this recent
period, the magnitude of the changes are small
compared to the large amplitude oscillations seen
in the geological record. Likewise, future monitor-
ing of changes in ocean convection and climate
may also be small and will take place on time scales
of 10 years or longer, thus making it difficult to
identify the causes of the changes. Adding the
larger, more dramatic changes seen in the geologi-
cal record to the history of ocean circulation will
help to constrain the factors that cause alterations
in ocean circulation and increase our chances for
improved prediction of future climate. But our
geological reconstructions will only be a good as
our understanding of the ecological factors
governing today’s biota.
This research was supported by the National Science
Foundation and the Office of Naval Research. In addition, the
authors are indebted to the
government of Iceland and the
Marine Research Institute in
Reykjavik for their help in
maintaining several sediment trap
mooring stations near Iceland.
Particular thanks goes to Jón
Ólafsson for his continued support
and collaboration.
Bill Curry and Rindy Ostermann first
met in February of 1980 on the
Caribbean Island of Roatan. Bill was
joining the crew of Sea Education
Association’s sailing vessel
Westward for a two week stint as
visiting scientist. Rindy had been on
board for four months as a staff
scientist and notes that Bill’s
midwinter Cape Cod complexion
was quite striking next to the tans of
the seasoned crew aboard
Westward. Bill hoisted himself over
the rail and headed for Rindy at the
bow where he delivered a hug and a
kiss from mutual friends in Woods
Hole. Thus began a working
relationship between the two that
continues to this day. Bill is currently
in the middle of a four-year term as
Geology & Geophysics Department
Chair. Rindy runs Bill’s lab and the
Micropaleontology Mass Spectrom-
eter for a group of five scientists. She
calculates that she has spent more
than five years of her life at sea
collecting the samples discussed in
this article.
JudyLeonard
JayneDoucette
DatacourtesyScottLehmanandLloydKeigwin,1992
JayneDoucette