SlideShare une entreprise Scribd logo
1  sur  61
UV-VISIBLE SPECTROSCOPY
DR. BASAVARAJAIAH S. M.
M. SC., PH.D.
ASSISTANT PROFESSOR AND COORDINATOR
PG DEPARTMENT OF CHEMISTRY
VIJAYA COLLEGE
BENGALURU-560 004
Contents:
1. Introduction
2. Instrumentation
3. Classification of electronic transitions
4. Substituent and solvent effects
5. Applications of UV Spectroscopy
6. UV spectral study of alkenes
7. UV spectral study of poylenes
8. UV spectral study of α, β-unsaturated carbonyl
9. UV spectral study of Aromatic compounds
10. Empirical rules for calculating λmax.
•The term "spectroscopy" defines a large number of techniques
that use radiation to obtain information on the structure and
properties of matter.
•The basic principle shared by all spectroscopic techniques is to
shine a beam of electromagnetic radiation onto a sample, and
observe how it responds to such stimulus.
•The response is usually recorded as a function of radiation
wavelength.
•A plot of the response as a function of wavelength is referred to
as a spectrum.
INTRODUCTION
THE ELECTROMAGNETIC SPECTRUM
Important: As the wavelength gets shorter, the energy of
the radiation increases.
1. Electromagnetic radiation displays the properties of
both particles and waves
2. The particle component is called a photon
3. The energy (E) component of a photon is proportional
to the frequency . Where h is Planck’s constant and υ is
the frequency in Hertz (cycles per second)
E = hν
4. The term “photon” is implied to mean a small, massless
particle that contains a small wave-packet of EM
radiation/light.
Ultraviolet radiation stimulates molecular vibrations and
electronic transitions.
Absorption spectroscopy from 160 nm to 780 nm.
Measurement absorption or transmittance.
Identification of inorganic and organic species.
UV-Vis Spectroscopy
UV/VIS SPECTROSCOPY
Visible (380-780 nanometers).
Ultraviolet (UV) (10 – 380 nanometers).
Below 200 nm, air absorbs the UV light and instruments must be
operated under a vacuum
Principle of UV-Visible Spectroscopy
•UV spectroscopy is type of absorption spectroscopy in which light
of ultra-violet region (200-400 nm) is absorbed by the molecule
which results in the excitation of the electrons from the ground
state to higher energy state.
•Molecules containing π-electrons or non-bonding electrons (n-
electrons) can absorb energy in the form of ultraviolet light to
excite these electrons to higher anti-bonding molecular orbital's.
•The absorption of ultraviolet light by a chemical compound will
produce a distinct spectrum which aids in the identification of the
compound.
INSTRUMENTATION
Light Source:
•Tungsten filament lamps and Hydrogen-Deuterium lamps are
most widely used and suitable light source as they cover the
whole UV region.
•Tungsten filament lamps are rich in red radiations; more
specifically they emit the radiations of 375 nm, while the intensity
of Hydrogen-Deuterium lamps falls below 375 nm.
Note: Most of the spectrophotometers are double beam spectrophotometers.
Monochromator:
•Monochromators generally is composed of prisms and slits.
•The radiation emitted from the primary source is dispersed with the
help of rotating prisms.
•The various wavelengths of the light source which are separated by
the prism are then selected by the slits such the rotation of the prism
results in a series of continuously increasing wavelength to pass
through the slits for recording purpose.
•The beam selected by the slit is monochromatic and further divided
into two beams with the help of another prism.
Sample and reference cells:
•One of the two divided beams is passed through the sample solution and
second beam is passed through the reference solution.
•Both sample and reference solution are contained in the cells.
•These cells are made of either silica or quartz. Glass can’t be used for the
cells as it also absorbs light in the UV region.
Detector:
•Generally two photocells serve the purpose of detector in UV spectroscopy.
•One of the photocell receives the beam from sample cell and second
detector receives the beam from the reference.
•The intensity of the radiation from the reference cell is stronger than the
beam of sample cell. This results in the generation of pulsating or alternating
currents in the photocells.
Amplifier:
•The alternating current generated in the photocells is transferred to
the amplifier.
•The amplifier is coupled to a small servometer.
•Generally current generated in the photocells is of very low
intensity, the main purpose of amplifier is to amplify the signals
many times so we can get clear and recordable signals.
Recording devices:
•Most of the time amplifier is coupled to a pen recorder which is
connected to the computer.
•Computer stores all the data generated and produces the spectrum
of the desired compound.
Electronic transitions
The absorption of UV or visible radiation corresponds to the
excitation of outer electrons. There are three types of electronic
transition which can be considered;
•Transitions involving π, σ, and n electrons
•Transitions involving charge-transfer electrons
•Transitions involving d and f electrons (not covered in this Unit)
CLASSIFICATION OF ELECTRONIC TRANSITIONS
•When an atom or molecule absorbs energy, electrons are promoted
from their ground state to an excited state.
•In a molecule, the atoms can rotate and vibrate with respect to each
other.
•These vibrations and rotations also have discrete energy levels, which
can be considered as being packed on top of each electronic level.
Possible electronic transitions of π, σ, and n electrons are;
σ σ* Transitions:
An electron in a bonding s orbital is excited to the corresponding
antibonding orbital. The energy required is large. For example, methane
(which has only C-H bonds, and can only undergo σσ* transitions)
shows an absorbance maximum at 125 nm. Absorption maxima due
to σσ* transitions are not seen in typical UV-Vis. spectra (200 - 700 nm).
nσ* Transitions:
Saturated compounds containing atoms with lone pairs (non-bonding
electrons) are capable of nσ* transitions. These transitions usually need
less energy than nσ* transitions. They can be initiated by light whose
wavelength is in the range 150 - 250 nm. The number of organic functional
groups with nσ* peaks in the UV region is small.
n π* and ππ* Transitions:
Most absorption spectroscopy of organic compounds is based on
transitions of n or π electrons to the π* excited state. This is
because the absorption peaks for these transitions fall in an
experimentally convenient region of the spectrum (200 - 700 nm).
These transitions need an unsaturated group in the molecule to
provide the p electrons.
Note: Molar absorbtivities from n π* transitions are relatively
low, and range from 10 to100 L mol-1 cm-1. ππ* transitions
normally give molar absorbtivities between 1000 and 10,000 L
mol-1 cm-1 .
SUBSTITUENT AND SOLVENT EFFECTS
•The solvent in which the absorbing species is dissolved also has an effect on the
spectrum of the species.
•Peaks resulting from nπ* transitions are shifted to shorter wavelengths (blue shift)
with increasing solvent polarity.
•This arises from increased solvation of the lone pair, which lowers the energy of
the n orbital. Often (but not always), the reverse (i.e. red shift) is seen for π
π* transitions.
•This is caused by attractive polarisation forces between the solvent and the
absorber, which lowers the energy levels of both the excited and unexcited states.
•This effect is greater for the excited state, and so the energy difference between the
excited and unexcited states is slightly reduced-resulting in a small red shift. This
effect also influences n π* transitions but is overshadowed by the blue shift
resulting from solvation of lone pairs.
SUBSTITUENT EFFECTS
Auxochromes
1.Bathochromic Shift or Red shift: A shift of an
absorption maximum towards longer wavelength (λ) or
lower energy (E).
2. Hypsochromic Shift or Blue Shift: A shift of an
absorption maximum towards shorter wavelength (λ)
or higher energy (E).
3.Hyperchromic Effect: An effect that results in
increased absorption intensity (ε).
4.Hypochromic Effect: An effect that results in
decreased absorption intensity (ε).
Applications of UV Spectroscopy
Detection of Impurities
•It is one of the best methods for determination of impurities in organic
molecules.
•Additional peaks can be observed due to impurities in the sample and
it can be compared with that of standard raw material.
•By also measuring the absorbance at specific wavelength, the
impurities can be detected.
Structure elucidation of organic compounds
It is useful in the structure elucidation of organic molecules, such as in
detecting the presence or absence of unsaturation, the presence of
hetero atoms.
UV absorption spectroscopy can be used for the quantitative
determination of compounds that absorb UV radiation.
UV absorption spectroscopy can characterize those types of
compounds which absorbs UV radiation thus used in qualitative
determination of compounds. Identification is done by comparing the
absorption spectrum with the spectra of known compounds.
This technique is used to detect the presence or absence of
functional group in the compound. Absence of a band at particular
wavelength regarded as an evidence for absence of particular group.
Kinetics of reaction can also be studied using UV spectroscopy. The
UV radiation is passed through the reaction cell and the absorbance
changes can be observed.
Many drugs are either in the form of raw material or in the form of
formulation. They can be assayed by making a suitable solution of
the drug in a solvent and measuring the absorbance at specific
wavelength.
Molecular weights of compounds can be measured
spectrophotometrically by preparing the suitable derivatives of these
compounds.
UV spectrophotometer may be used as a detector for HPLC.
Again, demonstrates the moieties contributing to absorbance
from 200-800 nm, because π electron functions and atoms
having no bonding valence shell electron pairs.
UV SPECTRAL STUDY OF ALKENES
Influence of conjugation on UV absorption
UV Spectra of 1, 3-Butadiene
UV Spectra of Isoprene
UV Spectra of Polyene
•With increase in the number of double bonds in conjugation, the
values of absorption maximum as well as intensity increase.
λmax = 455 nm
λmax = 471 nm
UV spectra of Carbonyl Compounds
UV Spectra of Aromatic Compounds
UV Spectra of Naphthalene, Anthracene and Tetracene
Empirical Rules for Calculating λmax
Woodward-Fieser Rules for Calculating λmax in Conjugated
Dienes and Trienes
Woodward (1941) formulated a set of empirical rules for
calculating or predicting λmax in conjugated acyclic and six-
membered ring dienes. These rules, modified by Fieser and Scott
on the basis of wide experience with dienes and trienes, are called
Woodward-Fieser rules and are summarized in next Table. First,
we discuss the following terms used in Woodward-Fieser rules.
Homoannular Dienes
•In homoannular dienes, conjugated double bonds are present in the
same ring and having s-cis (cisoid) configuration (s = single bond
joining the two doubly bonded carbon atoms).
•The s-cis configuration causes strain which raises the ground state
energy Ievel of the molecule leaving the high energy excited state
relatively unchanged. Thus, the transition energy is lowered resulting
in the shift of absorption position to a longer wavelength.
In compounds containing both homoanular and heteroannular diene systems, the
calculations are based on the longer wavelength (253 nm), i.e. the homoannular
diene system.
Heteroannular Dienes:
In heteroannular dienes, conjugated double bonds are not present in
the same ring and these have s-trans (transoid) configurations:
Exocyclic Conjugated Double Bonds:
The carbon-carbon double bonds projecting outside a ring are
called exocyclic double bonds. For example
Note that the same double bond may be exocyclic to one ring, while
endocyclic to the other and sometimes the same double bond may be
exocyclic to two rings simultaneously.
Alkyl Substituents and Ring Residues:
Only the alkyl substituents and ring residues attached to the carbon
atoms constituting the conjugated system of the compound are taken
into account. Following examples indicate such carbon atoms by
numbers and the alkyl substituents and ring residues by dotted lines:
Examples:
Base value=253 (homoannular)
4 ring residues =4X5=20
2 exoyclic bond=2X5=10
Thus λmax = 283 nm
Base value=214
(heteroannular)
4 ring residues =4X5=20
1 exoyclic bond=1X5=5
Thus λmax = 239 nm
1. Which of the following alkenes would have the largest λmax?
Fieser-Kuhn rule is used to calculate λmax for Polyenes
According to the Fieser-Kuhn rule the following equation can be
used to solve for the wavelength of maximum absorption λmax and
also maximum absorptivity εmax:
λmax = 114 + 5M + n (48.0 – 1.7 n) – 16.5 Rendo – 10 Rexo
where,
λmax is the wavelength of maximum absorption
M is the number of alkyl substituents / ring residues in the conjugated system
n is the number of conjugated double bonds
Rendo is the number of rings with endocyclic double bonds in the conjugated system
Rexo is the number of rings with exocyclic double bonds in the conjugated system.
εmax = (1.74 x 10⁴) n
where,
εmax is the maximum absorptivity
n is the number of conjugated double bonds
Name of Compound β-Carotene
Base Value 114 nm
M (number of alkyl substituents) 10
n (number of conjugated double bonds) 11
Rendo (number of endocyclic double bonds) 2
Rexo (number of exocyclic double bonds) 0
Substituting in equation
λmax = 114 + 5M + n (48.0 – 1.7 n) – 16.5 Rendo –
10 Rexo
= 114 + 5(10) + 11 (48.0-1.7(11)) – 16.5 (2) – 10
(0)= 114 + 50 + 11 (29.3) – 33 – 0= 114 + 50 +
322.3 – 33
Calc. λmax = 453.30 nm
λmax observed practically 452nm
Calculate εmax using equation:
εmax = (1.74 x 10⁴) n
= (1.74 x 10⁴) 11Calc. εmax= 19.14 x 10⁴
Practically observed εmax 15.2 x 10⁴
Name of Compound all-trans-lycophene
Base Value 114 nm
M (number of alkyl substituents) 8
n (number of conjugated double bonds) 11
Rendo (number of endocyclic double bonds) 0
Rexo (number of exocyclic double bonds) 0
Substituting in equation
λmax = 114 + 5M + n (48.0 – 1.7 n) – 16.5 Rendo – 10
Rexo
= 114 + 5(8) + 11 (48.0-1.7(11)) – 16.5 (0) – 10 (0)=
114 + 40 + 11 (29.3) – 0 – 0= 114 + 40 + 322.3 – 0
Calc. λmax = 476.30 nm
λmax observed practically 474nm
Calculate εmax using equation:
εmax = (1.74 x 10⁴) n
= (1.74 x 10⁴) 11Calc. εmax= 19.14 x 10⁴
Practically observed εmax 18.6 x 10⁴
Name of Compound Retinol
Base Value 114 nm
M (number of alkyl substituents) 5
n (number of conjugated double bonds) 5
Rendo (number of endocyclic double bonds) 1
Rexo (number of exocyclic double bonds) 0
Substituting in equation
λmax = 114 + 5M + n (48.0 – 1.7 n) – 16.5
Rendo – 10 Rexo
= 114 + 5(5) + 5 (48.0-1.7(5)) – 16.5 (1) – 10
(0)
= 114 + 25 + 5 (39.5) – 16.5 – 0
= 114 + 25 + 197.5 – 16.5 – 0
Calc. λmax = 320 nm
λmax observed practically 325 nm
Calculate εmax using equation:
εmax = (1.74 x 10⁴) n
= (1.74 x 10⁴) 5Calc. εmax= 8.7 x 10⁴
Practically observed εmax N/A
Woodward-Fieser Rules for Calculating λmax in
α, β Unsaturated Carbonyl Compounds
•Compounds containing a carbonyl group (C=O) in conjugation with
an ethylenic groups (C=C) are called enones.
•UV spectra of enones are characterized by an intense absorption
band (K-band) due to ππ* transition in the range 215-250 nm (εmax
usually 10,000-20,000) and a weak R-band due to nπ * transition
in 310-330 nm region (εmax usually 10-100).
•Similar to dienes and trienes, there are set rules called Woodward-
Fieser rules for calculating or predicting λmax in α, β -unsaturated
carbonyl compounds (enones).
•These rules first framed by Woodward and modified by Fieser and
by Scott are given in Table.
Examples:
Base value=215
2 β-ring residues=2X12=24
1 exocyclic double bond =1X5=5
Calc. λmax = 244
Base value=202
1 α-substituent=1X10=10
1 β-alkyl substituents= 1X12=12
1 γ- ring residues =1X18=18
1 δ- ring residues = 1X18=18
1 double bond extending conjugation=1 X 30=30
Base value=215
1 β-alkyl substituents= 1X12=12
1 β-ring residues=1X12=12
1 α-OH substituent=1X35=35
Calc. λmax = 274
Base value=195
1 α-substituent=1X10=10
2 β-ring residues=2X12=24
1 exocyclic double bond =1X5=5
Calc. λmax = 234 nm
Woodward-Fieser Rule for benzene and its derivatives
Like Woodward-Fieser rules, Scott formulated a set of rules for
calculating the absorption maximum of the primary absorption
band of aromatic aldehydes, ketones, carboxylic acids and esters.
In the absence of steric hindrance to co-planarity, the calculated
values are within + 5 nm of the observed value.
1. Base values for:
a) ArCOR = 246 nm
b) ArCHO = 250 nm
c) ArCO2H = 230 nm
d) ArCO2R = 230 nm
2. Increment for substituents:
Substituents Ortho
In nm
Meta
In nm
Para
In nm
Alkyl group or ring residue 3 nm 3 nm 10 nm
–OH, –OCH3, –OAlkyl 7 7 25
–O (oxonium) 11 20 78
–Cl 0 0 10
–Br 2 2 15
–NH2 13 13 58
–NHCOCH3 20 20 45
-NHCH3 - - 73
-N(CH3 )2 20 20 85
Base value=246
2 m-OH=2 x 7=14
1 p-OH=1 x 25=25
Calc. λmax = 285 nm
Base value=246
Ring residue at ortho position =1 x 3=3
1 p-OCH3=1 x 25=25
Calc. λmax = 274 nm
Base value=246
2 o-O Alkyl=2 x 7=14
1 m-Cl=1 x 0=0
1 p-OCH3=1 25=25
Calc. λmax = 285 nm
1. Calculate the λ max for the following molecules
O
O
CH3
CH3 O
Cl
CH3 CH3
O
1. 2. 3.
For Practice:
2. Which molecule absorbs at the longest wavelength, 1,3-hexadiene
or 1,4-hexadiene?
3. Why the λmax for the diene (I) is observed at lower nm than (II).
(I) (II)
4. What are the products of these reactions? Would you expect them
to have higher or lower λmax than the starting material?
Spectroscopy Learning Websites
1. http://www.rsc.org/learn-
chemistry/collections/spectroscopy.
2. http://www.rsc.org/learn-
chemistry/resource/res00001041/spectroscopy-videos.
3. http://www.spectroscopyonline.com
4. https://www.khanacademy.org/science/organic-
chemistry/spectroscopy.
5. http://chem.sci.ubu.ac.th/e-learning.
Uv visible spectroscopy

Contenu connexe

Tendances

Theory of IR spectroscopy
Theory of IR spectroscopyTheory of IR spectroscopy
Theory of IR spectroscopychiranjibi68
 
Fluorescence and phosphorescence
Fluorescence and phosphorescenceFluorescence and phosphorescence
Fluorescence and phosphorescenceSamawiaIqbal
 
Uv visible spectroscopy ppt
Uv visible spectroscopy pptUv visible spectroscopy ppt
Uv visible spectroscopy pptAlexa Jacob
 
Flourescence
FlourescenceFlourescence
Flourescencea kh
 
Nmr spectroscopy
Nmr spectroscopyNmr spectroscopy
Nmr spectroscopyAsma Ashraf
 
Infrared spectroscopy
Infrared spectroscopy Infrared spectroscopy
Infrared spectroscopy Prachi Pathak
 
I R spectroscopy & its application
I R spectroscopy & its application I R spectroscopy & its application
I R spectroscopy & its application Amit Agnihotri
 
UV Spectroscopy and Its Applications
UV Spectroscopy  and Its ApplicationsUV Spectroscopy  and Its Applications
UV Spectroscopy and Its ApplicationsVikram Choudhary
 
NMR SPECTROSCOPY
NMR SPECTROSCOPYNMR SPECTROSCOPY
NMR SPECTROSCOPYVidyaNani
 
Coupling vibration in IR(Infra Red) spectroscopy and their significance.
Coupling vibration in IR(Infra Red) spectroscopy and their significance.Coupling vibration in IR(Infra Red) spectroscopy and their significance.
Coupling vibration in IR(Infra Red) spectroscopy and their significance.D.R. Chandravanshi
 
UV visible spectroscopy
UV visible spectroscopyUV visible spectroscopy
UV visible spectroscopyAkshay Patil
 
Ultra violet (UV) spectroscopy, introduction,principle instrumentation,differ...
Ultra violet (UV) spectroscopy, introduction,principle instrumentation,differ...Ultra violet (UV) spectroscopy, introduction,principle instrumentation,differ...
Ultra violet (UV) spectroscopy, introduction,principle instrumentation,differ...mariomS7
 
IR spectroscopy
IR spectroscopyIR spectroscopy
IR spectroscopyArun kumar
 
C-13 NMR Spectroscopy
C-13 NMR SpectroscopyC-13 NMR Spectroscopy
C-13 NMR SpectroscopyMANISHSAHU106
 
Introduction and Principle of IR spectroscopy
Introduction and Principle of IR spectroscopyIntroduction and Principle of IR spectroscopy
Introduction and Principle of IR spectroscopyRajaram Kshetri
 
13C-NMR SPECTROSCOPY
13C-NMR SPECTROSCOPY13C-NMR SPECTROSCOPY
13C-NMR SPECTROSCOPYramanbrar09
 

Tendances (20)

Theory of IR spectroscopy
Theory of IR spectroscopyTheory of IR spectroscopy
Theory of IR spectroscopy
 
Fluorescence and phosphorescence
Fluorescence and phosphorescenceFluorescence and phosphorescence
Fluorescence and phosphorescence
 
Uv visible spectroscopy ppt
Uv visible spectroscopy pptUv visible spectroscopy ppt
Uv visible spectroscopy ppt
 
Flourescence
FlourescenceFlourescence
Flourescence
 
Nmr spectroscopy
Nmr spectroscopyNmr spectroscopy
Nmr spectroscopy
 
Infrared spectroscopy
Infrared spectroscopy Infrared spectroscopy
Infrared spectroscopy
 
FT NMR
FT NMRFT NMR
FT NMR
 
Fluorescence spectrometry
Fluorescence spectrometryFluorescence spectrometry
Fluorescence spectrometry
 
I R spectroscopy & its application
I R spectroscopy & its application I R spectroscopy & its application
I R spectroscopy & its application
 
UV Spectroscopy and Its Applications
UV Spectroscopy  and Its ApplicationsUV Spectroscopy  and Its Applications
UV Spectroscopy and Its Applications
 
NMR SPECTROSCOPY
NMR SPECTROSCOPYNMR SPECTROSCOPY
NMR SPECTROSCOPY
 
Coupling vibration in IR(Infra Red) spectroscopy and their significance.
Coupling vibration in IR(Infra Red) spectroscopy and their significance.Coupling vibration in IR(Infra Red) spectroscopy and their significance.
Coupling vibration in IR(Infra Red) spectroscopy and their significance.
 
UV visible spectroscopy
UV visible spectroscopyUV visible spectroscopy
UV visible spectroscopy
 
Ultra violet (UV) spectroscopy, introduction,principle instrumentation,differ...
Ultra violet (UV) spectroscopy, introduction,principle instrumentation,differ...Ultra violet (UV) spectroscopy, introduction,principle instrumentation,differ...
Ultra violet (UV) spectroscopy, introduction,principle instrumentation,differ...
 
IR spectroscopy
IR spectroscopyIR spectroscopy
IR spectroscopy
 
C-13 NMR Spectroscopy
C-13 NMR SpectroscopyC-13 NMR Spectroscopy
C-13 NMR Spectroscopy
 
NMR applications
NMR applicationsNMR applications
NMR applications
 
Introduction and Principle of IR spectroscopy
Introduction and Principle of IR spectroscopyIntroduction and Principle of IR spectroscopy
Introduction and Principle of IR spectroscopy
 
Infrared spectroscopy
Infrared spectroscopyInfrared spectroscopy
Infrared spectroscopy
 
13C-NMR SPECTROSCOPY
13C-NMR SPECTROSCOPY13C-NMR SPECTROSCOPY
13C-NMR SPECTROSCOPY
 

Similaire à Uv visible spectroscopy

Uv visible spectroscopy
Uv visible spectroscopyUv visible spectroscopy
Uv visible spectroscopygracepaulraj
 
UV Spectrophotometer.pptx
UV Spectrophotometer.pptxUV Spectrophotometer.pptx
UV Spectrophotometer.pptx510Sudha
 
Uv/visible spectroscopy
Uv/visible spectroscopyUv/visible spectroscopy
Uv/visible spectroscopySavitaBhatt2
 
uv spectelectronic transition in the roscopy
uv spectelectronic transition in the roscopyuv spectelectronic transition in the roscopy
uv spectelectronic transition in the roscopyRiyaDas765755
 
Unit 5 Spectroscopic Techniques-converted (1) (1).pdf
Unit 5 Spectroscopic Techniques-converted (1) (1).pdfUnit 5 Spectroscopic Techniques-converted (1) (1).pdf
Unit 5 Spectroscopic Techniques-converted (1) (1).pdfSurajShinde558909
 
uv spectroscopy by HARVINDAR SINGH .M.PHARM PHARMACEUTICS
 uv spectroscopy by HARVINDAR SINGH .M.PHARM PHARMACEUTICS uv spectroscopy by HARVINDAR SINGH .M.PHARM PHARMACEUTICS
uv spectroscopy by HARVINDAR SINGH .M.PHARM PHARMACEUTICSHarevindarsingh
 
UV Spectroscopy 1 (1).ppsx
UV Spectroscopy 1 (1).ppsxUV Spectroscopy 1 (1).ppsx
UV Spectroscopy 1 (1).ppsxAyush Chavhan
 
Ultraviolet and visible spectrophotometer and Its application in pharmaceutic...
Ultraviolet and visible spectrophotometer and Its application in pharmaceutic...Ultraviolet and visible spectrophotometer and Its application in pharmaceutic...
Ultraviolet and visible spectrophotometer and Its application in pharmaceutic...nikhil kadam
 
New ppt of uv visible
New ppt of uv visibleNew ppt of uv visible
New ppt of uv visiblekeshav pai
 
UV-VIS molecular spectroscopy.202004201521035685ranvijay_engg_UV_and_VISIBLE_...
UV-VIS molecular spectroscopy.202004201521035685ranvijay_engg_UV_and_VISIBLE_...UV-VIS molecular spectroscopy.202004201521035685ranvijay_engg_UV_and_VISIBLE_...
UV-VIS molecular spectroscopy.202004201521035685ranvijay_engg_UV_and_VISIBLE_...abusunabakali
 
Chapter 1 ultraviolet Spectroscopy 1.pdf
Chapter 1 ultraviolet Spectroscopy 1.pdfChapter 1 ultraviolet Spectroscopy 1.pdf
Chapter 1 ultraviolet Spectroscopy 1.pdfhend49
 
principle, application and instrumentation of UV- visible Spectrophotometer
principle, application and instrumentation of UV- visible Spectrophotometer  principle, application and instrumentation of UV- visible Spectrophotometer
principle, application and instrumentation of UV- visible Spectrophotometer Ayetenew Abita Desa
 

Similaire à Uv visible spectroscopy (20)

Uv visible spectroscopy
Uv visible spectroscopyUv visible spectroscopy
Uv visible spectroscopy
 
UV Spectrophotometer.pptx
UV Spectrophotometer.pptxUV Spectrophotometer.pptx
UV Spectrophotometer.pptx
 
Uv/visible spectroscopy
Uv/visible spectroscopyUv/visible spectroscopy
Uv/visible spectroscopy
 
Uv
UvUv
Uv
 
uv spectelectronic transition in the roscopy
uv spectelectronic transition in the roscopyuv spectelectronic transition in the roscopy
uv spectelectronic transition in the roscopy
 
UV Spectroscopy
UV Spectroscopy UV Spectroscopy
UV Spectroscopy
 
Unit 5 Spectroscopic Techniques-converted (1) (1).pdf
Unit 5 Spectroscopic Techniques-converted (1) (1).pdfUnit 5 Spectroscopic Techniques-converted (1) (1).pdf
Unit 5 Spectroscopic Techniques-converted (1) (1).pdf
 
uv spectroscopy by HARVINDAR SINGH .M.PHARM PHARMACEUTICS
 uv spectroscopy by HARVINDAR SINGH .M.PHARM PHARMACEUTICS uv spectroscopy by HARVINDAR SINGH .M.PHARM PHARMACEUTICS
uv spectroscopy by HARVINDAR SINGH .M.PHARM PHARMACEUTICS
 
UV Spectroscopy 1 (1).ppsx
UV Spectroscopy 1 (1).ppsxUV Spectroscopy 1 (1).ppsx
UV Spectroscopy 1 (1).ppsx
 
Ultraviolet and visible spectrophotometer and Its application in pharmaceutic...
Ultraviolet and visible spectrophotometer and Its application in pharmaceutic...Ultraviolet and visible spectrophotometer and Its application in pharmaceutic...
Ultraviolet and visible spectrophotometer and Its application in pharmaceutic...
 
New ppt of uv visible
New ppt of uv visibleNew ppt of uv visible
New ppt of uv visible
 
Uv visible spectroscopy
Uv visible spectroscopyUv visible spectroscopy
Uv visible spectroscopy
 
UV-VIS molecular spectroscopy.202004201521035685ranvijay_engg_UV_and_VISIBLE_...
UV-VIS molecular spectroscopy.202004201521035685ranvijay_engg_UV_and_VISIBLE_...UV-VIS molecular spectroscopy.202004201521035685ranvijay_engg_UV_and_VISIBLE_...
UV-VIS molecular spectroscopy.202004201521035685ranvijay_engg_UV_and_VISIBLE_...
 
Chapter 1 ultraviolet Spectroscopy 1.pdf
Chapter 1 ultraviolet Spectroscopy 1.pdfChapter 1 ultraviolet Spectroscopy 1.pdf
Chapter 1 ultraviolet Spectroscopy 1.pdf
 
principle, application and instrumentation of UV- visible Spectrophotometer
principle, application and instrumentation of UV- visible Spectrophotometer  principle, application and instrumentation of UV- visible Spectrophotometer
principle, application and instrumentation of UV- visible Spectrophotometer
 
UV SPECTROSCOPY ppt.pptx
UV SPECTROSCOPY ppt.pptxUV SPECTROSCOPY ppt.pptx
UV SPECTROSCOPY ppt.pptx
 
UV SPECTROSCOPY ppt.pptx
UV SPECTROSCOPY ppt.pptxUV SPECTROSCOPY ppt.pptx
UV SPECTROSCOPY ppt.pptx
 
Uvspectroscopyup
UvspectroscopyupUvspectroscopyup
Uvspectroscopyup
 
SPE.pptx
SPE.pptxSPE.pptx
SPE.pptx
 
UV-VIS.pdf
UV-VIS.pdfUV-VIS.pdf
UV-VIS.pdf
 

Plus de DrBasavarajaiahSm (17)

CHEMDRAW and CHEMSKETCH.pptx
CHEMDRAW and CHEMSKETCH.pptxCHEMDRAW and CHEMSKETCH.pptx
CHEMDRAW and CHEMSKETCH.pptx
 
VITAMIN B12
VITAMIN B12VITAMIN B12
VITAMIN B12
 
Insect Pheromones
Insect PheromonesInsect Pheromones
Insect Pheromones
 
Drug discovery and design
Drug discovery and designDrug discovery and design
Drug discovery and design
 
ANTIBIOTICS
ANTIBIOTICSANTIBIOTICS
ANTIBIOTICS
 
Supercritical Fluid Chromatography
Supercritical Fluid ChromatographySupercritical Fluid Chromatography
Supercritical Fluid Chromatography
 
Chromatography Part-III
Chromatography Part-IIIChromatography Part-III
Chromatography Part-III
 
Chromatography Part-II
Chromatography Part-IIChromatography Part-II
Chromatography Part-II
 
Chromatography Part-I
Chromatography Part-IChromatography Part-I
Chromatography Part-I
 
Mass spectrometry i
Mass spectrometry iMass spectrometry i
Mass spectrometry i
 
Basic Concepts of UV & IR Spectroscopy
Basic Concepts of UV & IR SpectroscopyBasic Concepts of UV & IR Spectroscopy
Basic Concepts of UV & IR Spectroscopy
 
Ir spectroscopy ii
Ir spectroscopy  iiIr spectroscopy  ii
Ir spectroscopy ii
 
Infrared spectroscopy i
Infrared spectroscopy  iInfrared spectroscopy  i
Infrared spectroscopy i
 
Asymmetric synthesis ii
Asymmetric synthesis iiAsymmetric synthesis ii
Asymmetric synthesis ii
 
Asymmetric synthesis i
Asymmetric synthesis  iAsymmetric synthesis  i
Asymmetric synthesis i
 
Symmetry and group theory
Symmetry and group theory Symmetry and group theory
Symmetry and group theory
 
Basic concepts of organic spectroscopy
Basic concepts of organic spectroscopyBasic concepts of organic spectroscopy
Basic concepts of organic spectroscopy
 

Dernier

VIRUSES structure and classification ppt by Dr.Prince C P
VIRUSES structure and classification ppt by Dr.Prince C PVIRUSES structure and classification ppt by Dr.Prince C P
VIRUSES structure and classification ppt by Dr.Prince C PPRINCE C P
 
Nightside clouds and disequilibrium chemistry on the hot Jupiter WASP-43b
Nightside clouds and disequilibrium chemistry on the hot Jupiter WASP-43bNightside clouds and disequilibrium chemistry on the hot Jupiter WASP-43b
Nightside clouds and disequilibrium chemistry on the hot Jupiter WASP-43bSérgio Sacani
 
GBSN - Microbiology (Unit 2)
GBSN - Microbiology (Unit 2)GBSN - Microbiology (Unit 2)
GBSN - Microbiology (Unit 2)Areesha Ahmad
 
Lucknow 💋 Russian Call Girls Lucknow Finest Escorts Service 8923113531 Availa...
Lucknow 💋 Russian Call Girls Lucknow Finest Escorts Service 8923113531 Availa...Lucknow 💋 Russian Call Girls Lucknow Finest Escorts Service 8923113531 Availa...
Lucknow 💋 Russian Call Girls Lucknow Finest Escorts Service 8923113531 Availa...anilsa9823
 
fundamental of entomology all in one topics of entomology
fundamental of entomology all in one topics of entomologyfundamental of entomology all in one topics of entomology
fundamental of entomology all in one topics of entomologyDrAnita Sharma
 
Isotopic evidence of long-lived volcanism on Io
Isotopic evidence of long-lived volcanism on IoIsotopic evidence of long-lived volcanism on Io
Isotopic evidence of long-lived volcanism on IoSérgio Sacani
 
All-domain Anomaly Resolution Office U.S. Department of Defense (U) Case: “Eg...
All-domain Anomaly Resolution Office U.S. Department of Defense (U) Case: “Eg...All-domain Anomaly Resolution Office U.S. Department of Defense (U) Case: “Eg...
All-domain Anomaly Resolution Office U.S. Department of Defense (U) Case: “Eg...Sérgio Sacani
 
Zoology 4th semester series (krishna).pdf
Zoology 4th semester series (krishna).pdfZoology 4th semester series (krishna).pdf
Zoology 4th semester series (krishna).pdfSumit Kumar yadav
 
Chromatin Structure | EUCHROMATIN | HETEROCHROMATIN
Chromatin Structure | EUCHROMATIN | HETEROCHROMATINChromatin Structure | EUCHROMATIN | HETEROCHROMATIN
Chromatin Structure | EUCHROMATIN | HETEROCHROMATINsankalpkumarsahoo174
 
Discovery of an Accretion Streamer and a Slow Wide-angle Outflow around FUOri...
Discovery of an Accretion Streamer and a Slow Wide-angle Outflow around FUOri...Discovery of an Accretion Streamer and a Slow Wide-angle Outflow around FUOri...
Discovery of an Accretion Streamer and a Slow Wide-angle Outflow around FUOri...Sérgio Sacani
 
GBSN - Biochemistry (Unit 1)
GBSN - Biochemistry (Unit 1)GBSN - Biochemistry (Unit 1)
GBSN - Biochemistry (Unit 1)Areesha Ahmad
 
Animal Communication- Auditory and Visual.pptx
Animal Communication- Auditory and Visual.pptxAnimal Communication- Auditory and Visual.pptx
Animal Communication- Auditory and Visual.pptxUmerFayaz5
 
Forensic Biology & Its biological significance.pdf
Forensic Biology & Its biological significance.pdfForensic Biology & Its biological significance.pdf
Forensic Biology & Its biological significance.pdfrohankumarsinghrore1
 
Nanoparticles synthesis and characterization​ ​
Nanoparticles synthesis and characterization​  ​Nanoparticles synthesis and characterization​  ​
Nanoparticles synthesis and characterization​ ​kaibalyasahoo82800
 
GBSN - Microbiology (Unit 1)
GBSN - Microbiology (Unit 1)GBSN - Microbiology (Unit 1)
GBSN - Microbiology (Unit 1)Areesha Ahmad
 
Recombination DNA Technology (Nucleic Acid Hybridization )
Recombination DNA Technology (Nucleic Acid Hybridization )Recombination DNA Technology (Nucleic Acid Hybridization )
Recombination DNA Technology (Nucleic Acid Hybridization )aarthirajkumar25
 
Biopesticide (2).pptx .This slides helps to know the different types of biop...
Biopesticide (2).pptx  .This slides helps to know the different types of biop...Biopesticide (2).pptx  .This slides helps to know the different types of biop...
Biopesticide (2).pptx .This slides helps to know the different types of biop...RohitNehra6
 
9654467111 Call Girls In Raj Nagar Delhi Short 1500 Night 6000
9654467111 Call Girls In Raj Nagar Delhi Short 1500 Night 60009654467111 Call Girls In Raj Nagar Delhi Short 1500 Night 6000
9654467111 Call Girls In Raj Nagar Delhi Short 1500 Night 6000Sapana Sha
 
Botany krishna series 2nd semester Only Mcq type questions
Botany krishna series 2nd semester Only Mcq type questionsBotany krishna series 2nd semester Only Mcq type questions
Botany krishna series 2nd semester Only Mcq type questionsSumit Kumar yadav
 

Dernier (20)

VIRUSES structure and classification ppt by Dr.Prince C P
VIRUSES structure and classification ppt by Dr.Prince C PVIRUSES structure and classification ppt by Dr.Prince C P
VIRUSES structure and classification ppt by Dr.Prince C P
 
Nightside clouds and disequilibrium chemistry on the hot Jupiter WASP-43b
Nightside clouds and disequilibrium chemistry on the hot Jupiter WASP-43bNightside clouds and disequilibrium chemistry on the hot Jupiter WASP-43b
Nightside clouds and disequilibrium chemistry on the hot Jupiter WASP-43b
 
GBSN - Microbiology (Unit 2)
GBSN - Microbiology (Unit 2)GBSN - Microbiology (Unit 2)
GBSN - Microbiology (Unit 2)
 
The Philosophy of Science
The Philosophy of ScienceThe Philosophy of Science
The Philosophy of Science
 
Lucknow 💋 Russian Call Girls Lucknow Finest Escorts Service 8923113531 Availa...
Lucknow 💋 Russian Call Girls Lucknow Finest Escorts Service 8923113531 Availa...Lucknow 💋 Russian Call Girls Lucknow Finest Escorts Service 8923113531 Availa...
Lucknow 💋 Russian Call Girls Lucknow Finest Escorts Service 8923113531 Availa...
 
fundamental of entomology all in one topics of entomology
fundamental of entomology all in one topics of entomologyfundamental of entomology all in one topics of entomology
fundamental of entomology all in one topics of entomology
 
Isotopic evidence of long-lived volcanism on Io
Isotopic evidence of long-lived volcanism on IoIsotopic evidence of long-lived volcanism on Io
Isotopic evidence of long-lived volcanism on Io
 
All-domain Anomaly Resolution Office U.S. Department of Defense (U) Case: “Eg...
All-domain Anomaly Resolution Office U.S. Department of Defense (U) Case: “Eg...All-domain Anomaly Resolution Office U.S. Department of Defense (U) Case: “Eg...
All-domain Anomaly Resolution Office U.S. Department of Defense (U) Case: “Eg...
 
Zoology 4th semester series (krishna).pdf
Zoology 4th semester series (krishna).pdfZoology 4th semester series (krishna).pdf
Zoology 4th semester series (krishna).pdf
 
Chromatin Structure | EUCHROMATIN | HETEROCHROMATIN
Chromatin Structure | EUCHROMATIN | HETEROCHROMATINChromatin Structure | EUCHROMATIN | HETEROCHROMATIN
Chromatin Structure | EUCHROMATIN | HETEROCHROMATIN
 
Discovery of an Accretion Streamer and a Slow Wide-angle Outflow around FUOri...
Discovery of an Accretion Streamer and a Slow Wide-angle Outflow around FUOri...Discovery of an Accretion Streamer and a Slow Wide-angle Outflow around FUOri...
Discovery of an Accretion Streamer and a Slow Wide-angle Outflow around FUOri...
 
GBSN - Biochemistry (Unit 1)
GBSN - Biochemistry (Unit 1)GBSN - Biochemistry (Unit 1)
GBSN - Biochemistry (Unit 1)
 
Animal Communication- Auditory and Visual.pptx
Animal Communication- Auditory and Visual.pptxAnimal Communication- Auditory and Visual.pptx
Animal Communication- Auditory and Visual.pptx
 
Forensic Biology & Its biological significance.pdf
Forensic Biology & Its biological significance.pdfForensic Biology & Its biological significance.pdf
Forensic Biology & Its biological significance.pdf
 
Nanoparticles synthesis and characterization​ ​
Nanoparticles synthesis and characterization​  ​Nanoparticles synthesis and characterization​  ​
Nanoparticles synthesis and characterization​ ​
 
GBSN - Microbiology (Unit 1)
GBSN - Microbiology (Unit 1)GBSN - Microbiology (Unit 1)
GBSN - Microbiology (Unit 1)
 
Recombination DNA Technology (Nucleic Acid Hybridization )
Recombination DNA Technology (Nucleic Acid Hybridization )Recombination DNA Technology (Nucleic Acid Hybridization )
Recombination DNA Technology (Nucleic Acid Hybridization )
 
Biopesticide (2).pptx .This slides helps to know the different types of biop...
Biopesticide (2).pptx  .This slides helps to know the different types of biop...Biopesticide (2).pptx  .This slides helps to know the different types of biop...
Biopesticide (2).pptx .This slides helps to know the different types of biop...
 
9654467111 Call Girls In Raj Nagar Delhi Short 1500 Night 6000
9654467111 Call Girls In Raj Nagar Delhi Short 1500 Night 60009654467111 Call Girls In Raj Nagar Delhi Short 1500 Night 6000
9654467111 Call Girls In Raj Nagar Delhi Short 1500 Night 6000
 
Botany krishna series 2nd semester Only Mcq type questions
Botany krishna series 2nd semester Only Mcq type questionsBotany krishna series 2nd semester Only Mcq type questions
Botany krishna series 2nd semester Only Mcq type questions
 

Uv visible spectroscopy

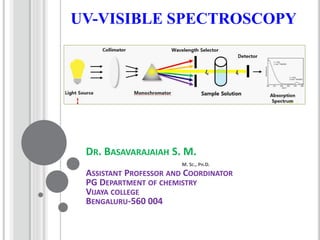
  • 1. UV-VISIBLE SPECTROSCOPY DR. BASAVARAJAIAH S. M. M. SC., PH.D. ASSISTANT PROFESSOR AND COORDINATOR PG DEPARTMENT OF CHEMISTRY VIJAYA COLLEGE BENGALURU-560 004
  • 2. Contents: 1. Introduction 2. Instrumentation 3. Classification of electronic transitions 4. Substituent and solvent effects 5. Applications of UV Spectroscopy 6. UV spectral study of alkenes 7. UV spectral study of poylenes 8. UV spectral study of α, β-unsaturated carbonyl 9. UV spectral study of Aromatic compounds 10. Empirical rules for calculating λmax.
  • 3. •The term "spectroscopy" defines a large number of techniques that use radiation to obtain information on the structure and properties of matter. •The basic principle shared by all spectroscopic techniques is to shine a beam of electromagnetic radiation onto a sample, and observe how it responds to such stimulus. •The response is usually recorded as a function of radiation wavelength. •A plot of the response as a function of wavelength is referred to as a spectrum. INTRODUCTION
  • 4. THE ELECTROMAGNETIC SPECTRUM Important: As the wavelength gets shorter, the energy of the radiation increases.
  • 5. 1. Electromagnetic radiation displays the properties of both particles and waves 2. The particle component is called a photon 3. The energy (E) component of a photon is proportional to the frequency . Where h is Planck’s constant and υ is the frequency in Hertz (cycles per second) E = hν 4. The term “photon” is implied to mean a small, massless particle that contains a small wave-packet of EM radiation/light.
  • 6. Ultraviolet radiation stimulates molecular vibrations and electronic transitions. Absorption spectroscopy from 160 nm to 780 nm. Measurement absorption or transmittance. Identification of inorganic and organic species. UV-Vis Spectroscopy
  • 7. UV/VIS SPECTROSCOPY Visible (380-780 nanometers). Ultraviolet (UV) (10 – 380 nanometers). Below 200 nm, air absorbs the UV light and instruments must be operated under a vacuum
  • 8. Principle of UV-Visible Spectroscopy •UV spectroscopy is type of absorption spectroscopy in which light of ultra-violet region (200-400 nm) is absorbed by the molecule which results in the excitation of the electrons from the ground state to higher energy state. •Molecules containing π-electrons or non-bonding electrons (n- electrons) can absorb energy in the form of ultraviolet light to excite these electrons to higher anti-bonding molecular orbital's. •The absorption of ultraviolet light by a chemical compound will produce a distinct spectrum which aids in the identification of the compound.
  • 9. INSTRUMENTATION Light Source: •Tungsten filament lamps and Hydrogen-Deuterium lamps are most widely used and suitable light source as they cover the whole UV region. •Tungsten filament lamps are rich in red radiations; more specifically they emit the radiations of 375 nm, while the intensity of Hydrogen-Deuterium lamps falls below 375 nm. Note: Most of the spectrophotometers are double beam spectrophotometers.
  • 10. Monochromator: •Monochromators generally is composed of prisms and slits. •The radiation emitted from the primary source is dispersed with the help of rotating prisms. •The various wavelengths of the light source which are separated by the prism are then selected by the slits such the rotation of the prism results in a series of continuously increasing wavelength to pass through the slits for recording purpose. •The beam selected by the slit is monochromatic and further divided into two beams with the help of another prism.
  • 11. Sample and reference cells: •One of the two divided beams is passed through the sample solution and second beam is passed through the reference solution. •Both sample and reference solution are contained in the cells. •These cells are made of either silica or quartz. Glass can’t be used for the cells as it also absorbs light in the UV region. Detector: •Generally two photocells serve the purpose of detector in UV spectroscopy. •One of the photocell receives the beam from sample cell and second detector receives the beam from the reference. •The intensity of the radiation from the reference cell is stronger than the beam of sample cell. This results in the generation of pulsating or alternating currents in the photocells.
  • 12. Amplifier: •The alternating current generated in the photocells is transferred to the amplifier. •The amplifier is coupled to a small servometer. •Generally current generated in the photocells is of very low intensity, the main purpose of amplifier is to amplify the signals many times so we can get clear and recordable signals. Recording devices: •Most of the time amplifier is coupled to a pen recorder which is connected to the computer. •Computer stores all the data generated and produces the spectrum of the desired compound.
  • 13. Electronic transitions The absorption of UV or visible radiation corresponds to the excitation of outer electrons. There are three types of electronic transition which can be considered; •Transitions involving π, σ, and n electrons •Transitions involving charge-transfer electrons •Transitions involving d and f electrons (not covered in this Unit) CLASSIFICATION OF ELECTRONIC TRANSITIONS
  • 14. •When an atom or molecule absorbs energy, electrons are promoted from their ground state to an excited state. •In a molecule, the atoms can rotate and vibrate with respect to each other. •These vibrations and rotations also have discrete energy levels, which can be considered as being packed on top of each electronic level.
  • 15. Possible electronic transitions of π, σ, and n electrons are;
  • 16. σ σ* Transitions: An electron in a bonding s orbital is excited to the corresponding antibonding orbital. The energy required is large. For example, methane (which has only C-H bonds, and can only undergo σσ* transitions) shows an absorbance maximum at 125 nm. Absorption maxima due to σσ* transitions are not seen in typical UV-Vis. spectra (200 - 700 nm). nσ* Transitions: Saturated compounds containing atoms with lone pairs (non-bonding electrons) are capable of nσ* transitions. These transitions usually need less energy than nσ* transitions. They can be initiated by light whose wavelength is in the range 150 - 250 nm. The number of organic functional groups with nσ* peaks in the UV region is small.
  • 17. n π* and ππ* Transitions: Most absorption spectroscopy of organic compounds is based on transitions of n or π electrons to the π* excited state. This is because the absorption peaks for these transitions fall in an experimentally convenient region of the spectrum (200 - 700 nm). These transitions need an unsaturated group in the molecule to provide the p electrons. Note: Molar absorbtivities from n π* transitions are relatively low, and range from 10 to100 L mol-1 cm-1. ππ* transitions normally give molar absorbtivities between 1000 and 10,000 L mol-1 cm-1 .
  • 18. SUBSTITUENT AND SOLVENT EFFECTS •The solvent in which the absorbing species is dissolved also has an effect on the spectrum of the species. •Peaks resulting from nπ* transitions are shifted to shorter wavelengths (blue shift) with increasing solvent polarity. •This arises from increased solvation of the lone pair, which lowers the energy of the n orbital. Often (but not always), the reverse (i.e. red shift) is seen for π π* transitions. •This is caused by attractive polarisation forces between the solvent and the absorber, which lowers the energy levels of both the excited and unexcited states. •This effect is greater for the excited state, and so the energy difference between the excited and unexcited states is slightly reduced-resulting in a small red shift. This effect also influences n π* transitions but is overshadowed by the blue shift resulting from solvation of lone pairs.
  • 21.
  • 22. 1.Bathochromic Shift or Red shift: A shift of an absorption maximum towards longer wavelength (λ) or lower energy (E). 2. Hypsochromic Shift or Blue Shift: A shift of an absorption maximum towards shorter wavelength (λ) or higher energy (E). 3.Hyperchromic Effect: An effect that results in increased absorption intensity (ε). 4.Hypochromic Effect: An effect that results in decreased absorption intensity (ε).
  • 23.
  • 24. Applications of UV Spectroscopy Detection of Impurities •It is one of the best methods for determination of impurities in organic molecules. •Additional peaks can be observed due to impurities in the sample and it can be compared with that of standard raw material. •By also measuring the absorbance at specific wavelength, the impurities can be detected. Structure elucidation of organic compounds It is useful in the structure elucidation of organic molecules, such as in detecting the presence or absence of unsaturation, the presence of hetero atoms.
  • 25. UV absorption spectroscopy can be used for the quantitative determination of compounds that absorb UV radiation. UV absorption spectroscopy can characterize those types of compounds which absorbs UV radiation thus used in qualitative determination of compounds. Identification is done by comparing the absorption spectrum with the spectra of known compounds. This technique is used to detect the presence or absence of functional group in the compound. Absence of a band at particular wavelength regarded as an evidence for absence of particular group. Kinetics of reaction can also be studied using UV spectroscopy. The UV radiation is passed through the reaction cell and the absorbance changes can be observed.
  • 26. Many drugs are either in the form of raw material or in the form of formulation. They can be assayed by making a suitable solution of the drug in a solvent and measuring the absorbance at specific wavelength. Molecular weights of compounds can be measured spectrophotometrically by preparing the suitable derivatives of these compounds. UV spectrophotometer may be used as a detector for HPLC.
  • 27. Again, demonstrates the moieties contributing to absorbance from 200-800 nm, because π electron functions and atoms having no bonding valence shell electron pairs. UV SPECTRAL STUDY OF ALKENES
  • 28. Influence of conjugation on UV absorption
  • 29. UV Spectra of 1, 3-Butadiene
  • 30. UV Spectra of Isoprene
  • 31.
  • 32. UV Spectra of Polyene •With increase in the number of double bonds in conjugation, the values of absorption maximum as well as intensity increase.
  • 33. λmax = 455 nm λmax = 471 nm
  • 34. UV spectra of Carbonyl Compounds
  • 35. UV Spectra of Aromatic Compounds
  • 36. UV Spectra of Naphthalene, Anthracene and Tetracene
  • 37. Empirical Rules for Calculating λmax Woodward-Fieser Rules for Calculating λmax in Conjugated Dienes and Trienes Woodward (1941) formulated a set of empirical rules for calculating or predicting λmax in conjugated acyclic and six- membered ring dienes. These rules, modified by Fieser and Scott on the basis of wide experience with dienes and trienes, are called Woodward-Fieser rules and are summarized in next Table. First, we discuss the following terms used in Woodward-Fieser rules.
  • 38.
  • 39. Homoannular Dienes •In homoannular dienes, conjugated double bonds are present in the same ring and having s-cis (cisoid) configuration (s = single bond joining the two doubly bonded carbon atoms). •The s-cis configuration causes strain which raises the ground state energy Ievel of the molecule leaving the high energy excited state relatively unchanged. Thus, the transition energy is lowered resulting in the shift of absorption position to a longer wavelength. In compounds containing both homoanular and heteroannular diene systems, the calculations are based on the longer wavelength (253 nm), i.e. the homoannular diene system.
  • 40. Heteroannular Dienes: In heteroannular dienes, conjugated double bonds are not present in the same ring and these have s-trans (transoid) configurations: Exocyclic Conjugated Double Bonds: The carbon-carbon double bonds projecting outside a ring are called exocyclic double bonds. For example Note that the same double bond may be exocyclic to one ring, while endocyclic to the other and sometimes the same double bond may be exocyclic to two rings simultaneously.
  • 41. Alkyl Substituents and Ring Residues: Only the alkyl substituents and ring residues attached to the carbon atoms constituting the conjugated system of the compound are taken into account. Following examples indicate such carbon atoms by numbers and the alkyl substituents and ring residues by dotted lines:
  • 43.
  • 44. Base value=253 (homoannular) 4 ring residues =4X5=20 2 exoyclic bond=2X5=10 Thus λmax = 283 nm Base value=214 (heteroannular) 4 ring residues =4X5=20 1 exoyclic bond=1X5=5 Thus λmax = 239 nm 1. Which of the following alkenes would have the largest λmax?
  • 45. Fieser-Kuhn rule is used to calculate λmax for Polyenes According to the Fieser-Kuhn rule the following equation can be used to solve for the wavelength of maximum absorption λmax and also maximum absorptivity εmax: λmax = 114 + 5M + n (48.0 – 1.7 n) – 16.5 Rendo – 10 Rexo where, λmax is the wavelength of maximum absorption M is the number of alkyl substituents / ring residues in the conjugated system n is the number of conjugated double bonds Rendo is the number of rings with endocyclic double bonds in the conjugated system Rexo is the number of rings with exocyclic double bonds in the conjugated system. εmax = (1.74 x 10⁴) n where, εmax is the maximum absorptivity n is the number of conjugated double bonds
  • 46. Name of Compound β-Carotene Base Value 114 nm M (number of alkyl substituents) 10 n (number of conjugated double bonds) 11 Rendo (number of endocyclic double bonds) 2 Rexo (number of exocyclic double bonds) 0 Substituting in equation λmax = 114 + 5M + n (48.0 – 1.7 n) – 16.5 Rendo – 10 Rexo = 114 + 5(10) + 11 (48.0-1.7(11)) – 16.5 (2) – 10 (0)= 114 + 50 + 11 (29.3) – 33 – 0= 114 + 50 + 322.3 – 33 Calc. λmax = 453.30 nm λmax observed practically 452nm Calculate εmax using equation: εmax = (1.74 x 10⁴) n = (1.74 x 10⁴) 11Calc. εmax= 19.14 x 10⁴ Practically observed εmax 15.2 x 10⁴
  • 47. Name of Compound all-trans-lycophene Base Value 114 nm M (number of alkyl substituents) 8 n (number of conjugated double bonds) 11 Rendo (number of endocyclic double bonds) 0 Rexo (number of exocyclic double bonds) 0 Substituting in equation λmax = 114 + 5M + n (48.0 – 1.7 n) – 16.5 Rendo – 10 Rexo = 114 + 5(8) + 11 (48.0-1.7(11)) – 16.5 (0) – 10 (0)= 114 + 40 + 11 (29.3) – 0 – 0= 114 + 40 + 322.3 – 0 Calc. λmax = 476.30 nm λmax observed practically 474nm Calculate εmax using equation: εmax = (1.74 x 10⁴) n = (1.74 x 10⁴) 11Calc. εmax= 19.14 x 10⁴ Practically observed εmax 18.6 x 10⁴
  • 48. Name of Compound Retinol Base Value 114 nm M (number of alkyl substituents) 5 n (number of conjugated double bonds) 5 Rendo (number of endocyclic double bonds) 1 Rexo (number of exocyclic double bonds) 0 Substituting in equation λmax = 114 + 5M + n (48.0 – 1.7 n) – 16.5 Rendo – 10 Rexo = 114 + 5(5) + 5 (48.0-1.7(5)) – 16.5 (1) – 10 (0) = 114 + 25 + 5 (39.5) – 16.5 – 0 = 114 + 25 + 197.5 – 16.5 – 0 Calc. λmax = 320 nm λmax observed practically 325 nm Calculate εmax using equation: εmax = (1.74 x 10⁴) n = (1.74 x 10⁴) 5Calc. εmax= 8.7 x 10⁴ Practically observed εmax N/A
  • 49. Woodward-Fieser Rules for Calculating λmax in α, β Unsaturated Carbonyl Compounds •Compounds containing a carbonyl group (C=O) in conjugation with an ethylenic groups (C=C) are called enones. •UV spectra of enones are characterized by an intense absorption band (K-band) due to ππ* transition in the range 215-250 nm (εmax usually 10,000-20,000) and a weak R-band due to nπ * transition in 310-330 nm region (εmax usually 10-100). •Similar to dienes and trienes, there are set rules called Woodward- Fieser rules for calculating or predicting λmax in α, β -unsaturated carbonyl compounds (enones). •These rules first framed by Woodward and modified by Fieser and by Scott are given in Table.
  • 50.
  • 52. Base value=215 2 β-ring residues=2X12=24 1 exocyclic double bond =1X5=5 Calc. λmax = 244 Base value=202 1 α-substituent=1X10=10 1 β-alkyl substituents= 1X12=12 1 γ- ring residues =1X18=18 1 δ- ring residues = 1X18=18 1 double bond extending conjugation=1 X 30=30
  • 53. Base value=215 1 β-alkyl substituents= 1X12=12 1 β-ring residues=1X12=12 1 α-OH substituent=1X35=35 Calc. λmax = 274 Base value=195 1 α-substituent=1X10=10 2 β-ring residues=2X12=24 1 exocyclic double bond =1X5=5 Calc. λmax = 234 nm
  • 54. Woodward-Fieser Rule for benzene and its derivatives Like Woodward-Fieser rules, Scott formulated a set of rules for calculating the absorption maximum of the primary absorption band of aromatic aldehydes, ketones, carboxylic acids and esters. In the absence of steric hindrance to co-planarity, the calculated values are within + 5 nm of the observed value. 1. Base values for: a) ArCOR = 246 nm b) ArCHO = 250 nm c) ArCO2H = 230 nm d) ArCO2R = 230 nm
  • 55. 2. Increment for substituents: Substituents Ortho In nm Meta In nm Para In nm Alkyl group or ring residue 3 nm 3 nm 10 nm –OH, –OCH3, –OAlkyl 7 7 25 –O (oxonium) 11 20 78 –Cl 0 0 10 –Br 2 2 15 –NH2 13 13 58 –NHCOCH3 20 20 45 -NHCH3 - - 73 -N(CH3 )2 20 20 85
  • 56. Base value=246 2 m-OH=2 x 7=14 1 p-OH=1 x 25=25 Calc. λmax = 285 nm Base value=246 Ring residue at ortho position =1 x 3=3 1 p-OCH3=1 x 25=25 Calc. λmax = 274 nm Base value=246 2 o-O Alkyl=2 x 7=14 1 m-Cl=1 x 0=0 1 p-OCH3=1 25=25 Calc. λmax = 285 nm
  • 57. 1. Calculate the λ max for the following molecules O O CH3 CH3 O Cl CH3 CH3 O 1. 2. 3. For Practice:
  • 58. 2. Which molecule absorbs at the longest wavelength, 1,3-hexadiene or 1,4-hexadiene? 3. Why the λmax for the diene (I) is observed at lower nm than (II). (I) (II)
  • 59. 4. What are the products of these reactions? Would you expect them to have higher or lower λmax than the starting material?
  • 60. Spectroscopy Learning Websites 1. http://www.rsc.org/learn- chemistry/collections/spectroscopy. 2. http://www.rsc.org/learn- chemistry/resource/res00001041/spectroscopy-videos. 3. http://www.spectroscopyonline.com 4. https://www.khanacademy.org/science/organic- chemistry/spectroscopy. 5. http://chem.sci.ubu.ac.th/e-learning.