A new study adds further evidence to suggest that opioid prescribing in the U.S. is skewed and concentrated among a few providers. Researchers looked at prescribing patterns in data from an unspecified national private insurer between 2003-2017.
Around 670,000 providers prescribed more than 8 million standard doses of opioid prescriptions — but more than a quarter of these prescriptions were written by only 1% of physicians. And in 2017, these physicians prescribed nearly half of all the dispensed opioids. This small group of doctors also prescribed higher doses than recommended, and for longer durations than guidelines allow.
What’s encouraging, the authors suggest, is that the vast majority of physicians do seem to follow guidelines. Some caveats: The study was based on one company’s data, and didn’t look at medical reasons behind prescriptions.
Trichy Call Girls Book Now 9630942363 Top Class Trichy Escort Service Available
New study supports notion of skewed opioid prescribing
1. the bmj | BMJ 2020;368:l6968 | doi: 10.1136/bmj.l6968 1
RESEARCH
Opioid prescribing patterns among medical providers in the
United States, 2003-17: retrospective, observational study
Mathew V Kiang,1,2
Keith Humphreys,2,3
Mark R Cullen,1
Sanjay Basu4,5,6
Abstract
OBJECTIVE
To examine the distribution and patterns of opioid
prescribing in the United States.
DESIGN
Retrospective, observational study.
SETTING
National private insurer covering all 50 US states and
Washington DC.
PARTICIPANTS
An annual average of 669 495 providers prescribing
8.9 million opioid prescriptions to 3.9 million patients
from 2003 through 2017.
MAIN OUTCOME MEASURES
Standardized doses of opioids in morphine
milligram equivalents (MMEs) and number of opioid
prescriptions.
RESULTS
In 2017, the top 1% of providers accounted for 49% of
all opioid doses and 27% of all opioid prescriptions.
In absolute terms, the top 1% of providers prescribed
an average of 748 000 MMEs—nearly 1000 times more
than the middle 1%. At least half of all providers in the
top 1% in one year were also in the top 1% in adjacent
years. More than two fifths of all prescriptions written
by the top 1% of providers were for more than 50
MMEs a day and over four fifths were for longer
than seven days. In contrast, prescriptions written
by the bottom 99% of providers were below these
thresholds, with 86% of prescriptions for less than
50 MMEs a day and 71% for fewer than seven days.
Providers prescribing high amounts of opioids and
patients receiving high amounts of opioids persisted
over time, with over half of both appearing in adjacent
years.
CONCLUSIONS
Most prescriptions written by the majority of providers
are under the recommended thresholds, suggesting
that most US providers are careful in their prescribing.
Interventions focusing on this group of providers are
unlikely to effect beneficial change and could induce
unnecessary burden. A large proportion of providers
have established relationships with their patients over
multiple years. Interventions to reduce inappropriate
opioid prescribing should be focused on improving
patient care, management of patients with complex
pain, and reducing comorbidities rather than seeking
to enforce a threshold for prescribing.
Introduction
From 1999 to 2010, opioid prescribing in the US
quadrupled,1
reaching a per capita level well beyond
that of any other nation.2
The effectiveness of long
term opioid treatment for management of chronic pain
is unclear,3 4
but opioids remain an essential tool for
medical providers. Inappropriate opioid prescribing
can lead to diversion of, addiction to, and overdose
from prescription opioids,5-9
contributing to an epi
demic of opioid related deaths in recent years.10
Promoting cautious, scientifically justified, opioid
prescribing has become a leading goal of policy makers
in both government and healthcare.11-14
Strategies to reduce inappropriate opioid prescribing
range from broad policies or guidelines targeted at all
medical providers to narrow interventions focused
on providers prescribing high amounts of opioids.
Broad strategies include improving medical school
education curriculums and compulsory education
of providers,15
mandating the use of state level
prescription drug monitoring programs, creating
national clinical guidelines,16
and lowering the
default opioid dose in electronic health records.17-20
Targeted interventions typically focus on providers
who prescribe opioids above a specified threshold. A
common targeted intervention is the creation of “pill
mill” laws, which typically require documentation of
medical examinations and follow-up visits before and
after the prescribing of opioids, mandatory registration
of clinics with the state, or physician ownership of pain
clinics.21-25
Targeted interventions do not require new laws. For
example, one national pharmacy chain identified 42
providers, out of nearly one million, who prescribed
excessive levels of opioids (eg, 98th centile for volume,
95th centile for proportion, and had a high number of
patients who paid cash) and requested documentation
justifying their level of prescribing. Of the 42 providers
contacted, only six responded with medically justified
reasons. The remaining 36 who did not respond or did
1
Center for Population Health
Sciences, Stanford University
School of Medicine, 1701 Page
Mill Road, Palo Alto, CA 94304,
USA
2
Department of Psychiatry and
Behavioral Sciences, Stanford
University School of Medicine,
Palo Alto, CA, USA
3
Palo Alto VA Health Care
System, Palo Alto, CA, USA
4
Center for Primary Care,
Harvard Medical School,
Boston, MA, USA
5
Research and Analytics,
Collective Health, San Francisco,
CA, USA
6
School of Public Health,
Imperial College, London, UK
Correspondence to: M V Kiang
mkiang@stanford.edu
(or @mathewkiang on Twitter:
ORCID 0000-0001-9198-150X)
Additional material is published
online only. To view please visit
the journal online.
Cite this as: BMJ2020;368:l6968
http://dx.doi.org/10.1136/bmj.l6968
Accepted: 3 December 2019
WHAT IS ALREADY KNOWN ON THIS TOPIC
Opioid prescribing remains far higher in the US than in other countries, despite
efforts to reduce inappropriate opioid prescribing
Previous studies have noted that opioid prescribing in the US is skewed;
however, the extent of this skewness in a geographically diverse and
demographically representative population has not been well established
WHAT THIS STUDY ADDS
This study found that about 1% of providers account for nearly half of all opioid
doses and one quarter of all opioid prescriptions
The results suggest that rather than impose rigid thresholds on most providers,
who generally prescribe opioids safely, interventions should focus on the top 1%
of providers and their patients
The results also suggest that interventions should focus on improving patient
care, managing patients with complex pain, and reducing comorbidities
on4February2020byguest.Protectedbycopyright.http://www.bmj.com/BMJ:firstpublishedas10.1136/bmj.l6968on29January2020.Downloadedfrom
2. RESEARCH
2 doi: 10.1136/bmj.l6968 | BMJ 2020;368:l6968 | the bmj
not provide justification were no longer allowed to have
their prescriptions filled at this national pharmacy
chain.26
Alternatively, “light touch” interventions have
been proposed, such as sending letters to providers
whose prescribing patterns are higher than those
of their peers27
or notifying those providers whose
patients have had a fatal overdose.28
Both broad strategies and targeted interventions
are important for reducing inappropriate prescribing.
However, effective opioid prescribing is nuanced,
pain management is often complex, and there can be
legitimate clinical reasons for a provider prescribing
opioids in excess of recommended thresholds.
Strategies to reduce prescribing can result in un
intended consequences, such as misapplication,
which could result in poor care or sudden involuntary
discontinuation of opioids.29
Further, institutions and
agencies responsible for enforcing or implementing
these strategies may have limited resources and require
additional information to prioritize strategies.
For these reasons, data driven policy demands a
careful examination of opioid prescribing patterns over
a broader range of time, geography, and population.
Previous studies directly examining the distribution
of opioid prescriptions among providers have
been limited to geographically or demographically
narrow samples of providers or patients, over shorter
periods.30 31
This study seeks to fill these gaps, provide
clarity to policy makers, and assist institutions
with efforts to prioritize reduction. We examined a
repository of prescription claims from a large, national
insurance provider covering more than 60 million
unique individuals from 2003 to 2017. The insured
population includes all 50 US states and Washington
DC and is of similar age and sex to the US general
population. Using these data, we identified whether
opioids are roughly equally prescribed across US
medical providers or disproportionately prescribed by
a small subset of providers, how prescribing patterns
have changed over time, the extent to which top
prescribers and top receiving patients persisted over
time, and the relationship between high prescribing
and top receiving patients.
Methods
Data
From a total of 2.5 billion outpatient prescription
claims, we identified 134 million opioid prescriptions
in the Optum Clinformatics Data Mart Database
(Optum; 2003-17), a large deidentified database from a
national private insurance provider. Prescriptions that
were filled but not dispensed (that is, not received by
the patient) were excluded from the analysis to prevent
double counting, which might happen, for example, if
a prescription was transferred to, and dispensed by, a
different pharmacy. Prescription level data included
hashed patient identifiers, hashed provider identifiers
(thatis,DrugEnforcementAgencyandNationalProvider
Identifier), National Drug Code, quantity, number of
days of supply, and date of transaction. In addition, we
used the member, provider, and outpatient diagnostic
files from 2003 to 2017. An Optum affiliate company
assigns providers into one of 7106 categories, which
are grouped into 308 specialties. We merged provider
specialtiesinto16larger,mutuallyexclusivecategories:
addiction medicine, anesthesiology, surgery, critical
care, dentistry, emergency medicine, family medicine,
general medicine, hospice care, internal medicine,
obstetrics/gynecology, pediatrics, physical or pain
medicine and rehabilitation, pharmacy, unknown, and
all others. For female enrollees the median age was 34
years (50.5%, interquartile range 19-52 years) and for
male enrollees 33 years (49.5%, 18-49 years). The age
and sex distribution of enrollees in the Optum database
closely resembles that of the general US population
(supplementary table S1).
Defining drugs of interest
We followed US Centers for Disease Control and
Prevention (CDC) recommendations when selecting
the most appropriate opioids for our analysis.32
Specifically, we excluded buprenorphine products
prescribed as treatment for opioid use disorder, drugs
typically not used in outpatient settings (eg, fentanyl in
solution), cough and cold formulations, and injectable
or intravenous opioids.
As with any system, some unequal distribution
is expected,33
due, for example, to differences in
provider preferences,34
provider location,35
provider
specialties,36 37
or provider perceptions.38
Thus to
facilitate comparison, we tabulated eight benzo
diazepines used to treat anxiety, panic disorder,
seizures, alcohol withdrawal symptoms, and muscle
spasms: alprazolam, chlordiazepoxide, clonazepam,
diazepam, lorazepam, oxazepam, temazepam, and
triazolam. Similar to opioids, benzodiazepines have
highly variable prescribing patterns and a wide range
of doses and therapeutic uses, including episodic use.
A full list of National Drug Codes for each drug can be
found in the online code repository (see supplementary
materials section 1).
Quantities of interest
We estimated two primary quantities of interest for
each drug and year, for each provider: dose and
number of prescriptions. In addition, we estimated
three secondary quantities of interest: daily dose,
dose for each patient, and dose for each prescription.
Opioid doses were standardized to morphine milligram
equivalents (MMEs) using National Drug Code specific
conversion factors.32
Benzodiazepine doses were
standardized to lorazepam milligram equivalents.39-43
Dose was calculated as the quantity×drug stre
ngth×conversion factor. For each provider, we took the
total number of opioid or benzodiazepine prescriptions
across all patients. The daily dose was calculated as
the dose divided by the number of days supply for each
prescription. The dose for each patient was calculated
as the total dose divided by the number of unique
patients who received an opioid or benzodiazepine
prescription from each provider separately (that is, a
patient receiving multiple opioid prescriptions from
on4February2020byguest.Protectedbycopyright.http://www.bmj.com/BMJ:firstpublishedas10.1136/bmj.l6968on29January2020.Downloadedfrom
3. RESEARCH
the bmj | BMJ 2020;368:l6968 | doi: 10.1136/bmj.l6968 3
multiple providers counts as one unique patient
for each provider). The dose for each prescription
was calculated as the total dose divided by the total
number of opioid or benzodiazepine prescriptions for
each provider.
Estimating disproportionate levels of quantities of
interest
To describe the distribution of the above quantities
of interest, we partitioned providers, patients, and
provider-patient pairs with at least one opioid pre
scription into 100 equally sized groups. The groups
were separated according to centiles of the volume
of opioids prescribed, received, and transacted,
respectively. We then compared the prescribing
patterns of the top centile group of providers (that
is, top 1% of providers) with the median (50th)
centile group. Additionally, we quantified the entire
distribution of prescribing using the Gini coefficient—a
formal summary measure of global inequality.44 45
Supplementary materials section 2 presents the Gini
coefficient results.
Defining recent primary diagnoses and previous
diagnosis of malignant cancer
For the top centile of patients, we tabulated the recent
primary diagnoses of their visits to the provider. In the
Optum dataset, patient prescriptions and diagnoses
are not directly linked. Therefore, we conservatively
defined a recent primary diagnosis as any primary
diagnosis that occurred in the same year or in the year
before a patient appeared in the top centile of patients
receiving opioids. We collapsed these recent primary
diagnosis ICD-9 and ICD-10 codes (international
classification of diseases, ninth and 10th revisions,
respectively) into general medical categories using
the Clinical Classifications Software to ICD crosswalk
provided by the Agency for Healthcare Research
and Quality.46
We defined a previous diagnosis of
malignant cancer as the presence of an ICD code
for any malignant cancer in the current year or any
previous year in which the patient appeared in the top
centile of patients receiving opioids (supplementary
materials section 3). This definition conservatively
includes cancers in remission.
Sensitivity analyses
We conducted several sensitivity analyses. To test
the robustness of our results to miscoding or extreme
prescribing outliers, we repeated our analyses with
different levels of upper truncation. Specifically,
we removed the upper 0.01%, 0.05%, 1.0%, 2.5%,
5.0%, and 10% of prescribers for each year and drug
type. To test the robustness of our results to a high
prevalence of low activity prescribers, we repeated our
analyses with different levels of prescribing activity.
Specifically, we removed all providers who prescribed
fewer than 3, 6, 12, 24, 50, 100, and 200 prescriptions
a year. To test the robustness of our results to the
subset of opioids used, we repeated our analyses
using only opioids designated as schedule 2 under
the Controlled Substances Act. Schedule 2 controlled
substances are drugs with an accepted medical use
but with a high potential for misuse and that could
lead to psychological or physical dependence. To test
the sensitivity of the Gini coefficient, we estimated
several alternative measures of inequality: Ricci-
Schutz, Atkinson, Theil, and generalized entropy
(supplementary materials section 4).47
Finally, in
addition to standardized benzodiazepine and opioid
doses, we analyzed the prescribing patterns for 18
individual drugs, with a range of therapeutic uses
(supplementary materials section 5). In all instances,
our substantive conclusions remained the same.
Results for additional analyses are available using an
interactive results viewer (supplementary materials
section 6).
Patient and public involvement
No patients were involved in setting the research
question or the outcome measures, nor were they
involved in developing plans for design or imple
mentation of the study. No patients were asked to
advise about interpretation or writing up of results.
Results
Disproportionate prescribing patterns
Between 2003 and 2017, an average of 8.2 billion
MMEs were prescribed by 669 495 providers to 3.9
million patients a year (supplementary table S2 and
figs S1 and S2). These prescribing patterns correspond
to an average of more than 700 MMEs daily for each
provider, more than 120 MMEs daily for each patient,
more than 50 MMEs daily for each prescription, and
8.9 million opioid prescriptions a year. These averages,
however, mask highly skewed distributions.
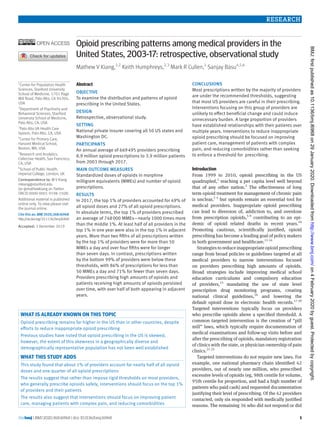
In 2017, the top centile of providers prescribed
49% of all opioid doses and 27% of benzodiazepine
doses (fig 1). The distribution of prescriptions was
comparably disproportionate, with the top centile of
providers accounting for 27% of opioid prescriptions
and 19% of benzodiazepine prescriptions (fig 1). These
disproportionate prescribing patterns persisted after
accounting for prescription length, number of patients
for each provider, and number of prescriptions for each
provider (supplementary materials section 6).
The disproportionately high prescribing of the top
centile of providers has been stable since 2008 (fig
2) and is consistent across states (supplementary figs
S3 and S4). Between 2003 and 2017, the top centile
of providers prescribed between 42% (2005) and 49%
(2008) of opioid doses and accounted for between
18% (2004) and 27% (2017) of all opioid prescriptions
(fig 2). A lower level of disproportionate prescribing
was observed for benzodiazepines. Specifically, the
top centile of providers prescribed between 23%
(2006) and 29% (2008) of benzodiazepine doses
and accounted for between 17% (2006) and 21%
(2008) of all benzodiazepine prescriptions (fig 2).
The type of opioid or benzodiazepine prescribed
by the top centile of providers was similar to that
prescribed by all providers, with the exception of
on4February2020byguest.Protectedbycopyright.http://www.bmj.com/BMJ:firstpublishedas10.1136/bmj.l6968on29January2020.Downloadedfrom
4. RESEARCH
4 doi: 10.1136/bmj.l6968 | BMJ 2020;368:l6968 | the bmj
acetaminophen (paracetamol)/hydrocodone bitar
trate in 2007, which was slightly more commonly
prescribed than oxycodone hydrochloride by the top
centile (supplementary fig S5). For the top centile of
providers, the most commonly prescribed opioid in
each year was oxycodone hydrochloride, and the most
commonly prescribed benzodiazepine was alprazolam
(supplementary fig S5).
In 2017, the top centile of providers prescribed an
average of 748 000 MMEs—nearly 1000 times more
than the median centile group (supplementary figs
S6 and S7). The average amount prescribed by the top
centile of providers in 2017 was double the average
amount prescribed in 2003 (358 000 MMEs; 460 times
higher than the median centile). This pattern was not
seen for benzodiazepines. Specifically, in 2017 the
top centile of providers prescribed 290 times more
benzodiazepines than the median centile compared
with 176 times more in 2003 (supplementary figs
S6 and S7). The high levels of disparity between the
top and median centile groups of opioid prescribers
remained after accounting for differences in pre
scription length, the number of patients for each
provider, and the number of prescriptions for each
provider (supplementary materials section 6).
The 2016 CDC prescribing guidelines for treating
chronic pain recommend that new opioid prescriptions
for treating acute pain should comprise a dose of less
than 50 MMEs a day and a duration of fewer than seven
days (supplementary materials section 7).16
The top
centile of providers remained consistently above these
guidelines, with 42% to 49% of their prescriptions
being a higher dose than recommended. Similarly,
81% to 98% of prescriptions written by the top centile
of providers were for more than seven days. Despite the
disproportionate prescribing of the top centile, most
providersareprescribingwithintheseguidelines.Ineach
year from 2003 to 2017, at least 86% of prescriptions by
the bottom 99% of providers were less than 50 MMEs
a day. Similarly, at least 71% of prescriptions by the
bottom 99% of providers were for fewer than seven days
(supplementary table S3 and fig S8).
Characteristics of the top centile group of providers
and patients
More than half of the top centile of opioid prescribers
areinfamilymedicine(24%),physicalorpainmedicine
and rehabilitation (14%), anesthesiology (14%), or
internal medicine (13%); about one third are classified
as other (17%) or unknown (14%). Physical or pain
medicine and rehabilitation and anesthesiology are
the most over-represented specialties in the top centile,
with each accounting for just 1% of providers across
all centiles. Family medicine and internal medicine
are slightly over-represented in the top centile, and
account for just 13% and 8% of providers, respectively,
across all centiles. Hospice and critical care specialists
accounted for less than 1% of both the top centile
group and across all providers (supplementary fig S9).
Among the top centile of patients receiving opioids,
the most common recent primary diagnostic indication
was a “back problem,” followed by “other connective
tissue disease,” “other aftercare,” “other nervous
system disorders,” and “unclassified” (supplementary
table S4). Less than 20% of patients in the top centile
receiving opioids had any diagnosis of malignant
cancer during the study period (including patients
with cancers currently in remission) (supplementary
table S5).
In 2017, the top centile of patients receiving opioids
was prescribed 2.87 billion MMEs (28% of all opioids
transacted), 70% of which originated from the top
centileofproviders(fig3).Thislevelofdisproportionate
transactions between provider and patient was not
observed for benzodiazepines. Specifically, the top
centile of patients receiving benzodiazepine were
prescribed only 12% of all benzodiazepine doses,
about half of which originated from the top centile of
providers (fig 3). As a result of the disproportionate
prescribing of the top centile, the bottom 90 centiles of
providers accounted for only 12% of opioids transacted
compared with 26% for benzodiazepine. Similarly, as a
result of the highly linked nature of the top centile of
providers and patients, the majority of opioids (72%)
originating from the bottom 90 centiles of providers
were received by the bottom 90 centiles of patients.
The top centile providers, patients, and provider-
patient pairs persisted over time (fig 4). Specifically,
between 54% and 73% of the top of providers in any
year were also in the top centile in the previous year,
with modest reduction in more distant years. The
pattern of high overlap in adjacent years was also
Doses
Proportion
Opioids
Benzodiazepines
0
0.4
0.6
1.0
0.8
0.2
Prescriptions
Top centile of prescribers (cumulative)
Proportion
0 25 50 75 100
0
0.4
0.6
1.0
0.8
0.95
0.67
0.2
0.53
0.99
0.27
0.88
0.78
0.49
Fig 1 | Distribution of standardized doses and prescriptions for opioids and
benzodiazepines across all providers in 2017. Dotted lines show top 1%, 5%, 10%, and
50% of providers for each type of drug along with proportion of opioids distributed by
each of these groups
on4February2020byguest.Protectedbycopyright.http://www.bmj.com/BMJ:firstpublishedas10.1136/bmj.l6968on29January2020.Downloadedfrom
5. RESEARCH
the bmj | BMJ 2020;368:l6968 | doi: 10.1136/bmj.l6968 5
seen, though attenuated, among top centile patients
and provider-patient pairs (fig 4), suggesting that high
opioid prescribing and receiving is stable over time and
the top centile provider-patient pairs have established
associations over multiple years (supplementary figs
S10 and S11).
Discussion
Promotion of cautious, scientifically justified opioid
prescribing is an important public health goal. The
US has started to make progress towards this goal
in recent years.48
Policy makers use broad, tailored
strategies to reduce inappropriate opioid prescribing.
To understand the implications of these strategies,
including unintended consequences, and to prioritize
their implementation, requires a nuanced description
of opioid prescribing patterns. Skewed opioid pre
scribing has been found in previous studies, although
to different extents. One study carried out a smaller
examination of a single state and another, was a
geographically dispersed examination of the older
Medicare Part D population.30 31
Our study extends
these reports by examining a large, national sample
with an age and sex distribution closely resembling
that of the US general population. Additionally, this
study adds detail by examining trends over time
by provider specialty, underlying opioid type, and
provider-patient linkages.
Our results clarify an important medical reality.
Specifically, our results suggest that interventions
targeted at high prescribing opioid providers should
be prioritized for three reasons. First, most of the
prescriptions written by the majority of providers are
below recommended thresholds, suggesting that most
US providers prescribe opioids carefully. Additional,
potentially burdensome, constraints on this set of
providers are unlikely to be beneficial. Because the
majority of opioid prescriptions by this group are
probably appropriate, any increase in restrictions
is more likely to reduce appropriate use rather than
prevent those of concern. Second, the top centile of
providers is stable over time, which suggests that
interventions targeted at this group will produce
sustained results. Third, the top centile of providers
accounts for a disproportionate number of patients
receiving high amounts of opioids , and interventions
targeted here will reach these high risk patients
efficiently.
In addition, our results suggest that interventions
must be nuanced and tailored. More than one
quarter of providers in the top centile specialize in
anesthesiology or physical or pain medicine and
rehabilitation, two specialties in which additional
training in clinically appropriate opioid prescribing
is received. Further, a substantial fraction of the top
centile of provider-patient pairs overlap in adjacent
years, suggesting established relationships over many
years. Extended relationships with patients could
enable providers to have a better understanding of
patients’ needs and a readiness to taper doses. Lastly,
the top centile of patients remains the same over time,
which suggests that interventions based on improving
patient care, management of patients with complex
problems, and reducing comorbidities, rather than
enforced interventions focused on rigid thresholds, are
necessary to reduce demand for opioids.
Limitations of this study
Our analysis has important limitations. First, our data
wereobtainedfromasinglenationalinsurercomprising
mostly employer based, privately insured patients and
may not be fully generalisable to the whole of the US.
Second, the prescription data included only dispensed
prescriptions and not prescriptions that were written
by providers but never received by patients; therefore,
these data represent a potentially biased subset of
provider prescribing patterns. Nevertheless, these data
covered a patient population closely representative of
theageandsexdistributionofthegeneralUSpopulation
(supplementary table S1). Additionally, when our
data were compared with a careful examination of
opioid prescriptions in California, similar results were
found (supplementary fig S12). Third,prescriptions
attributed to one provider could have originated from
care provided by a different provider (for example,
primary care providers carrying out the treatment
plan of a pain clinic). Fourth, opioids are a diverse
set of drugs and standardizing doses into MMEs is
necessary for comparisons; however, MMEs may not
fully reflect the dependence, overdose, or mortality
potential of different opioids. Sensitivity analyses
using only schedule 2 opioids—those considered to
have the highest potential for misuse—nevertheless
Doses
Proportion
Opioids
Benzodiazepines
0
0.4
0.6
1.0
0.8
0.2
Prescriptions
Year
Proportion
2003 2005 2007 2009 2011 2013 2015 2017
0
0.4
0.6
1.0
0.8
0.2
Fig 2 | Proportion of standardized doses and prescriptions prescribed by top 1% of
providers for opioids and benzodiazepines, 2003-17
on4February2020byguest.Protectedbycopyright.http://www.bmj.com/BMJ:firstpublishedas10.1136/bmj.l6968on29January2020.Downloadedfrom
6. RESEARCH
6 doi: 10.1136/bmj.l6968 | BMJ 2020;368:l6968 | the bmj
reached the same substantive conclusions. Similarly,
benzodiazepines are diverse, and conversion factors
for equipotency between different benzodiazepines
have not been well studied. Importantly, our data did
not allow us to assess the clinical appropriateness of
any opioid or benzodiazepine prescription. Lastly,
reducing inappropriate opioid prescribing is a
worthwhile goal in and of itself; however, the opioid
overdose crisis has shifted from prescription opioids
to illicit opioids,10 49
such as heroin and synthetic
opioids, which have mortality rates that are higher than
those of prescription opioids and are increasing more
rapidly. Therefore, the effect of strategies to reduce
inappropriate prescribing on the opioid overdose
crisis at large is probably limited. The recent increase
in deaths from illicit opioids is, in part, an unintended
consequence of reducing the availability of medically
prescribed opioids, which has led some opioid
dependent patients to turn to the illicit marketplace.50
Conclusions and policy implications
Our study shows that in the claims database of a
national private insurer, a small portion of providers
account for a highly disproportionate proportion of
opioids. Further, these providers persist over time and
are often linked with patients receiving high amounts
of opioids. A corollary of this finding is that most of
the prescriptions written by the majority of providers
are below recommended thresholds. Specialties with
additional training in clinically appropriate opioid
prescribing—for example, anesthesiology and physical
or pain management and rehabilitation—are over-
represented in the top centile of opioid prescribing
providers. Lastly, we found that a substantial
proportion of provider-patient pairs are linked over
time. These findings suggest that interventions
promoting careful prescribing should be tailored for,
and targeted at, the top centile of opioid prescribing
providers and focus on providing supportive care of
Opioids
Benzodiazepines
Bottom 90
2nd-10th
1st
Bottom 90
2nd-10th
1st
Bottom 90
2nd-10th
1st
Bottom 90
2nd-10th
1st
0.0
2.5
5.0
7.5
10.0
0.0
0.1
0.2
0.3
0.4
Provider
centile group
Patient
centile group
Standardizeddosestransacted(billions)Standardizeddosestransacted(billions)
Fig 3 | Volume of opioid and benzodiazepine doses transacted between provider and
patient centile groups, 2017
Providers Patients Provider-patient pairs
2009
2008 2010 2012 2014 2016 2008 2010 2012 2014 2016 2008 2010 2012 2014 2016
2011
2013
2015
2017
Year jYear jYear j
Yeari
0.00 0.25 0.50 0.75
Proportion from year i in year j
Fig 4 | Persistence of top centile of providers, patients, and provider-patient pairs over time.
on4February2020byguest.Protectedbycopyright.http://www.bmj.com/BMJ:firstpublishedas10.1136/bmj.l6968on29January2020.Downloadedfrom
7. RESEARCH
the bmj | BMJ 2020;368:l6968 | doi: 10.1136/bmj.l6968 7
patients with complex problems rather than seeking to
enforce a threshold for prescribing.
We thank Lesley Park, Emma Hallgren, Valerie Meausoone, and
Isabella Chu at the Stanford Center for Population Health Sciences
Data Core for technical assistance.
Contributors: MVK and SB conceptualized the paper. MVK analyzed
the data with input from SB. All authors interpreted results. SB and
MRC provided financial support for the data and computational
resources. MVK, SB, and KH wrote the initial draft with all authors
providing critical feedback and edits to subsequent revisions. All
authors approved the final draft of the manuscript. MVK and SB
are the guarantors. The corresponding author attests that all listed
authors meet authorship criteria and that no others meeting the
criteria have been omitted.
Funding: This study did not receive specific funding. MVK is supported
in part by the National Institute on Drug Abuse of the National
Institutes of Health (NIH) (T32 DA035165). MVK and SB were
supported in part by the National Institute on Minority Health and
Health Disparities of the NIH (DP2 MD010478). KH was supported
by a senior research career scientist award from the Veterans Affairs
Health Services Research and Development Service and a grant
from Stanford Neurosciences Institute. Data access was provided by
the Stanford Center for Population Health Sciences Data Core. The
Population Health Sciences Data Core is supported by an NIH national
center for advancing translational science clinical and translational
science award (UL1 TR001085) and internal Stanford funding. The
funders had no role in the study design, data collection and analysis,
decision to publish, or preparation of the manuscript. The content
is solely the responsibility of the authors and does not necessarily
represent the official views of the funders, federal government, or
any current or former employers of the authors. Data and analyses
were conducted at Stanford University under a data use agreement
between Stanford and Optum.
Competing interests: All authors have completed the ICMJE uniform
disclosure form at www.icmje.org/coi_disclosure.pdf and declare:
no support from any organization for the submitted work; SB reports
grants from the US National Institutes of Health, US Department of
Agriculture, and Robert Wood Johnson Foundation, and personal fees
from Collective Health, KPMG, Research Triangle International, PLOS
Medicine, and the New England Journal of Medicine, outside the
submitted work; no financial relationships with any organizations that
might have an interested in the submitted work in the previous three
years; no other relationships or activities that could appear to have
influenced the submitted work.
Ethical approval: This study was approved by the Stanford University
institutional review board (PHS-40974).
Data sharing: Original, prescription level and diagnosis level data
tied to individuals, providers, locations, and time are considered
personally identifiable health information. These data cannot be
shared owing to risks of breaching patient confidentiality. The
authors have posted full reproducible code on the public GitHub
repository associated with this project, such that researchers who
engage in a data use agreement with Optum can use this code to
reproduce or extend the analysis. Aggregated data are available
to the extent allowed by a data use agreement. The repository is
available at https://github.com/mkiang/disproportionate_prescribing
(supplementary materials section 1).
The lead author (MVK) affirms that the manuscript is an honest,
accurate, and transparent account of the study being reported; that
no important aspects of the study have been omitted; and that any
discrepancies from the study as planned have been explained.
Dissemination to participants and related patient and public
communities: There are no plans to disseminate the results of the
research to study participants or the relevant patient community.
This is an Open Access article distributed in accordance with the
Creative Commons Attribution Non Commercial (CC BY-NC 4.0) license,
which permits others to distribute, remix, adapt, build upon this work
non-commercially, and license their derivative works on different
terms, provided the original work is properly cited and the use is non-
commercial. See: http://creativecommons.org/licenses/by-nc/4.0/.
1 Centers for Disease Control and Prevention. Vital Signs: Overdoses
of Prescription Opioid Pain Relievers United States, 1999--2008.
MMWR Morb Mortal Wkly Rep 2011;60:1487-92.
2 Humphreys K. Avoiding globalisation of the prescription opioid
epidemic. Lancet 2017;390:437-9. doi:10.1016/S0140-
6736(17)31918-9
3 Von Korff M, Kolodny A, Deyo RA, Chou R. Long-term opioid therapy
reconsidered. Ann Intern Med 2011;155:325-8. doi:10.7326/0003-
4819-155-5-201109060-00011
4 Chou R, Deyo R, Devine B, et al. The effectiveness and risks of long-
term opioid treatment of chronic pain. Evid Rep Technol Assess (Full
Rep) 2014;218:1-219. doi:10.23970/ahrqepcerta218
5 Kolodny A, Courtwright DT, Hwang CS, et al. The prescription opioid
and heroin crisis: a public health approach to an epidemic of
addiction. Annu Rev Public Health 2015;36:559-74. doi:10.1146/
annurev-publhealth-031914-122957
6 Compton WM, Volkow ND. Abuse of prescription drugs and the
risk of addiction. Drug Alcohol Depend 2006;83(Suppl 1):S4-7.
doi:10.1016/j.drugalcdep.2005.10.020
7 Darnall BD, Stacey BR, Chou R. Medical and psychological risks
and consequences of long-term opioid therapy in women. Pain
Med 2012;13:1181-211. doi:10.1111/j.1526-4637.2012.01467.x
8 Edlund MJ, Martin BC, Russo JE, DeVries A, Braden JB, Sullivan
MD. The role of opioid prescription in incident opioid abuse and
dependence among individuals with chronic noncancer pain: the role
of opioid prescription. Clin J Pain 2014;30:557-64. doi:10.1097/
AJP.0000000000000021
9 Edlund MJ, Sullivan M, Steffick D, Harris KM, Wells KB. Do users of
regularly prescribed opioids have higher rates of substance use
problems than nonusers?Pain Med 2007;8:647-56. doi:10.1111/
j.1526-4637.2006.00200.x
10 Jalal H, Buchanich JM, Roberts MS, Balmert LC, Zhang K, Burke DS.
Changing dynamics of the drug overdose epidemic in the United
States from 1979 through 2016. Science 2018;361:eaau1184.
doi:10.1126/science.aau1184
11 Bohnert ASB, Guy GPJr, Losby JL. Opioid prescribing in the United
States before and after the Centers for Disease Control and
Prevention’s 2016 opioid guideline. Ann Intern Med 2018;169:367-
75. doi:10.7326/M18-1243
12 Lin LA, Bohnert ASB, Kerns RD, Clay MA, Ganoczy D, Ilgen
MA. Impact of the Opioid Safety Initiative on opioid-related
prescribing in veterans. Pain 2017;158:833-9. doi:10.1097/j.
pain.0000000000000837
13 Soelberg CD, Brown REJr, Du Vivier D, Meyer JE, Ramachandran BK.
The US opioid crisis: current federal and state legal issues. Anesth
Analg 2017;125:1675-81. doi:10.1213/ANE.0000000000002403
14 CDC Injury Center. Opioid overdose: CDC guideline for prescribing
opioids for chronic pain. https://www.cdc.gov/drugoverdose/
prescribing/guideline.html. 2019.
15 National Academies of Sciences, Engineering, and Medicine.
Pain management and the opioid epidemic: balancing societal
and individual benefits and risks of prescription opioid use.
Washington, DC: National Academies Press, 2017. https://doi.
org/10.17226/24781.
16 Dowell D, Haegerich TM, Chou R. CDC Guideline for
prescribing opioids for chronic pain--United States, 2016.
JAMA 2016;315:1624-45. doi:10.1001/jama.2016.1464
17 Chiu AS, Jean RA, Hoag JR, Freedman-Weiss M, Healy JM, Pei KY.
Association of lowering default pill counts in electronic medical
record systems with postoperative opioid prescribing. JAMA
Surg 2018;153:1012-9. doi:10.1001/jamasurg.2018.2083
18 Zivin K, White JO, Chao S, et al. Implementing electronic health record
default settings to reduce opioid overprescribing: a pilot study. Pain
Med 2019;20:103-12. doi:10.1093/pm/pnx304
19 Delgado MK, Shofer FS, Patel MS, et al. Association between
electronic medical record implementation of default opioid
prescription quantities and prescribing behavior in two emergency
departments. J Gen Intern Med 2018;33:409-11. doi:10.1007/
s11606-017-4286-5
20 Blutinger EJ, Shofer FS, Meisel Z, Perrone J, Engel-Rebitzer E,
Delgado MK. Variability in emergency department electronic medical
record default opioid quantities: a national survey. Am J Emerg
Med 2019;66:3. doi:10.1016/j.ajem.2019.03.023
21 Chang HY, Murimi I, Faul M, Rutkow L, Alexander GC. Impact of
Florida’s prescription drug monitoring program and pill mill law on
high-risk patients: a comparative interrupted time series analysis.
Pharmacoepidemiol Drug Saf 2018;27:422-9. doi:10.1002/
pds.4404
22 Lyapustina T, Rutkow L, Chang H-Y, et al. Effect of a “pill mill” law on
opioid prescribing and utilization: the case of Texas. Drug Alcohol
Depend 2016;159:190-7. doi:10.1016/j.drugalcdep.2015.12.025
23 Kennedy-Hendricks A, Richey M, McGinty EE, Stuart EA, Barry CL,
Webster DW. Opioid overdose deaths and Florida’s crackdown
on pill mills. Am J Public Health 2016;106:291-7. doi:10.2105/
AJPH.2015.302953
24 Rutkow L, Chang H-Y, Daubresse M, Webster DW, Stuart EA,
Alexander GC. Effect of Florida’s prescription drug monitoring
program and pill mill laws on opioid prescribing and use. JAMA Intern
Med 2015;175:1642-9. doi:10.1001/jamainternmed.2015.3931
25 Chang H-Y, Lyapustina T, Rutkow L, et al. Impact of prescription
drug monitoring programs and pill mill laws on high-risk
on4February2020byguest.Protectedbycopyright.http://www.bmj.com/BMJ:firstpublishedas10.1136/bmj.l6968on29January2020.Downloadedfrom
8. RESEARCH
No commercial reuse: See rights and reprints http://www.bmj.com/permissions Subscribe: http://www.bmj.com/subscribe
opioid prescribers: a comparative interrupted time series
analysis. Drug Alcohol Depend 2016;165:1-8. doi:10.1016/j.
drugalcdep.2016.04.033
26 Betses M, Brennan T. Abusive prescribing of controlled substances-
-a pharmacy view. N Engl J Med 2013;369:989-91. doi:10.1056/
NEJMp1308222
27 Sacarny A, Yokum D, Finkelstein A, Agrawal S. Medicare letters to curb
overprescribing of controlled substances had no detectable effect
on providers. Health Aff (Millwood) 2016;35:471-9. doi:10.1377/
hlthaff.2015.1025
28 Doctor JN, Nguyen A, Lev R, et al. Opioid prescribing decreases after
learning of a patient’s fatal overdose. Science 2018;361:588-90.
doi:10.1126/science.aat4595
29 Dowell D, Haegerich T, Chou R. No shortcuts to safer opioid prescribing.
N Engl J Med 2019;380:2285-7. doi:10.1056/NEJMp1904190
30 Chen JH, Humphreys K, Shah NH, Lembke A. Distribution of
opioids by different types of medicare prescribers. JAMA Intern
Med 2016;176:259-61. doi:10.1001/jamainternmed.2015.6662
31 Swedlow A, Ireland J, Johnson G. Prescribing patterns of schedule
II opioids in California workers’ compensation. California Workers’
Compensation Institute; 2011. https://www.cwci.org/document.
php?file=1438.pdf.
32 National Center for Injury Prevention and Control. CDC compilation of
benzodiazepines, muscle relaxants, stimulants, zolpidem, and opioid
analgesics with oral morphine milligram equivalent conversion
factors, 2017 version. Centers for Disease Control and Prevention;
2017. https://www.cdc.gov/drugoverdose/resources/data.html.
33 Reed WJ. The Pareto, Zipf and other power laws. Econ
Lett 2001;74:15-9. doi:10.1016/S0165-1765(01)00524-9
34 Barnett ML, Olenski AR, Jena AB. Opioid-prescribing patterns
of emergency physicians and risk of long-term use. N Engl J
Med 2017;376:663-73. doi:10.1056/NEJMsa1610524
35 Schieber LZ, Guy GPJr, Seth P, et al. Trends and patterns of geographic
variation in opioid prescribing practices by state, United States,
2006-2017. JAMA Netw Open 2019;2:e190665. doi:10.1001/
jamanetworkopen.2019.0665
36 Guy GPJr, Zhang K. Opioid prescribing by specialty and volume
in the U.S. Am J Prev Med 2018;55:e153-5. doi:10.1016/j.
amepre.2018.06.008
37 Levy B, Paulozzi L, Mack KA, Jones CM. Trends in opioid analgesic-
prescribing rates by specialty, U.S., 2007-2012. Am J Prev
Med 2015;49:409-13. doi:10.1016/j.amepre.2015.02.020
38 Hoffman KM, Trawalter S, Axt JR, Oliver MN. Racial bias in pain
assessment and treatment recommendations, and false beliefs about
biological differences between blacks and whites. Proc Natl Acad Sci
U S A 2016;113:4296-301. doi:10.1073/pnas.1516047113
39 MDCalc. Benzodiazepine conversion calculator. https://www.mdcalc.
com/benzodiazepine-conversion-calculator
40 DeCarolis DD, Rice KL, Ho L, Willenbring ML, Cassaro S. Symptom-
driven lorazepam protocol for treatment of severe alcohol withdrawal
delirium in the intensive care unit. Pharmacotherapy 2007;27:510-8.
doi:10.1592/phco.27.4.510
41 Latt N, Conigrave K, Saunders JB, Marshall JE, Nutt D, eds.
Addiction medicine . Oxford University Press, 2009. doi:10.1093/
med/9780199539338.003.0003
42 Tyrer P, Silk KR, eds. Cambridge textbook of effective treatments in
psychiatry . Cambridge University Press, 2008:3-15. doi:10.1017/
cbo9780511544392.002
43 Gelenberg AJ, Keith S, eds. The practitioner’s guide to psychoactive
drugs . Springer US, 1998:153-212. doi:10.1007/978-1-4615-
5877-4_4.
44 Gini C. Measurement of inequality of incomes. The Economic Journal.
1921. https://www.jstor.org/stable/2223319.
45 Mills JA, Zandvakili S. Statistical inference via bootstrapping for
measures of inequality. J Appl Econ 1997. doi:10.1002/(SICI)1099-
1255(199703)12:2133::AID-JAE4333.0.CO;2-H.
46 AHRQ. Agency for Healthcare Research and Quality. HCUP-US Tools
Software. https://www.hcup-us.ahrq.gov/tools_software.jsp
47 Cowell FA. Measuring inequality. London School of Economics
perspectives in economic analysis. Oxford Scholarship Online,
2011:1-16. doi:10.1093/acprof:osobl/9780199594030.003.0001
48 United Nation’s International Narcotics Control Board. Progress in
ensuring adequate access to internationally controlled substances
for medical and scientific purposes: supplement to the report of the
board for 2018. https://doi.org/10.18356/9b973caa-en.
49 Kiang MV, Basu S, Chen J, Alexander MJ. Assessment of
changes in the geographical distribution of opioid-related
mortality across the United States by opioid type, 1999-
2016. JAMA Netw Open 2019;2:e190040. doi:10.1001/
jamanetworkopen.2019.0040
50 Martin J, Cunliffe J, Décary-Hétu D, Aldridge J. Effect of restricting
the legal supply of prescription opioids on buying through
online illicit marketplaces: interrupted time series analysis.
BMJ 2018;361:k2270. doi:10.1136/bmj.k2270
Web appendix: Supplementary materials
on4February2020byguest.Protectedbycopyright.http://www.bmj.com/BMJ:firstpublishedas10.1136/bmj.l6968on29January2020.Downloadedfrom