
Recommandé
Recommandé
Contenu connexe
En vedette
En vedette (20)
2013-2014 Weight Comparison and Landfill Data Analysis
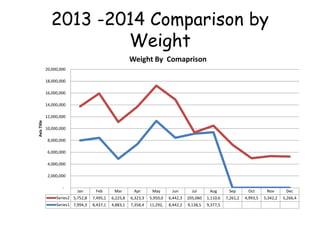
- 1. 2013 -2014 Comparison by Weight Jan Feb Mar Apr May Jun Jul Aug Sep Oct Nov Dec Series2 5,752,8 7,495,1 6,225,8 6,323,3 5,950,0 6,442,3 205,060 1,110,6 7,261,2 4,993,5 5,342,2 5,266,4 Series1 7,994,3 8,437,1 4,883,1 7,358,4 11,292, 8,442,2 9,138,5 9,377,5 - 2,000,000 4,000,000 6,000,000 8,000,000 10,000,000 12,000,000 14,000,000 16,000,000 18,000,000 20,000,000 AxisTitle Weight By Comaprison
- 2. 2013-2014 Comparison by Loads Jan Feb Mar Apr May Jun Jul Aug Sep Oct Nov Dec Series1 1709 1675 1212 1718 2167 1799 2072 1869 Series2 1444 1801 1668 1953 1683 1730 594 2848 2083 1558 1620 1271 Series3 0 500 1000 1500 2000 2500 3000 AxisTitle Load By Comparison
- 3. Material Recovery 12 to 19th Nov 2014 19500 9940 14820 14580 12300 4240 2.4 4.4 1.8 2.82 2 3 5 0 5000 10000 15000 20000 25000 Plasctic Bottles Scrap Metal Plastics/ Sacks Boxes/ Paper Sacks Wood Series 1 Series 2 Series 3
- 4. Landfill Data 7th to 14th May 2015 41 6 42 95 46 22 37 34 3 202 34 42 175380 38180 254100 496892 229600 12802010776087790 11150 1010720 728120 70770 Comparison Chart Loads Weight
- 5. Material Recovery at the Landfill 7th to 14 May 2015 Plastics Bottles 39% Scrap Metal 16% Plastics 9% Wood 8% Sacks 14% Boxes 14% Sales Plastics Bottles 29060 Scrap Metal 14360 Plastics 16740 Wood 11800 Sacks 15940 Boxes 9200
- 6. Landfill Data 7th to 14 May 2015 Catron 3% Zambia Breweries 1% Citi Mop 4% Cleanfast 11% GL carriers 5% Twine Care 3% Zoom Lion 4% Rukwa 7% Zam Leather 1% WMU trucks 45% yellow trucks 5% Own Transporters 13% Comparison Chart
- 7. Landfill Data 15th to 19th May 2015 0 200000 400000 600000 800000 1000000 1200000 1400000 1600000 1800000 Comparison Chart Loads Weight
- 8. Landfill Weekly Report 14th Jan to 4th Feb 2015 catrone 5% zambian breweries 1%citimop 4% cleanfast 12% gl carrier s 9% twincare 2% zoomlion 6% rukwa 7% zamleather 1% wmu 38% lcc & hired trucks 5% own transporters 10% Landfill Weeky Records @the Weigh Bridge
- 9. Weekly WMU Over View verses Others catrone 5% zambian breweries 1% citimop 4% cleanfast 12% gl carriers 9% twincare 2% zoomlion 6% rukwa 7% zamleather 1% wmu 43% own transporters 10% WMU @ 43 %
- 10. Material Flow at the weigh Bridge 4% 96% Landfil Material Flow Waste Out Waste In
- 11. Material Recovery at Chunga Landfill 44,260 19,800 13,160 90,920 27,500 Scrap Metal Boxes / Paper Wood Plastic Bottles Sacks Weekly Recycleable Materials Series1
- 12. Material Recovery at Chunga Landfill 14th Jan to 4th Feb 2015 Scrap Metal 23% Boxes / Paper 10% Wood 7% Plastic Bottles 46% Sacks 14% Weekly Comparison Data
- 13. Landfill Load Data Catrone 9% Zambian Breweries 1% Citimop Ltd 6% Clean Fast 9% GL Carriers 6% Twine Care 3% Zoom Lion 6%Rukwa 4%Zam Leather 5% WMU 25% Yellow Truck 11% Own Transporters 10% ACKA Gen Dealers 2% Cherishes 3% Loads
- 14. Landfill Weight Data Catrone 9% Zambian Breweries 4% Citimop Ltd 9% Clean Fast 12% GL Carriers 5% Twine Care 4%Zoom Lion 3% Rukwa 4% Zam Leather 5% WMU 13% Yellow Truck 18% Own Transporters 7% ACKA Gen Dealers 2% Cherishes 5%
- 15. Material recovery report 8th to 14th Oct 2015 8120 0 7240 2180 400 0 0 1000 2000 3000 4000 5000 6000 7000 8000 9000 Plasctic Bottles Scrap Metal Plastics/ Sacks Boxes/ Paper Sacks Wood Series 1 Series 1
- 16. Landfill weigh bridge load Data 4th to 10th Dec 2014 Catrone 5% Zambian Breweries 2% Citimop Ltd 6% Clean Fast 11% GL Carriers 11% Twine Care 3% Zoom Lion 6% Rukwa 2% Zam Leather 1% WMU 35% Yellow Truck 1% Own Transporters 17% Loads
- 17. Material Recovery 4t to 10th Dec 2104 34640 8740 18100 26940 7600 9300 2.4 4.4 1.8 2.82 2 3 5 0 5000 10000 15000 20000 25000 30000 35000 40000 Plasctic Bottles Scrap Metal Plastics/ Sacks Boxes/ Paper Sacks Wood Series 1 Series 2 Series 3
- 18. Landfill weigh bridge data 4th to 10th Dec 2014 Catrone 8% Zambian Breweries 2% Citimop Ltd 1% Clean Fast 12% GL Carriers 10% Twine Care 5% Zoom Lion 4%Rukwa 1% Zam Leather 1% WMU 49% Yellow Truck 2% Own Transporters 5% tonnage
- 19. Typical Weekly Report Data sheet
- 20. Initial Landfill Design 2006
- 23. Picture of Material recovery at the Chunga Landfill
- 24. Pictures of the Landfill tipping site
- 25. Pictures of the Ladfill at different times of the season