Cost Trend Update Bulletin, January 2018
•
0 j'aime•232 vues

The Duff & Phelps cost trend update is now available for both the Construction Cost and Equipment Cost indices. Construction costs have been relatively stable over the last five years averaging an increase of approximately 2.25%. However, in 2017 that has changed with an increase of 2.7% to 4% in three of the four indices that we track US construction costs. Average equipment costs indices are also trending to above average increases in the 0.9% to 2.6% range.

Recommandé
Recommandé
Contenu connexe
Tendances
Similaire à Cost Trend Update Bulletin, January 2018
Similaire à Cost Trend Update Bulletin, January 2018 (20)
Plus de Duff & Phelps
Plus de Duff & Phelps (20)
Dernier
Dernier (20)
Cost Trend Update Bulletin, January 2018
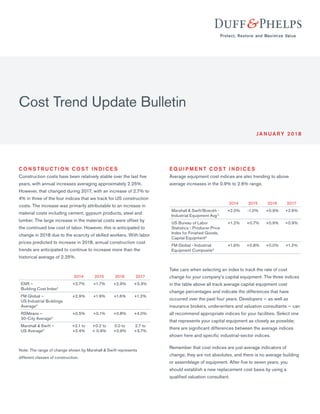
- 1. C O N S T R U C T I O N C OS T I N D I C E S Construction costs have been relatively stable over the last five years, with annual increases averaging approximately 2.25%. However, that changed during 2017, with an increase of 2.7% to 4% in three of the four indices that we track for US construction costs. The increase was primarily attributable to an increase in material costs including cement, gypsum products, steel and lumber. The large increase in the material costs were offset by the continued low cost of labor. However, this is anticipated to change in 2018 due to the scarcity of skilled workers. With labor prices predicted to increase in 2018, annual construction cost trends are anticipated to continue to increase more than the historical average of 2.25%. 2014 2015 2016 2017 ENR – Building Cost Index2 +2.7% +1.7% +2.9% +3.3% FM Global – US Industrial Buildings Average3 +2.9% +1.9% +1.6% +1.2% RSMeans – 30-City Average4 +0.5% +0.1% +0.8% +4.0% Marshall & Swift – US Average5 +2.1 to +2.4% +0.2 to + 0.9% 0.0 to +0.9% 2.7 to +3.7% Note: The range of change shown by Marshall & Swift represents different classes of construction. E Q U I P M E N T C OS T I N D I C E S Average equipment cost indices are also trending to above average increases in the 0.9% to 2.6% range. 2014 2015 2016 2017 Marshall & Swift/Boeckh - Industrial Equipment Avg.5 +2.0% -1.0% +0.9% +2.6% US Bureau of Labor Statistics - Producer Price Index for Finished Goods, Capital Equipment6 +1.2% +0.7% +0.9% +0.9% FM Global - Industrial Equipment Composite3 +1.6% +0.8% +0.0% +1.2% Take care when selecting an index to track the rate of cost change for your company’s capital equipment. The three indices in the table above all track average capital equipment cost change percentages and indicate the differences that have occurred over the past four years. Developers − as well as insurance brokers, underwriters and valuation consultants − can all recommend appropriate indices for your facilities. Select one that represents your capital equipment as closely as possible; there are significant differences between the average indices shown here and specific industrial-sector indices. Remember that cost indices are just average indicators of change; they are not absolutes, and there is no average building or assemblage of equipment. After five to seven years, you should establish a new replacement cost basis by using a qualified valuation consultant. JA N UA RY 2 018 Cost Trend Update Bulletin
- 2. Cost Trend Update Bulletin About Duff & Phelps Duff & Phelps is the global advisor that protects, restores and maximizes value for clients in the areas of valuation, corporate finance, disputes and investigations, compliance and regulatory matters, and other governance-related issues. Our clients include publicly traded and privately held companies, law firms, government entities and investment organizations such as private equity firms and hedge funds. We also advise the world’s leading standard-setting bodies on valuation and governance best practices. The firm’s nearly 2,500 professionals are located in over 70 offices in 20 countries around the world. For more information, visit www.duffandphelps.com © 2018 Duff & Phelps, LLC. All rights reserved. DP180457 M&A advisory, capital raising and secondary market advisory services in the United States are provided by Duff & Phelps Securities, LLC. Member FINRA/SIPC. Pagemill Partners is a Division of Duff & Phelps Securities, LLC. M&A advisory, capital raising and secondary market advisory services in the United Kingdom are provided by Duff & Phelps Securities Ltd. (DPSL), which is authorized and regulated by the Financial Conduct Authority. M&A advisory and capital raising services in Germany are provided by Duff & Phelps GmbH, which is a Tied Agent of DPSL. Valuation Advisory Services in India are provided by Duff & Phelps India Private Limited under a category 1 merchant banker license issued by the Securities and Exchange Board of India. S O U R C E S 1. MEPS (International), Ltd, All carbon steel products composite price and index 2. Engineering News-Record, Monthly Construction Economics Report 3. FM Global, Industrial Cost Trends 4. RSMeans, Construction Cost Indices, 30-City Average 5. Marshall & Swift/Boeckh, Marshall Valuation Service, Quarterly Cost Index 6. US Bureau of Labor Statistics, Producer Price Index for Finished Goods - Capital Equipment