1. Roland George Investments Program
Bond Swap Recommendation
Dylan Bateh
03/30/2015
Buy Candidate Overview
Clear Channel Outdoor Holdings, Inc., an outdoor advertising company headquartered in San Antonio,
Texas, owns or operates advertising display faces in the United States and internationally. It operates in
two segments, American and International, which accounts for 82% and 18% of revenue respectively.
The company offers advertising services through billboards comprising bulletins and posters. Street
furniture displays are also a part of their offering, including advertising surfaces on bus shelters,
information kiosks, freestanding units, and other public structures. Transit displays, which are advertising
surfaces on various types of vehicles or within transit systems, are also prominent. These are seen on
trains, trams, and within the common areas of rail stations and airports; and other out-of-home advertising
displays, such as spectaculars and mall displays. The company became public in November of 2005 and
has experienced moderate sales growth since its inception.
Clear Channel Holdings has maintained a steady credit rating since its inception in June of 2013, and it
received its first upgrade to B+ in August of 2014. This rating fits right in line with the Roland George
bond investment policy, making it an ideal selection. The bond also has continued to hold a stable
outlook, and is not expected to fluctuate in the future. This is significant because it diminishes uncertainty
regarding potential default risk for the portfolio. Clear Channel Holdings’ bond also has a far greater
duration and maturity date, thus making it a more attractive investment, with substantial upside. On
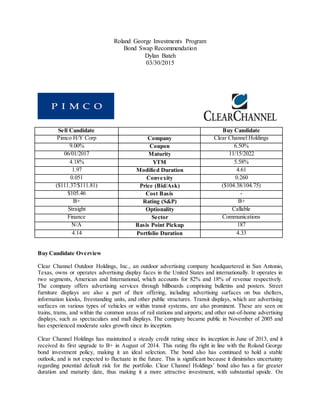
Sell Candidate Buy Candidate
Pimco H/Y Corp Company Clear Channel Holdings
9.00% Coupon 6.50%
06/01/2017 Maturity 11/15/2022
4.18% YTM 5.58%
1.97 Modified Duration 4.61
0.051 Convexity 0.260
($111.37/$111.81) Price (Bid/Ask) ($104.38/104.75)
$105.46 Cost Basis -
B+ Rating (S&P) B+
Straight Optionality Callable
Finance Sector Communications
N/A Basis Point Pickup 187
4.14 Portfolio Duration 4.33
2. March 11th
2015, Los Angeles investors Joshua Freidman and Mitchell Julis of Canyon Capital Advisors
invested an additional ten million dollars in to their four million share position. Furthermore, CEO
William Eccleshare recently announced that the company will be expanding its international operations,
specifically in European nations.
Overall, I believe that this bond is ideal due to the company’s coverage abilities and also its return on
assets, relative to the industry. The company’s profit margin in the last quarter was 5.4%, which is a
tremendous increase from both the same quarter of the previous year, and also the preceding quarter. This
shows that the company’s financial health is improving, which is positive news for bondholders.
Moreover, the company has an operating margin of 9.5%, which is 8.4% above the industry average. This
is also important for Clear Channel Holdings because it demonstrates efficient pricing strategy and
operating procedure. These positive qualities are ideal for both bondholders and the Roland George fixed
income portfolio.
Interest Rate Forecast
The start of the year 2015 looked quite similar to the start of 2014, as the economy has seen improvement
through metrics like a decreasing unemployment rate, which currently sits at 5.6% and is expected fall
even further. However, in the most recent Federal Reserve briefing, Janet Yellen stated that this labor
metric still needs to improve. Additionally, wage growth was -0.7% for the month of January. Although
this figure improved in February by approximately 1.3%, there is still room for improvement in this area
of the labor market. The Federal Reserve is still looking for more consistent growth with jobs, before
deciding to spike rates. I believe that the prolonged labor market improvements will result in an interest
rate decline of 25 basis points.
Inflation is another economic factor to consider for interest rates, and this percentage has a chance to rise
over 2% in 2015, which represents a healthy figure established by the Fed. According to Bloomberg
estimates, the long term inflation rate is expected to settle right at 2%. An important component of
inflation is consumer price index. From January to February, this index increased 0.2%, representing the
first increase in over four months. Such an increase illustrates that overall prices may be increasing.
Provided that CPI does not grow faster than wage growth, which I do not anticipate, then this should lead
to a stable inflation rate. Because of these factors, I believe there is a possibility of a 25 point increase.
There are other significant uncertainties that are contributing to the Fed’s decision of delaying the
increase of rates. For starters, Crude oil has been experiencing significant declines, due to the excess
supply in key countries like Saudi Arabia. Currently, oil is priced at $49.47 per barrel. This momentous
decline has also contributed to the Fed’s decision of keeping interest rates constant. If oil prices fail to
stabilize, then the Fed could lower rates even further, which would contradict analysts’ predictions. GDP
is also another area that seems to be holding back a potential rate hike. It is expected that GDP will be
approximately 3.3% for the majority of 2015. However, the growth rate is expected to decline to 2.5% in
the middle quarters of this year. Another important factor to consider is the economic uncertainty in
countries such as Greece and Russia. These respective countries have experienced a decline in currency
rates, which negatively affects the welfare of the United States economy. Continuous slow growth in
GDP and oil price uncertainty could ultimately affect interest rates negatively, resulting in a 25 point
decline.
Investors are also confident that the Fed will continue to effectively manage the money supply. However,
the big concern is when will it stop and what would happen when it does. As a result, the Fed needs to be
cautious with these monetary policies. Furthermore, China has experienced a lull in its production,
namely exports, which can negatively impact other markets. It is clear that the Fed has returned
confidence to investors and the private sector, and we have seen the results with the US equity markets
3. indices at all-time highs. At the same time, as Europe continues to face a variety of problems and recent
depreciation of the Euro, the United States Treasury bonds serve as a safe and stable option for foreign
investors.
With all of these factors considered, it is my opinion that interest rates will slightly decline by the end of
2015 or early in 2016, which is within the frame of the RGIP workout period. It is apparent that the
United States’ economy is growing, but these growth rates are showing signs of slowing down. As Janet
Yellen stated in the latest Federal Reserve statement, “just because we removed the word ‘patient’ from
the statement, that doesn’t mean that we’re going to be impatient”. With the inflation currently low, Fed
policymakers have decreased their median interest rate forecast for 2015 by over fifty basis points. This
indicates that a rate increase could occur sometime in the summer, which was the same expectation as
2014. However, the interest rates remained flat in 2014, proving analyst’s expectations to be incorrect. As
seen in Figure 1, the spread between the United States treasury and corporate bonds is narrowing, which
indicates a stable economy. The forward and spot yields appear to be done narrowing, which is a sign of
market sentiment towards a stable economy. This lack of volatility leads me to believe that there will be
no interest rate change in this regard. With this illustration in mind and some slowing growth metrics, I
believe that there is little reason to raise rates at this time. Because of this, I predict that interest rates will
experience a decrease of approximately 25 basis points.
S&P 500 Forecast
The year 2014 marked the third straight year in which the S&P 500 yielded double digit gains, finishing
up with a return of over eleven percent. The start of this year experienced volatile returns in January, and
the S&P 500 year to date return is currently yielding just over one percent. Similar to the bond market, the
performance of the stock market is dependent upon the Federal Reserve’s actions toward interest rates. In
the most recent news, Fed chairman Janet Yellen said the “patient” approach would be removed from the
Figure 1: Treasury Yield
4. rate policy. However, the overall economic outlook was downgraded, due to slowing export growth and a
sluggish housing market. Other significant factors include retail sales, which have declined by
approximately five percent in the last three months. Exports have also declined in the last three months,
which is a definite cause for concern. Furthermore, there are several international issues that could have
an impact on the welfare of the economy. The possibility of Greece withdrawing from the Eurozone,
coupled with Russia’s current economic crisis, have many investors wary of the previous double digits
returns. The market has been on a serious winning streak since it bottomed out in March of 2009, rising
almost two hundred percent since that time. These torrid gains should not be expected to continue moving
forward. While the market is still experiencing growth, there are several slowing metrics that are
occurring. For example, GDP growth is expected to decline from 3.3% to 2.5% in the middle quarters of
this year. As a result, it is my belief that the S&P 500 will experience some mean regression in 2015. A
positive return of 4 to 5 percent should be expected.
Swap Rationale
By looking at the yield chart in Figure 2, we can see that Pimco High Yield is trading below its average
yield of 4.58%. The yield to maturity has demonstrated profound cyclicality and typically decreases from
December to March, until it then spikes in June. Pimco’s YTM is currently 4.18%, so swapping the bond
prior to an expected yield increase in June makes sense for the portfolio. Looking at the yield to maturity
of CCO Holdings, we see that the current yield of 5.58% is trading close to its average yield of 5.72%.
The fluctuations seen in the CCO yield chart are due to its strong correlation to the United States ten year
treasury, which is detailed in both the subsequent paragraph and Figure 3. During the middle of July
2014, the company experienced a Moody’s rating upgrade from B to B+, as evidenced by the notable
decline in yield. Another important factor to consider is the maturity of Pimco which occurs on June 1st
of 2017. With this date apparent, the bond’s yield is behaving exactly as a bond of similar maturity should
move. Additionally, the Pimco holding is very liquid and can arguably be considered a cash equivalent.
Swapping out of this position is quite sensible because higher upside investments can be pursued. With
CCO Holdings’ yield trending downwards; it suggests that the bond can be more beneficial to the Roland
George portfolio, rather than continuing to hold Pimco fixed income security.
When examining the connection of CCO Holdings’ performance with both the ten year treasury and the
S&P 500, several important market factors can be determined. Looking at Figure 3, it can be seen that
CCO Holdings is strongly correlated to the treasury and the S&P 500. As shown below, the relationship
Figure 2: Yield Chart
5. between CCO Holdings and the stock market illustrates that there is an inverse correlation, as indicated
by the negative coefficient. The p-values are also important because they indicate the statistical
significance of CCO Holdings’ relationship with both the ten year treasury note and the S&P 500.
∆CCO 𝑦𝑖𝑒𝑙𝑑=1.28*(-0.25)-0.14∗ (4%)
2
∆CCO 𝑦𝑖𝑒𝑙𝑑= 44 BPS decrease
The above formula illustrates the most likely scenario for Clear Channel Holdings’ yield. This was
derived by using the coefficients of the daily yields from CCO Holdings and the U.S. ten year treasury.
Additionally, the coefficients of the daily returns of the S&P 500 were factored into the regression
formula. The final result of the formula shows the most likely yield scenario for CCO Holdings to result
in a forty four basis point decline.
∆Pimco 𝑦𝑖𝑒𝑙𝑑= .02 -0.04*(-.25)-0.17∗ (4%)
∆Pimco 𝑦𝑖𝑒𝑙𝑑= 37 BPS decrease
Figure 4: Pimco Regression
Analysis
Figure 3: CCO Regression Analysis
6. When computing the most likely scenario for the Pimco in Figure 4, there were several regression
components used. The coefficients of the daily yields from Pimco and the U.S. ten year treasury were
used. Also, daily S&P returns were used in the formula to further illustrate the relationships between the
three regression inputs. With all these factors considered, the equation, divided by two, derives a most
likely scenario of a thirty seven basis point decrease.
Since it is my expectation that interest rates will decrease slightly due to global, economic and political
concerns, it would thus be sensible to increase the duration of our portfolio. Pimco matures in 2017, while
Clear Channel Holdings matures in 2022. By swapping these two bonds, the portfolio duration would be
increased to 4.33. Under my most anticipated scenario of a thirty seven basis point decrease of Pimco, and
decrease of forty four basis points for CCO Holdings, the return pick up will be 187 basis points.
Fair Value of Clear Channel Holdings
In order to calculate the fair value for Clear Channel Holdings, I found three similar bonds for
comparison: Vandelay Communications, Noble Group LTD, and Digicel Holdings. With all comparable
bonds having similar yields, maturities, duration, optionality and sector, I calculated the average yield of
the comparable bonds and found it to be 6.50%. Then by subtracting the average of the comparable yields
to that of FTR I found a value of -0.58%. Finally I multiplied this interest rate change by the negative
value of the duration of CCO’s bond to give me a mispricing of -267 basis points. This is shown in Figure
8 below.
Figure 6: Fair Value of CCO Holdings
Figure 5: Most Likely Scenario
7. Mispricing = -Duration * Interest rate changes
Mispricing = -4.61 * 0.58%
Mispricing = -267 basis points
Fair Value Pimco
I implored the same method when calculating the fair value for Pimco. This was done by finding three
comparable bonds to that of STAR which included: KWG Property Holding., GTB Finance, and Sprint
Capital Corp. The three comparable bonds had all the same characteristics to that of STAR. I undertook
the same process of averaging the yields and subtracting the average yield of the comparable to that of
Pimco. I then multiplied by the negative duration of Pimci to get a mispricing of 123 basis points, thus
implying that the bond is overvalued.
Mispricing = -Duration * Interest rate
Mispricing = -1.967 * -0.62%
Mispricing = 123 basis points
Figure 7: Fair Value Pimco
8. Interest Rate Stress Test
PIMCO
CCO
Holdings
PIMCO H/Y
YTM
CCO YTM Spread Net P&L BPS
no move no move 5.71 4.19 152 14,318 121
no move down 14 5.71 4.05 166 11,514 95
no move down 7 5.71 4.12 159 8,698 72
no move down 21 5.71 3.98 173 5,872 49
no move up 14 5.71 4.33 138 17,111 141
no move up 7 5.71 4.26 145 19,893 164
no move up 21 5.71 4.40 131 21,005 110
down 15 no move 5.56 4.19 137 11,939 99
down 15 down 14 5.56 4.05 151 1,472 75
down 15 down 7 5.56 4.12 144 6,326 55
down 15 down 21 5.56 3.98 158 3,494 29
down 15 up 14 5.56 4.33 123 14,732 122
down 15 up 7 5.56 4.26 130 17,515 145
down 15 up 21 5.56 4.40 116 20,286 167
down 44 no move 5.27 4.19 108 11,809 98
down 44 down 14 5.27 4.05 122 16,978 130
down 44 down 37 5.27 3.82 145 22,664 187
down 44 down 21 5.27 3.98 129 -10,060 -83
down 44 up 14 5.27 4.33 94 1,179 10
down 44 up 37 5.27 4.56 71 3,961 33
down 44 up 21 5.27 4.40 87 6,732 56
down 62 no move 5.09 4.19 90 14,452 124
down 62 down 14 5.09 4.05 104 17,757 147
down 62 down 37 5.09 3.82 127 -20,572 -170
down 62 down 21 5.09 3.98 111 -23,398 -193
down 62 up 14 5.09 4.33 76 33,871 285
down 62 up 37 5.09 4.56 53 -11,009 -100
down 62 up 21 5.09 4.40 69 -6,606 -77
up 15 no move 5.86 4.19 167 -5,000 -54
up 15 down 20 5.86 3.99 187 28,169 227
up 15 down 37 5.86 3.82 204 27,844 214
up 15 down 21 5.86 3.98 188 30,564 231
up 15 up 14 5.86 4.33 153 21,456 165
up 15 up 37 5.86 4.56 130 17,212 143
up 15 up 21 5.86 4.40 146 10,974 97
up 33 no move 6.04 4.19 185 21,058 160
up 33 down 14 6.04 4.05 199 28,083 225
up 33 down 37 6.04 3.82 222 26,743 201
up 33 down 21 6.04 3.98 206 34,123 300
up 33 down 14 6.04 4.05 199 33,017 275
up 33 up 37 6.04 4.56 148 -30,631 -234
up 33 up 21 6.04 4.40 164 -28,978 -205
9. After reviewing the results of the tests I found several important findings. Out of all the scenarios tested
there is an 84% positive basis point pickup. The overall average dollar profit is $15,056 or 126 bps. Out
of my most likely scenarios which are italicized and highlighted, the average bps pickup is 154 and an
$18,992 profit. The greatest loss is 234 bps whereas our greatest gain potential is 300 bps. This presents
an opportunity for us to improve our portfolio return, and thereby gaining more profit.
I also conducted a credit rating stress test (Figure 8) to determine the capital loss the portfolio would incur
if after Clear Channel Holdins was purchased it was downgraded. The results of the analysis are shown in
Figure 9. I isolated two possible scenarios, the first being if CCO Holdings was downgraded one rating
from B+ to B after being purchased. I found a comparable bond to CCO Holdings, Intelsat Holdings, but
with one credit rating lower. The table above shows the Roland George Bond Portfolio would incur a loss
of 207 bps if the bond was downgraded one credit rating after purchase. I also investigated, if after being
purchased, CCO Holdings was downgraded two ratings from B+ to B-. I found another comparable that
had a credit rating of B- which represents a two rating drop, as shown by Altice SA. If this were to come
to fruition, then the loss would be 345 bps as in Figure 9. However, the bond has a stable credit rating and
has been upgraded once already since it was issued in 2013.
Source ofSwap Profit
BPS Pickup = Interest Rate + Credit Risk + Optionality + Mispricing
In swapping Pimco Financial’s bond for Clear Channel Holdings’ bond, the portfolio would realize a 187
basis point pickup under my predicted scenario. By breaking down and analyzing each component of this
pick up, we can see where specifically these 187 BPS are coming from, and how much each component
contributes to the total return.
Interest Rate Pickup: +245
To find the interest rate pickup from the swap, I found another bond with nearly identical characteristics
of Pimco, but with a similar duration of Clear Channel Holdings. The interest rate pickup from the swap
is 245 basis points. This makes sense since I am increasing the duration from 1.97 to 4.61. Increasing the
duration in a flat to lowering interest rate environment will be beneficial to the portfolio.
Figure 8: Credit Rating Stress
Test
10. Credit Risk Pickup: 0
The swap profit is also impacted by credit risk, but given that Pimco has a rating of B+ and Clear Channel
Holdings also has a B+ rating, this eliminates a great deal of risk associated with dropping a rating. As a
result, there would be little to no basis point pickup in this department.
Sector Pickup: -20
I am choosing to swap out of the financial sector and into the communications sector. In order to measure
the basis point pickup I selected a bond that matched the characteristics of the sell candidate and only
changed the sector. This way I was able to isolate the basis point pickup that the portfolio gains from
switching sectors. The Roland George Investments Program will experience a twenty basis point decline
from switching out of the financial sector and into the communications sector.
11. Optionality: 137
I examined the basis point pick up accounting for a swap from a straight bond to a callable bond. In order
to show the impact of optionality I chose Petco Holdings LLC, which has similar characteristics to Pimco
H/Y Corp, but is also a callable bond like Clear Channel Holdings’ bond. By picking up a callable bond,
the swap would experience a 137 basis point return in this area.
.
Mispricing: -175
After conducting several different methods to find the fair value of each bond, I found that Pimco is
overvalued by 123 basis points and Clear Channel Holdings is undervalued by 267 basis points. When I
compared my raw calculations with those of the Bloomberg fair value function I found that my
projections were right in line with other analysts’ projections.
12. Credit Risk Analysis
Analyzing the credit rating of both companies is very important when determining whether to execute a
swap. Pimco currently has a credit rating of B+ from S&P and Moody’s, but a BB- rating from Fitch.
This is slightly different than that of Clear Channel Holdings which has a credit rating of B+ from S&P
and from Moody’s. On June 13th of 2014, Moody’s Investor Service upgraded CCO Holdings’ previous
rating of a B to a B+. If the company can continue to improve its cash flows, then the company could
possibly see another rating upgrade, or an upgraded outlook to “positive”.
In the last quarter, Clear Channel Holdings generated $802 million in revenue. Also, the company has an
operating margin of 9.5%, which is 8.4% above the industry average of 1.1%. Additionally, CCO
Holdings has a net margin of 0.3%, compared to the industry’s -7.9% net margin. The reason that CCO
Holdings has a high interest expense is due to their $4.9 billion of total debt, which is expected to be
reduced moving forward. Clear Channel Holdings has a coverage ratio of 1.3. This means that they can
pay 130% of their interest expenses per year. One key metric where CCO Holdings lags behind the
industry is the current ratio. The company has a ratio of 1.5, which shows the proportion of current assets
to current liabilities. Their debt to equity ratio is 1.79, which is a bit higher than the industry average.
CCO Holdings’ return on assets is 2.94%, which is significantly higher than that of industry. Profit
margin is also important to look at, as it illustrates the financial health of a company. CCO Holdings’
margin is -0.4%, which compares favorably to the industry’s profit margin of -2.41%. Moody’s has
reaffirmed Clear Channel Holdings’ rating of B1, which is equivalent to B+, and believes that their
outlook is stable.
Conclusion
Swapping the Pimco bond for Clear Channel Holdings’ bond would benefit the portfolio for a variety of
reasons. The two companies’ respective yields have been recently trending inversely, with CCO
Holdings’ yield beginning to decrease. My prediction of interest rates decreasing corroborates the
decision to increase the portfolio duration. With the spread between the U.S. treasury and U.S. corporate
bonds narrowing, it also justifies dropping one credit rating. The Roland George Pimco holding is very
liquid, closely resembling cash outstanding. Moreover, CCO Holding’s bond has maintained a stable
outlook, which includes one rating upgrade since the bond’s inception in June of 2013. If the company
continues to possess a stable amount of long term debt, then it help improve other important measures
such as free cash flow. The swapping will earn a 187 basis points pickup if Clear Channel Holdings
decrease by 44 basis points, while Pimco increases by 25 basis points. Because of these factors, I
recommend that the Roland George Investments Program swap its position in Pimco for Clear Channel
Holdings.