Physical development of children. Semiotics violation of physical development of children

This document summarizes key points from a lecture on physical development in children: 1. Physical development is influenced by biological factors like heredity and age as well as social factors like nutrition, education and living standards. 2. Prenatal factors like pregnancy number, diseases, drugs and malnutrition can impact length and weight changes. Standard formulas are used to assess fetal size by gestational age. 3. After birth, average weight gain, height increases and head/chest measurements are calculated by age to assess healthy development. Deviations outside set percentiles may indicate issues. 4. Throughout childhood, physical parameters are compared to age/sex standards using tables to evaluate proportional growth and identify potential developmental delays or

Recommandé
Recommandé
Contenu connexe
Tendances
Tendances (20)
Similaire à Physical development of children. Semiotics violation of physical development of children
Similaire à Physical development of children. Semiotics violation of physical development of children (20)
Plus de Eneutron
Plus de Eneutron (20)
Dernier
Dernier (20)
Physical development of children. Semiotics violation of physical development of children
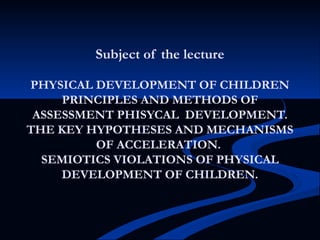
- 1. Subject of the lecture PHYSICAL DEVELOPMENT OF CHILDREN PRINCIPLES AND METHODS OF ASSESSMENT PHISYCAL DEVELOPMENT. THE KEY HYPOTHESES AND MECHANISMS OF ACCELERATION. SEMIOTICS VIOLATIONS OF PHYSICAL DEVELOPMENT OF CHILDREN.
- 2. Physical development of children - a process of change in morphological and functional properties of the organism and their status in different age periods, determining stock of physical strength, endurance and performance
- 4. The physical development of a person is caused by: 1) biological factors (heredity, gender, age, etc.) 2) social factors (material and cultural living standards, use and distribution of wealth, food, education, life, etc.).
- 5. Sponsored Medical Lecture Notes – All Subjects USMLE Exam (America) – Practice
- 6. Factors prenatal period that affect the change in length and weight ■ 1 Serial number of pregnancy ■ 2 Various obstetrical pathology ■ 3 drugs that are taken pregnant ■ 4 Diseases pregnant ■ 5 Genetic Factors ■ 6 Qualitative and quantitative malnutrition ■ 7 Violation of care ■ 8 Acute and chronic diseases of the child
- 7. Scheme regulation of growth (For Fanconi) ■ 1 The structural material ■ 2 neurohumoral regulation ■ 3 metabolism ■ 4 End of organs and tissues that grow.
- 8. ■ Homeorezes - maintaining stability in systems of developing the capacity for compensatory growth after exposure of stressors
- 9. ■ FACTORS AFFECTING PHYSICAL DEVELOPMENT OF THE CHILD ■ - Factors of prenatal origin (gestosis, prematurity, multiple, etc.); ■ - The quantity and quality of food: starvation, poor feeding; ■ - Acute and chronic diseases;
- 10. ■ - Endocrine diseases; ■ - Central nervous system lesions; ■ - Biological factors; ■ congenital and hereditary diseases; defects; ■ - Socio-economic, domestic.
- 11. CONCEPT OF acceleration From the English acceleration
- 12. The main manifestations in infants ■ More intense gain in weight and growth during the first year ■ Earlier overgrowth of the large top of the head ■ An earlier eruption of primary teeth ■ The increase in weight and body length of newborn
- 13. Manifestations of acceleration in young children
- 14. Acceleration in children aged 3 to 6 - 7 years A more pronounced increase of growth and weight ■ An earlier appearance of ossification nuclei ■ Earlier replacement of primary teeth to permanent
- 15. Acceleration at school age ■ A more pronounced increase of growth, body length and body weight ■ Acceleration of puberty ■ The emergence of dissonance between early sexual and emotional maturation and lack of mental development and social immaturity
- 16. Acceleration at school age
- 17. Hypotheses acceleration ■ 1 Physical and chemical theory: Radiowave, magnetic ■ The influence of cosmic radiation ■ Increasing carbon dioxide (increase production) ■ Theories of individual factors of living conditions: ■ Alimentary ■ Enhanced information flow
- 18. Hypotheses acceleration ■ Genetic theory: ■ Cyclic biological changes ■ heterosis ■ Theories of complex factors of living conditions ■ Urban impacts ■ The effects of complex social and biological factors
- 19. Standard "dental age"? (Total number of teeth) Age, years Girls Boys 6 7 8 7 9 9 8 11 11 9 14 13 10 19 17
- 20. Assessing the physical development of the fetus: ■ Assessment of fetal body length according to gestational age (empirical formula Haase): ■ in the first 5 months - L = n2; ■ after 5 months - L = n x 5, where n - the number of months of pregnancy, and L - length of the body of the fetus.
- 21. The maximum weight gain of the fetus is in the 34th week of pregnancy. ■ Between the 36th and 40th weeks of pregnancy, the intensity of weight gain slows.
- 22. Approximate calculations: weight of the fetus at 30 weeks of pregnancy is 1,300 g .; are every week need to add 200 g, and for each previous week subtract 100 g This calculation can be used between the 25th and 42nd weeks of pregnancy.
- 23. Perimeter of the head: ■ 34 weeks fetal head perimeter is 32 cm, for each preceding month subtract 1 cm, and the next one - add 0.5 cm.
- 24. ■ FEATURES physical development of the newborn: ■ - Birth weight 3200-3500 g; ■ - Body length - 48-52 cm; ■ - circumference of head - 34-36 cm; ■ - circumference of the chest - 32-33 cm; ■ - Physiological weight loss of 5-8%.
- 25. Calculation of key indicators of healthy physical development of children under one year
- 26. Body weight: The gain for the 1st month 600 g; for 2 months 800 g; 3-month and 800 g; in each month 50 grams less than the previous
- 27. Height: for the first quarter. - 3 cm per month (Quarterly 9 cm); In the second quarter. - 2.5 cm per month (quarterly 7.5 cm); in the third quarter. - 1.5 cm per month (quarterly 4.5 cm); for the IV quarter. - 1,0 cm per month (Quarterly 3 cm).
- 28. Perimeter of the head: 1 monthly increases of 1.5 cm to 6 months, after 6 months to 0.5 cm per month; 2 to 6 months = 43-1,5 sight head (6-n); after 6 months - 43 + 0,5 (n-6), where n - the age in months.
- 29. Circumference of the chest: Monthly increases by 1.3 cm; Up to 6 months PER = 45-2 (6-n), after 6 months - 45 + 0,5 (n-6), where n - the child's age in months.
- 30. The calculation of basic parameters of physical development of children, older 1 year
- 31. Body weight: from 2 to 10 years M = 10 + 2n, where n - the child's age in years. Over 10 years: M = 30 + 4 (n-10), where n - the child's age in years.
- 32. Height: up to 4 years: L = 100 - 8 (4-n); over 4 years: L = 100 + 6 (n-4), where n - the child's age in years.
- 33. Perimeter of the head: 1 to 5 years CO = 50 - 1 (5-n); after 5 years CO = 50 + 0,6 (n-5) where n - the child's age in years.
- 34. Breast sight: from 1 to 10 years: PER = 63 - 1.5 (10-n); over 10 years: PER = 63 + 3 (n - 10) where n - the child's age in years.
- 35. Assessment of anthropometric data: - Average - the parameters within 7% of the average value; - Above or below average - within 8-20% - Low or high - more than 20% of the average value of the empiric formula.
- 37. ■ L.I.Chulytskaja fatness index (characterizing the degree of fatness of the child): ■ 3 contours of the arm (cm) + bypass hip (cm) + bypass leg (cm) - Height (cm); ■ Normal: up to a year - 20-25 cm; ■ with malnutrition - less than 20 cm; ■ at parathrofya- more than 25 cm. ■ 2-3 years - 20 cm; ■ 6-7 years - 15-10 cm; ■ 7-8 years - 6 cm.
- 38. ■ Index Arisman (IE) describes the development of the child's chest and part of her fatness: ■ IA= chest perimeter (cm) - 1 2 growth ■ Normal: 1st year - 13.5 - 10 cm; ■ 2-3 years - 9 - 6 cm; ■ 6-7 years - 4-2 cm; ■ 7-8 years to 15 years IE = 1.3 cm; ■ Adults - 5-6 cm.
- 39. Index O.F.Tura: - Difference between the perimeter of the head and chest; Rate from 1 to 7 years breast bypass exceed the sight head so much cm how old baby.
- 40. Index of proportionality L.I.Chulytskaja: 3 contours shoulder = chest circumference = bypass hip + bypass leg.
- 41. Physical factor of (Q) shows the percentage of normal is the body weight of the child: actual body weight (kg) Q = ------------ x 100, proper body weight (kg)
- 42. the ratio of weight to height (for infants). Rule 60-64.
- 43. METHOD anthropometric STANDARDS. Is the most accurate because individual anthropometric data of children compared to age, sex and regional standards anthropometric tables of two types: parametric (standard deviation) and nonparametric (percentile) types.
- 44. • 1 Sihmaid table: • determining the standard deviation (sigma); • assessment of physical development is carried out individually by comparing anthropometric data with the average child physical development (standards); • The difference is divided by sigma in the table; • get sigma regression; • ranked on a scale regression in the basis of a notional growth.
- 45. Principle syhmaid tables In the normal distribution of physical development (height, weight, etc.) in 68.3% of children the values of these parameters are within a square, medium deviation (X ± 1ð), in 95.5% of children - in the range (X ± 2ð), at 99.7% - within (X ± 3ð).
- 46. Comparison of mean values of parameters
- 47. If growth performance, body weight, perimeter (contour) and anthropometric indices do not differ from the average and thus weight and height correspond chest perimeter, the physical development of the child find harmonious. If these figures are the difference greater than 1 σ regression - a disharmonious physical development .
- 48. centile method. Principle of the centile tables is that it devide values of physical development at 100 equivalent intervals, often use 3, 10th, 25th, 50th, 75th, and 90-97- percentile.
- 49. Percentile table height and body mass
- 50. Rating: 25-75 th centile - average; 25-10 th, 75-90 th - downward trend or growth rate; 9-3 th, 91-97 th centile - a clear reduction or apparent growth rate.
- 51. ■ In assessing the anthropometric data used the following criteria: ■ Middle- if deviations are found within: ■ a) empirical formulas x 7%; ■ b) syhmalnymy tables x 1; ■ c) grow-mass values are within the average centile zone from 25 to 75 tsentylya.
- 52. ■ Above or below average - if deviations are found within: ■ a) empirical formulas x 8-20%; ■ b) sigmaid tables x -2; ■ c) the area occupied centile intervals, respectively, from 75 to 90 and from 25 to 10 centile.
- 53. ■ High or low - if deviations are found within: ■ a) empirical formulas values 20%; ■ b) sigmaid tables 2; ■ c) the value of the index falls into the area from 10 to 3 or 90 to 97 centile.
- 54. ■ Forms of physical abuse: ■ - Malnutrition; ■ - Growth delay;
- 57. EXTENT malnutrition De gr ee s defi cien cy weig ht defi cie ncy of gro wth Inde x fatne ss Chul ytsk oyi Index of propo rtiona lity Chuly tskoyi І 10- 20 % - 10-15 norma lly ІІ 21- 30 % на 2-4 см 0-10 Propo rtional ity broke n ІІІ > на - Propo
- 58. PARATROFIYA (up to 1 year old): - Dominated mass of growth; - Even excess weight and height; - Normal weight and height of the child.
- 59. ■ OBESITY (after 1 years of age): ■ I degree 15-25% excess weight; ■ The second degree. - 26-50%; ■ III. - 51-100%; ■ IV. - An excess of over 100%.
- 60. Thank you!