Good Stuff Happens in 1:1 Meetings: Why you need them and how to do them well
Sealevel
1. Sea-Level Decline
v 0.9 20090730 - Please comment
Ecotretas (ecotretas@gmail.com)
http://ecotretas.blogspot.com
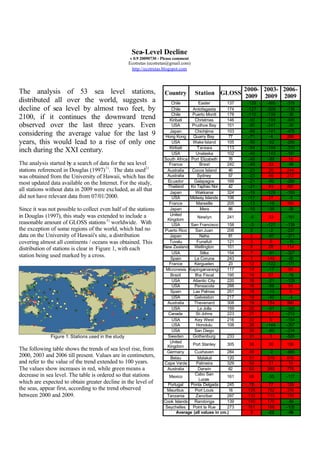
The analysis of 53 sea level stations, 2000- 2003- 2006-
Country Station GLOSS
2009 2009 2009
distributed all over the world, suggests a Chile Easter 137 -129 -460 -319
decline of sea level by almost two feet, by Chile Antofagasta 174 -127 -309 -139
Chile Puerto Montt 178 -110 -139 -30
2100, if it continues the downward trend Kiribati Christmas 146 -92 -199 -400
observed over the last three years. Even USA Prudhoe Bay 151 -90 -247 -30
Japan Chichijima 103 -88 -141 -479
considering the average value for the last 9 Hong Kong Quarry Bay 77 -71 -4 268
years, this would lead to a rise of only one USA Wake Island 105 -56 -52 -295
Kiribati Tarawa 113 -54 -144 -310
inch during the XXI century. USA Unalaska 102 -49 -143 -181
South Africa Port Elizabeth 76 -49 -99 16
The analysis started by a search of data for the sea level France Brest 242 -49 33 -99
stations referenced in Douglas (1997) 1). The data used2) Australia Cocos Island 46 -23 26 244
was obtained from the University of Hawaii, which has the Australia Sydney 57 -23 46 212
most updated data available on the Internet. For the study, Ecuador Galapagos 169 -21 -90 -269
Thailand Ko Taphao Noi 42 -21 93 297
all stations without data in 2009 were excluded, as all that Japan Wakkanai 324 -19 -126 -193
did not have relevant data from 07/01/2000. USA Midway Islands 106 -17 27 -5
France Marseille 205 -13 -19 150
Since it was not possible to collect even half of the stations Japan Mera 86 -10 -39 -35
in Douglas (1997), this study was extended to include a United
Newlyn 241 -9 33 -161
Kingdom
reasonable amount of GLOSS stations 3) worldwide. With USA San Francisco 158 -3 -127 -139
the exception of some regions of the world, which had no Puerto Rico San Juan 206 0 -2 -237
data on the University of Hawaii's site, a distribution Japan Naha 81 2 -87 -371
covering almost all continents / oceans was obtained. This Tuvalu Funafuti 121 3 6 -15
distribution of stations is clear in Figure 1, with each New Zealand Wellington 101 6 28 114
USA Sitka 154 7 -91 -327
station being used marked by a cross. Spain La Coruna 243 7 149 -80
France Kerguelen 23 12 -122 -171
Micronesia Kapingamarangi 117 14 -17 98
Brazil Ilha Fiscal 195 14 57 -19
USA Atlantic City 220 16 -21 -129
USA Pensacola 288 18 -88 99
Spain Las Palmas 251 18 -13 4
USA Galveston 217 19 -40 -4
Australia Thevenard 308 19 154 560
USA La Jolla 159 20 -91 -340
Canada St-Johns 223 21 11 -213
USA Key West 216 22 9 -154
USA Honolulu 108 26 -144 -357
USA San Diego 30 -80 -214
Figure 1: Stations used in the study Sweden Gothenburg 233 31 3 -505
United
Kingdom Port Stanley 305 38 30 136
The following table shows the trends of sea level rise, from Germany Cuxhaven 284 48 -2 -686
2000, 2003 and 2006 till present. Values are in centimeters, Belau Malakal 120 51 318 616
and refer to the value of the trend extended to 100 years. Cape Verde Palmeira 329 54 31 16
The values show increases in red, while green means a Australia Darwin 62 62 265 778
decrease in sea level. The table is ordered so that stations Cabo San
Mexico 161 68 -35 -117
Lucas
which are expected to obtain greater decline in the level of Portugal Ponta Delgada 245 78 77 129
the seas, appear first, according to the trend observed Mauritius Port Louis 18 128 152 318
between 2000 and 2009. Tanzania Zanzibar 297 132 115 178
Cook Islands Rarotonga 139 140 170 -59
Seychelles Point la Rue 273 161 168 -105
Average (all values in cm.) 3 -22 -56
2. Data Analysis, done through mean values, referenced in the The sea-level rise is clear betw een 2000 and late 2006, but
last line of the table, leads to a conclusion that sea level seems to level off after that. Nevertheless, current sea-level
will rise only one inch during the XXI century, if the trend is slightly 5 inches higher that it was 9 years ago.
during the last 9 years (07/01/2000 - 06/30/2009) is
maintained. But if we look at the trend of the last six years, Other stations exhibit somewhat the global behavior.
the sea level decline would be almost 9 inches this century, Japan’s Naha station is the one nearest the overall trend.
enough to offset the increase observed in the last century. Measurements for the last 9 years can be seen in Figure 4.
But using the trend of the last three years, there would be a And while maximum values have dropped a lot, so have
drop by almost two feet by the year 2100! minimum values gone up. These seasonal variations are
visible in all stations, and are normal. The overall trend for
Why is the official data from the IPCC, and others, so the last 9 years is a sea-level that is clearly stable.
different? Simply because it does not take into account
updated and recent data. According to the Wikipedia page 3200
y = 0.0005x + 2593.6
about sea level rise, the most recent data used in 3100
international studies is related to 2003! The data used in 3000
2900
this study is updated up to May this year (with the notable 2800
exception of Marseille, which is included because it is 2700
referenced in Douglas (1997)), and many already have data 2600
2500
after June 30 (not included in the study). 2400
2300
Geographical analysis of the data shows that the Pacific 2200
7/1/2000 7/1/2001 7/1/2002 7/1/2003 7/1/2004 7/1/2005 7/1/2006 7/1/2007 7/1/2008 7/1/2009
coast of North, Central and South America, has the largest
Figure 4: Naha – Japan (GLOSS #81)
decline trend. The station with the biggest downward trend,
Easter Island, in Chile, is shown in Fig ure 2. Sea-level rise The main concern of climate alarmists is that there will be
is clear between 2000 and mid-2006, but afterwards a clear major damage with sea level rise. Major criticism for this
decline is observed, with minimum values decreasing by 8 study will come from the reduced timeframe used for the
inches in a period of only one year.
trend analysis. But as can be seen from Figure 5, which
shows us the data for the sea level station of Honolulu,
2100
y = -0.0353x + 2875.3 while the trend is pointing upward for the last 9 years, it
2000
1900
has been going down for the last six years.
1800
1700 1700
y = 0.0071x + 1164.2
1600 1650
1500 1600
1550
1400
1500
1300
1450
1200
7/1/2000 7/1/2001 7/1/2002 7/1/2003 7/1/2004 7/1/2005 7/1/2006 7/1/2007 7/1/2008 7/1/2009 1400
1350
Figure 2: Easter Island – Chile (GLOSS #137) 1300
1250
On the other hand, data shows the Indian Ocean is clearly 1200
7/1/2000 7/1/2001 7/1/2002 7/1/2003 7/1/2004 7/1/2005 7/1/2006 7/1/2007 7/1/2008 7/1/2009
rising. Data from the Point La Rue, in Seychelles, the
Figure 5: Honolulu – USA (GLOSS #108)
station with the biggest rising trend, is shown in Figure 3.
Finally, in the last nine years trend, the three biggest
1500
y = 0.0441x - 653.29 absolute changes are sea level rises. And in the last three
1400
years trend, three of the four largest variations are also
1300
rises. When things occur these way, and when the averages
1200
are the ones referenced, data outlier exclusion would
1100
increase even more sea level decline!
1000
1)
900 www.springerlink.com/content/p364381652174757/
2)
800 Data obtained from http://ilikai.soest.hawaii.edu/uhslc/wocestc.html on
700
July 23th, 2009
3)
7/1/2000 7/1/2001 7/1/2002 7/1/2003 7/1/2004 7/1/2005 7/1/2006 7/1/2007 7/1/2008 7/1/2009
www.gloss-sealevel.org/
Figure 2: Point La Rue – Seychelles (GLOSS #273)