Climate Change Impacts on Terrestrial and Aquatic Ecosystems.pptx
Finn ohbm2017 ed_workshop
1. Reliable individual
functional networks
and their relationship
to behavior
Emily S. Finn, PhD
Section on Functional Imaging Methods
Laboratory of Brain & Cognition, NIMH
emily.finn@nih.gov
Taking Connectivity to a Skeptical Future
Educational Workshop | OHBM Annual Meeting
June 25, 2017
@esfinn
19. Why study individual differences?
0.93 0.84 0.63
0.72 0.79 0.67
0.64 0.60 0.54
R1
WM
Mt
R2 Lg Em
Database
Target
ID rate
0.5 1.0
Finn et al., Nat Neurosci (2015)
20. Why study individual differences?
You always look most like yourself,
regardless of what you’re doing
0.93 0.84 0.63
0.72 0.79 0.67
0.64 0.60 0.54
R1
WM
Mt
R2 Lg Em
Database
Target
ID rate
0.5 1.0
Finn et al., Nat Neurosci (2015)
21. Why study individual differences?
You always look most like yourself,
regardless of what you’re doing
0.93 0.84 0.63
0.72 0.79 0.67
0.64 0.60 0.54
R1
WM
Mt
R2 Lg Em
Database
Target
ID rate
0.5 1.0
Finn et al., Nat Neurosci (2015)
22. Why study individual differences?
You always look most like yourself,
regardless of what you’re doing
0.93 0.84 0.63
0.72 0.79 0.67
0.64 0.60 0.54
R1
WM
Mt
R2 Lg Em
Database
Target
ID rate
0.5 1.0
Individual differences in FC predict
individual differences in behavior
Finn et al., Nat Neurosci (2015)
27. Q. Do you need HCP-quality data?
A. Not really
28. Q. Do you need HCP-quality data?
A. Not really
ID is fairly robust even at more standard spatial & temporal resolutions:
29. Q. Do you need HCP-quality data?
A. Not really
Airan et al., Hum Brain Mapp (2016)
ID is fairly robust even at more standard spatial & temporal resolutions:
30. Q. Do you need HCP-quality data?
A. Not really
Airan et al., Hum Brain Mapp (2016)
ID is fairly robust even at more standard spatial & temporal resolutions:
Courtesy of Jason Druzgal
31. Q. Do you need HCP-quality data?
A. Not really
• More nodes —> higher identification rate
Airan et al., Hum Brain Mapp (2016)
ID is fairly robust even at more standard spatial & temporal resolutions:
Courtesy of Jason Druzgal
32. Q. Do you need HCP-quality data?
A. Not really
• More nodes —> higher identification rate
‣ Parcellation method (random vs. functional) did not matter
Airan et al., Hum Brain Mapp (2016)
ID is fairly robust even at more standard spatial & temporal resolutions:
Courtesy of Jason Druzgal
33. Q. Do you need HCP-quality data?
A. Not really
• More nodes —> higher identification rate
‣ Parcellation method (random vs. functional) did not matter
‣ Caution: Higher resolution may amplify effects of anatomical diffs/registration error
Airan et al., Hum Brain Mapp (2016)
ID is fairly robust even at more standard spatial & temporal resolutions:
Courtesy of Jason Druzgal
34. Q. Do you need HCP-quality data?
A. Not really
• More nodes —> higher identification rate
‣ Parcellation method (random vs. functional) did not matter
‣ Caution: Higher resolution may amplify effects of anatomical diffs/registration error
‣ Parcellations in the 200-300 node range seem like a good compromise
Airan et al., Hum Brain Mapp (2016)
ID is fairly robust even at more standard spatial & temporal resolutions:
Courtesy of Jason Druzgal
37. Q. What about amount of data?
A. Scan duration matters!
38. Q. What about amount of data?
A. Scan duration matters!
Longer acquisitions are better:
39. Q. What about amount of data?
A. Scan duration matters!
Longer acquisitions are better:
• higher reliability within subjects
Birn et al., NeuroImage (2013)
40. Q. What about amount of data?
A. Scan duration matters!
Finn et al., Nat Neurosci (2015)
• higher identifiability across subjects
Longer acquisitions are better:
• higher reliability within subjects
Birn et al., NeuroImage (2013)
41. Q. What about amount of data?
A. Scan duration matters!
Finn et al., Nat Neurosci (2015)
• higher identifiability across subjects
‣ higher sampling rate (shorter TR) cannot
make up for shorter scan duration
Longer acquisitions are better:
• higher reliability within subjects
Birn et al., NeuroImage (2013)
42. Q. What about amount of data?
A. Scan duration matters!
Finn et al., Nat Neurosci (2015)
• higher identifiability across subjects
‣ higher sampling rate (shorter TR) cannot
make up for shorter scan duration
Airan et al., Hum Brain Mapp (2016)
Longer acquisitions are better:
• higher reliability within subjects
Birn et al., NeuroImage (2013)
43. Q. What about amount of data?
A. Scan duration matters!
Finn et al., Nat Neurosci (2015)
• higher identifiability across subjects
‣ higher sampling rate (shorter TR) cannot
make up for shorter scan duration
Airan et al., Hum Brain Mapp (2016)
Shah et al., Brain & Behav (2016)
Longer acquisitions are better:
• higher reliability within subjects
Birn et al., NeuroImage (2013)
47. Q. Does scan condition matter?
A. Yes!
Rest has become the default condition for FC & individual differences,
but tasks may increase signal-to-noise
48. Q. Does scan condition matter?
A. Yes!
Rest has become the default condition for FC & individual differences,
but tasks may increase signal-to-noise
0.93 0.84 0.63
0.72 0.79 0.67
0.64 0.60 0.54
R1
WM
Mt
R2 Lg Em
Database
Target
ID rate
0.5 1.0
49. Q. Does scan condition matter?
A. Yes!
Rest has become the default condition for FC & individual differences,
but tasks may increase signal-to-noise
50. Q. Does scan condition matter?
A. Yes!
Rest has become the default condition for FC & individual differences,
but tasks may increase signal-to-noise
Finn et al., NeuroImage (2017)
51. Q. Does scan condition matter?
A. Yes!
Rest has become the default condition for FC & individual differences,
but tasks may increase signal-to-noise
Finn et al., NeuroImage (2017)
52. Q. Does scan condition matter?
A. Yes!
Rest has become the default condition for FC & individual differences,
but tasks may increase signal-to-noise
Finn et al., NeuroImage (2017)
53. Q. Does scan condition matter?
A. Yes!
Rest has become the default condition for FC & individual differences,
but tasks may increase signal-to-noise
Finn et al., NeuroImage (2017)
54. Q. Does scan condition matter?
A. Yes!
Rest has become the default condition for FC & individual differences,
but tasks may increase signal-to-noise
‣ for a set scan duration, tasks may be more reliable than rest
‣ tasks may converge faster on a subject’s “true” profile
Finn et al., NeuroImage (2017)
58. Q. Is rest best?
A. Probably not
Tasks may stabilize individuals’ functional architecture, increase SNR:
59. Q. Is rest best?
A. Probably not
‣ some task pairs give better ID than the two rest sessions
Tasks may stabilize individuals’ functional architecture, increase SNR:
60. Q. Is rest best?
A. Probably not
‣ some task pairs give better ID than the two rest sessions
Target
Database
Day 1 Day 2
IDrate
Day1Day2
Tasks may stabilize individuals’ functional architecture, increase SNR:
Finn et al., NeuroImage (2017)
61. Q. Is rest best?
A. Probably not
‣ some task pairs give better ID than the two rest sessions
Target
Database
Day 1 Day 2
IDrate
Day1Day2
‣ consider a combination of rest and task
Tasks may stabilize individuals’ functional architecture, increase SNR:
Finn et al., NeuroImage (2017)
62. Q. Is rest best?
A. Probably not
‣ some task pairs give better ID than the two rest sessions
Target
Database
Day 1 Day 2
IDrate
Day1Day2
‣ consider a combination of rest and task
Tasks may stabilize individuals’ functional architecture, increase SNR:
Finn et al., NeuroImage (2017)
Finn et al., Nat Neurosci (2015)
64. Q. Is rest best?
A. Probably not
Consider naturalistic tasks:
65. Q. Is rest best?
A. Probably not
Consider naturalistic tasks:
Inscapes: Vanderwal et al., NeuroImage 2015
headspacestudios.org
66. Q. Is rest best?
A. Probably not
Consider naturalistic tasks:
67. Q. Is rest best?
A. Probably not
Consider naturalistic tasks:
‣ ID rate is just as good as (if not better than) rest
68. Q. Is rest best?
A. Probably not
Consider naturalistic tasks:
Session 1
Rest Inscapes Ocean’s 11
Session 2
‣ ID rate is just as good as (if not better than) rest
69. Q. Is rest best?
A. Probably not
Consider naturalistic tasks:
Session 1
Rest Inscapes Ocean’s 11
Session 2
‣ ID rate is just as good as (if not better than) rest
Vanderwal et al., NeuroImage (2017)
70. Q. Is rest best?
A. Probably not
Consider naturalistic tasks:
Session 1
Rest Inscapes Ocean’s 11
Session 2
‣ ID rate is just as good as (if not better than) rest
Vanderwal et al., NeuroImage (2017)
72. Q. Is rest best?
A. Probably not
Tasks also have purely practical advantages:
73. ‣ increase subject compliance (i.e., decrease head motion), especially in certain populations
Q. Is rest best?
A. Probably not
Tasks also have purely practical advantages:
74. ‣ increase subject compliance (i.e., decrease head motion), especially in certain populations
Huijbers et al., NeuroImage (2017)
Q. Is rest best?
A. Probably not
Tasks also have purely practical advantages:
75. ‣ increase subject compliance (i.e., decrease head motion), especially in certain populations
ChildrenAdults
Vanderwal et al., NeuroImage (2015)Huijbers et al., NeuroImage (2017)
Q. Is rest best?
A. Probably not
Tasks also have purely practical advantages:
80. How to choose behavior
Is it stable?
• Trait vs. state
• State variables may be better
suited to within-subject analysis
81. How to choose behavior
Is it stable?
• Trait vs. state
• State variables may be better
suited to within-subject analysis
Betzel et al., Sci Rep (2017)
82. How to choose behavior
Is it stable?
• Trait vs. state
• State variables may be better
suited to within-subject analysis
Betzel et al., Sci Rep (2017)
83. How to choose behavior
Is it stable?
• Trait vs. state
• State variables may be better
suited to within-subject analysis
Betzel et al., Sci Rep (2017)
84. How to choose behavior
Is it stable?
Does it show a good distribution
in your population?
• Trait vs. state
• State variables may be better
suited to within-subject analysis
Betzel et al., Sci Rep (2017)
85. How to choose behavior
Is it stable?
Does it show a good distribution
in your population?
• Trait vs. state
• State variables may be better
suited to within-subject analysis
Betzel et al., Sci Rep (2017)
86. How to choose behavior
Is it stable?
Does it show a good distribution
in your population?
• Trait vs. state
• State variables may be better
suited to within-subject analysis
Betzel et al., Sci Rep (2017)
87. How to choose behavior
Is it stable?
Does it show a good distribution
in your population?
• Trait vs. state
• State variables may be better
suited to within-subject analysis
Betzel et al., Sci Rep (2017)
88. How to choose behavior
Is it stable?
Does it show a good distribution
in your population?
• Trait vs. state
• State variables may be better
suited to within-subject analysis
Betzel et al., Sci Rep (2017)
89. How to choose behavior
Is it stable?
Does it show a good distribution
in your population?
Is it something you expect to be
reflected in brain function?
• Trait vs. state
• State variables may be better
suited to within-subject analysis
Betzel et al., Sci Rep (2017)
92. Behavior: Mitigating confounds
Many behaviors/phenotypes are correlated with head motion!
Siegel et al., Cerebral Cortex (2016)
Negatively: Positively:
93. Behavior: Mitigating confounds
Many behaviors/phenotypes are correlated with head motion!
Siegel et al., Cerebral Cortex (2016)
Negatively: Positively:
Geerligs et al., Hum Brain Mapp (2017)
Age, vascular health:
96. Behavior: Mitigating confounds
Many behaviors/phenotypes are correlated with head motion!
‣ Check for correlation in your sample
‣ Consider excluding particularly high-motion subjects
97. Behavior: Mitigating confounds
Many behaviors/phenotypes are correlated with head motion!
‣ Check for correlation in your sample
‣ Consider excluding particularly high-motion subjects
‣ Choose appropriate preprocessing techniques
98. Behavior: Mitigating confounds
Many behaviors/phenotypes are correlated with head motion!
‣ Check for correlation in your sample
‣ Consider excluding particularly high-motion subjects
‣ Choose appropriate preprocessing techniques
Ciric et al., NeuroImage (2017)
99. Behavior: Mitigating confounds
Many behaviors/phenotypes are correlated with head motion!
‣ Check for correlation in your sample
‣ Consider excluding particularly high-motion subjects
‣ Choose appropriate preprocessing techniques
‣ Use motion as an explicit covariate
Ciric et al., NeuroImage (2017)
104. Brain behavior: Cross-validate!
Find a brain-behavior relationship in one sample, see if it holds in another sample
‣ leave-one-subject-out
(within dataset)
Connectome-based Predictive Modeling
Shen et al., Nature Protocols (2017)
105. Brain behavior: Cross-validate!
Find a brain-behavior relationship in one sample, see if it holds in another sample
‣ leave-one-subject-out
(within dataset)
Connectome-based Predictive Modeling
Shen et al., Nature Protocols (2017)
2
7.5
4
6.3
106. Brain behavior: Cross-validate!
Find a brain-behavior relationship in one sample, see if it holds in another sample
‣ leave-one-subject-out
(within dataset)
Connectome-based Predictive Modeling
Shen et al., Nature Protocols (2017)
2
7.5
4
6.3
107. Brain behavior: Cross-validate!
Find a brain-behavior relationship in one sample, see if it holds in another sample
‣ leave-one-subject-out
(within dataset)
Connectome-based Predictive Modeling
Shen et al., Nature Protocols (2017)
Predictedbehav
Observed behav
2
7.5
4
6.3
108. Brain behavior: Cross-validate!
Find a brain-behavior relationship in one sample, see if it holds in another sample
‣ leave-one-subject-out
(within dataset)
Connectome-based Predictive Modeling
Shen et al., Nature Protocols (2017)
Predictedbehav
Observed behav
2
7.5
4
6.3
109. Brain behavior: Cross-validate!
Find a brain-behavior relationship in one sample, see if it holds in another sample
‣ leave-one-subject-out
(within dataset)
Connectome-based Predictive Modeling
Shen et al., Nature Protocols (2017)
Predictedbehav
Observed behav
2
7.5
4
6.3
110. Brain behavior: Cross-validate!
Find a brain-behavior relationship in one sample, see if it holds in another sample
‣ leave-one-subject-out
(within dataset)
Connectome-based Predictive Modeling
Shen et al., Nature Protocols (2017)
Predictedbehav
Observed behav
2
7.5
4
6.3
111. Brain behavior: Cross-validate!
Find a brain-behavior relationship in one sample, see if it holds in another sample
‣ leave-one-subject-out
(within dataset)
Connectome-based Predictive Modeling
Shen et al., Nature Protocols (2017)
Predictedbehav
Observed behav
2
7.5
4
6.3
112. Brain behavior: Cross-validate!
Find a brain-behavior relationship in one sample, see if it holds in another sample
‣ leave-one-subject-out
(within dataset)
Connectome-based Predictive Modeling
Shen et al., Nature Protocols (2017)
Predictedbehav
Observed behav
2
7.5
4
6.3
113. Brain behavior: Cross-validate!
Find a brain-behavior relationship in one sample, see if it holds in another sample
‣ leave-one-subject-out
(within dataset)
Connectome-based Predictive Modeling
Shen et al., Nature Protocols (2017)
Predictedbehav
Observed behav
2
7.5
4
6.3
114. Brain behavior: Cross-validate!
Find a brain-behavior relationship in one sample, see if it holds in another sample
‣ leave-one-subject-out
(within dataset)
Connectome-based Predictive Modeling
Shen et al., Nature Protocols (2017)
Predictedbehav
Observed behav
2
7.5
4
6.3
115. Brain behavior: Cross-validate!
Find a brain-behavior relationship in one sample, see if it holds in another sample
‣ leave-one-subject-out
(within dataset)
Connectome-based Predictive Modeling
Shen et al., Nature Protocols (2017)
Predictedbehav
Observed behav
2
7.5
4
6.3
116. Brain behavior: Cross-validate!
Find a brain-behavior relationship in one sample, see if it holds in another sample
‣ leave-one-subject-out
(within dataset)
‣ even better: cross-dataset
Sustained attention model
Connectome-based Predictive Modeling
Shen et al., Nature Protocols (2017)
Predictedbehav
Observed behav
2
7.5
4
6.3
Rosenberg et al., Nature Neuroscience (2016)
Rosenberg et al., Trends in Cog Sci (2017)
117. Brain behavior: Cross-validate!
Find a brain-behavior relationship in one sample, see if it holds in another sample
‣ leave-one-subject-out
(within dataset)
‣ even better: cross-dataset
Sustained attention model
Connectome-based Predictive Modeling
Shen et al., Nature Protocols (2017)
Predictedbehav
Observed behav
2
7.5
4
6.3
Rosenberg et al., Nature Neuroscience (2016)
Rosenberg et al., Trends in Cog Sci (2017)
Observed behav
Predictedbehav
n = 25 adults
118. Brain behavior: Cross-validate!
Find a brain-behavior relationship in one sample, see if it holds in another sample
‣ leave-one-subject-out
(within dataset)
‣ even better: cross-dataset
Sustained attention model
Connectome-based Predictive Modeling
Shen et al., Nature Protocols (2017)
Predictedbehav
Observed behav
2
7.5
4
6.3
Rosenberg et al., Nature Neuroscience (2016)
Rosenberg et al., Trends in Cog Sci (2017)
Observed behav
Predictedbehav
n = 25 adults
Observed ADHD score
n = 113 children
PredictedADHDscore
121. Q. What is the best brain state?
A. Maybe it depends on your behavior
122. Q. What is the best brain state?
A. Maybe it depends on your behavior
Certain task conditions generate better predictions of behavior:
123. Q. What is the best brain state?
A. Maybe it depends on your behavior
n = 716, 10-fold cross-validation
Connectome-based Predictive Modeling (CPM; Shen et al., Nat Protocols 2017)
Modelinputdata
Target behavior
Certain task conditions generate better predictions of behavior:
124. Q. What is the best brain state?
A. Maybe it depends on your behavior
n = 716, 10-fold cross-validation
Connectome-based Predictive Modeling (CPM; Shen et al., Nat Protocols 2017)
Modelinputdata
Target behavior
Certain task conditions generate better predictions of behavior:
Consider tailoring scan condition
to behavior of interest
➡“Stress test”?
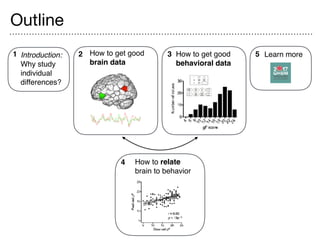
129. Take-home points
Introduction:
Why study
individual
differences?
1 How to get good
brain data
2 How to get good
behavioral data
3
How to relate
brain to behavior
4
Learn more5
• Data quality ≠ critical
• Longer scans are better!
• Consider using tasks
‣ improve compliance
130. Take-home points
Introduction:
Why study
individual
differences?
1 How to get good
brain data
2 How to get good
behavioral data
3
How to relate
brain to behavior
4
Learn more5
• Data quality ≠ critical
• Longer scans are better!
• Consider using tasks
‣ improve compliance
‣ increase sensitivity
131. Take-home points
Introduction:
Why study
individual
differences?
1 How to get good
brain data
2 How to get good
behavioral data
3
How to relate
brain to behavior
4
Learn more5
• Data quality ≠ critical
• Longer scans are better!
• Consider using tasks
‣ improve compliance
‣ increase sensitivity
• Choose an interesting
behavior with a good
distribution
132. Take-home points
Introduction:
Why study
individual
differences?
1 How to get good
brain data
2 How to get good
behavioral data
3
How to relate
brain to behavior
4
Learn more5
• Data quality ≠ critical
• Longer scans are better!
• Consider using tasks
‣ improve compliance
‣ increase sensitivity
• Choose an interesting
behavior with a good
distribution
• Consider potential
confounds and take
steps to mitigate them
133. Take-home points
Introduction:
Why study
individual
differences?
1 How to get good
brain data
2 How to get good
behavioral data
3
How to relate
brain to behavior
4
Learn more5
• Data quality ≠ critical
• Longer scans are better!
• Consider using tasks
‣ improve compliance
‣ increase sensitivity
• Choose an interesting
behavior with a good
distribution
• Consider potential
confounds and take
steps to mitigate them
• Cross-validate whenever
possible
134. Take-home points
Introduction:
Why study
individual
differences?
1 How to get good
brain data
2 How to get good
behavioral data
3
How to relate
brain to behavior
4
Learn more5
• Data quality ≠ critical
• Longer scans are better!
• Consider using tasks
‣ improve compliance
‣ increase sensitivity
• Choose an interesting
behavior with a good
distribution
• Consider potential
confounds and take
steps to mitigate them
• Cross-validate whenever
possible
• Consider tailoring your
scan condition to
behavior of interest
135. Take-home points
Introduction:
Why study
individual
differences?
1 How to get good
brain data
2 How to get good
behavioral data
3
How to relate
brain to behavior
4
Learn more5
• Data quality ≠ critical
• Longer scans are better!
• Consider using tasks
‣ improve compliance
‣ increase sensitivity
• Choose an interesting
behavior with a good
distribution
• Consider potential
confounds and take
steps to mitigate them
• Cross-validate whenever
possible
• Consider tailoring your
scan condition to
behavior of interest
136. Open data sets with brain & behavior
➡ Use these on their own or in combination with your own data
to generate or test hypotheses, see if a finding generalizes, etc
Philadelphia Neurodevelopmental
Cohort
137. Further reading
Building a science of individual differences from fMRI
Dubois & Adolphs, Trends in Cognitive Sciences (2016)
From regions to connections and networks: new bridges
between brain and behavior
Misic & Sporns, Current Opinion in Neurobiology (2016)
Can brain state be manipulated to emphasize individual
differences in functional connectivity?
Finn et al., NeuroImage (2017)
Prediction as a humanitarian and pragmatic contribution from
human cognitive neuroscience
Gabrieli, Ghosh & Gabrieli, Neuron (2015)
Selected reviews:
138. Learn more at OHBM 2017
Symposium:
Collect your thoughts: Individual differences in the networks underlying intelligence
Tues 8:00-9:15am
Symposium:
Relating connectivity to inter- and intra-individual differences in attention and cognition
Weds 8:00-9:15am
Poster #4042: Can brain state be manipulated to emphasize individual differences in
functional connectivity? Finn et al.
Poster #4040: Large-scale functional connectivity networks predict attention
fluctuations Rosenberg et al.
Poster #2110: Functional connectivity-based predictors of naturalistic reading
comprehension Jangraw et al.
Poster #4029: FMRI connectivity is differentially associated with performance
across tasks in a multi-task study Topolski et al.
@esfinn