1. Foreign Exchange StrategyFixed Income StrategyFixed Income ResearchEmerging Markets Strategy Portfolio StrategyEconomics
Weekly commentary on economic and financial market developments
Global Views
Corporate Bond Research
Contact Us
Global Views is available on scotiabank.com, Bloomberg at SCOT and Reuters at SM1C
June 6, 2014
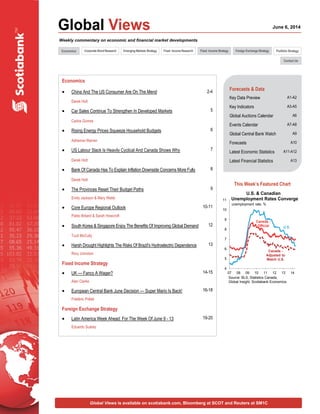
This Week’s Featured Chart
Key Data Preview A1-A2
Key Indicators A3-A5
Global Auctions Calendar A6
Events Calendar A7-A8
Global Central Bank Watch A9
Forecasts A10
Latest Economic Statistics A11-A12
Latest Financial Statistics A13
Forecasts & Data
Economics
China And The US Consumer Are On The Mend 2-4
Derek Holt
Car Sales Continue To Strengthen In Developed Markets 5
Carlos Gomes
Rising Energy Prices Squeeze Household Budgets 6
Adrienne Warren
US Labour Slack Is Heavily Cyclical And Canada Shows Why 7
Derek Holt
Bank Of Canada Has To Explain Inflation Downside Concerns More Fully 8
Derek Holt
The Provinces Reset Their Budget Paths 9
Emily Jackson & Mary Webb
Core Europe Regional Outlook 10-11
Pablo Bréard & Sarah Howcroft
South Korea & Singapore Enjoy The Benefits Of Improving Global Demand 12
Tuuli McCully
Harsh Drought Highlights The Risks Of Brazil’s Hydroelectric Dependence 13
Rory Johnston
Fixed Income Strategy
UK — Fancy A Wager? 14-15
Alan Clarke
European Central Bank June Decision — Super Mario Is Back! 16-18
Frédéric Prêtet
Foreign Exchange Strategy
Latin America Week Ahead: For The Week Of June 9 - 13 19-20
Eduardo Suárez
4
5
6
7
8
9
10
11
07 08 09 10 11 12 13 14
U.S. & Canadian
Unemployment Rates Converge
Source: BLS, Statistics Canada,
Global Insight, Scotiabank Economics.
unemployment rate, %
U.S.
Canada -
Official
Canada -
Adjusted to
Match U.S.
2. Economics
Global Views
June 6, 2014
2
China And The US Consumer Are On The Mend
Please see our full indicator, central bank, auction and event calendars on pp. A3-A9.
Asia-Pacific — Chinese Exports In Recovery Mode
China’s economy is on the mend compared to concerns that spanned the winter months. That should be
more evident in next week’s trade figures that hit markets into the Monday open and which should be a
constructive influence. Exports are expected to resume material growth in the six-handled percentage range
from year-ago levels compared to an 18% rate of annual decline this past February that had spooked markets.
At issue is that the base effect of artificially strong export growth a year ago will fully drop out of the figures for
this May as the year-ago reference point shifts to a much softer trajectory than had been evident over the first
several months of 2013. What’s going on? Over a year ago, the yuan was appreciating and that fed efforts by
exporters to over-invoice their reported figures as a natural hedge. That then transitioned toward under-invoicing
earlier this year as the People’s Bank of China moved to widen the trading bands around the yuan and push it
toward the lower end through a concerted effort to depreciate the currency which, in turn, motivated the opposite
desire to hedge against currency movements by reporting artificially low figures. This effect has now largely
shaken off. While many economists realized it as a distorting influence on trade growth over the past year,
markets did not understand this argument terribly well and took the weakness in reported export figures earlier
this year at face value instead of treating it as a data head fake, at least in part.
Also due out will be Chinese figures for CPI inflation, credit growth, retail sales, and industrial production. As the
government increases spending on targets including railways and broader infrastructure and the
People’s Bank of China lowers reserve ratio requirements and injects fresh liquidity into markets, the
policy bias in China is to take out insurance against further downside risks in an effort to preserve its
7.5% GDP growth target. Default risks across China’s shadow banking sector remain material over 2014H2 but
improved fundamentals may be a significant offset from a market standpoint.
The Reserve Bank of New Zealand is widely expected to hike its policy rate by 25bps for the third straight
time while other Asian central banks remain on hold in policy decisions from the Bank of Japan, Bank Indonesia
and Bank of Korea. Across the Tasman Sea, the Reserve Bank of Australia has faced considerably improved
employment trends so far this year compared to the concerns over 2013H2. Next week’s Australian employment
report should continue this positive backdrop and that’s part of the reason behind the renewed appreciation in
the Australian dollar over the course of this year. The Bloomberg consensus of economists anticipates rate
increases by the end of this year or early next year.
Whether India continues to witness ebbing inflation will be a regional focal point in the wake of the drop from over
11% yearly gains in consumer prices late last year to sub 9% this year. Regional data will be rounded out via export
figures from India and the Philippines, and industrial production figures for South Korea, India and Malaysia.
Canada — Ontario Election Uncertainties
Ontario’s provincial election will be held on Thursday and the results will
be available shortly after polls close that evening. Recent polls have
been volatile and have failed to point to one party being clearly and
consistently in the lead. Polls of individual voter intentions, however, are
of limited use in a first-past-the-post electoral system and given a fair
undecided component that can swing abruptly by the actual voting day.
Ask Quebeckers or British Columbians based upon their relatively
recent electoral experiences. We’re therefore offering little by way of
guidance over a potential victor.
Data flow will pose modest domestic market risk and will book-end the
week. Housing starts for May arrive on Monday and they are expected
Derek Holt (416) 863-7707
derek.holt@scotiabank.com
THE WEEK AHEAD
2
15
20
25
30
35
40
45
05/03 05/08 05/13 05/18 05/23 05/28 06/02
Ontario Election Opinion Poll Results
Liberals
Conservative
NDP
%
2
3. Economics
Global Views
June 6, 2014
3
… continued from previous page
to track somewhat lower given the decline in the volume of residential building permits into Spring.
Manufacturing shipments for April land on Friday and they are expected to notch the fourth straight monthly
gain.
Also note that BoC Governor Stephen Poloz and the recently promoted Senior Deputy Governor Carolyn
Wilkins will hold a joint press conference to release the BoC’s Financial System Review on Thursday.
Anything is fair game in the press conference, though it’s likely that Governor Poloz will stick to the
same script as the recent BoC statement. Having said that, an astute reporter would be wise to probe
for much more detailed perspectives from the BoC on why it continues to worry about downside risks
to inflation. In fact, the more granular work on export prospects that has been done recently by the BoC
could be wisely followed up — or should have been preceded — by much more granular work on inflation
risks given that it’s price stability that is the BoC’s official mandate. Also note that Canada auctions 30 year
real return bonds on Wednesday.
US — How Much Pent-Up Consumer Demand Will Be Released In Q2?
How much pent-up consumer demand may be released into Q2 following weather-interrupted
spending patterns in Q1? This is not the only question behind our bullish view on Q2 GDP growth, but it’s a
key one, and retail sales for the month of May will advance the debate in what we expect to be a positive way.
April’s 0.3% inflation-adjusted decline in total consumer spending followed a rise of 0.8% in March and just
meant that some of the March surge was taken back on base effects. That was also true of narrower retail
sales that climbed 1.3% m/m in March in inflation-adjusted terms and then slipped 0.2% in April. It’s now
possible that the April softness will give way to the resumption of solid growth over the rest of the quarter.
Indeed, monthly total spending gains of about 0.5% per month in May and June would lift the inflation-
adjusted quarterly consumption gain to 3.8% in Q2 over Q1 assuming no revisions. That’s very possible in my
view. It will take until the end of the month to get a handle on total consumption, but next Thursday’s retail
sales print for May will provide solid guidance. In the wake of the roughly 5% rise in the volume of auto sales
during May and a modest rise in gasoline prices, we’re expecting a fairly solid retail sales gain on the month.
In a broader sense, the consumer drivers are becoming
considerably more favourable. Levels of employment and hours
worked have now recovered all of the crisis losses and moved to new
record highs (see chart). Debt service payments as a share of
incomes are at a record low as households abstained from borrowing
and refinanced at record lower fixed mortgage rates. Net worth is at a
record high, and over two years of house price gains have motivated
material trickle-down effects onto main street that raise modest
prospects for wealth effects on consumption. Improved house prices
have resulted in a sharp reduction in under-water mortgages over the
last 12-24 months, and fewer people are asking for permission to
engage in short sales or foreclosure sales since they are incorporating
capital gains expectation into the housing equation. Against this
backdrop, unsold new housing inventories have never been leaner,
and resale housing inventories are sharply abating; the combined
effects will be to force builders to put more shovels in the ground to
meet trend growth in new home sales over our forecast horizon.
Lowered credit scores at some key US banks and a sharp rise in jumbo mortgages over the past year are
signs that lenders are in the nascent phase of easier lending conditions in recognition of the vastly improved
household fundamentals — and with more to come in our view. Our advice remains to get behind this
sharp improvement in the household sector and its ability to drive a material pick-up in growth this
quarter and over the longer haul.
Derek Holt (416) 863-7707
derek.holt@scotiabank.com
THE WEEK AHEAD
128
130
132
134
136
138
140
90
92
94
96
98
100
102
06 07 08 09 10 11 12 13 14
Source: BLS, Bloomberg, Scotiabank Economics.
millions
Who Says Employment Markets
Remain A Consumer Headwind?
U.S. Aggregate
Weekly Hours (LHS)
U.S. Non-farm
Payrolls (RHS)
index, 2007=100
4. Economics
Global Views
June 6, 2014
4
… continued from previous page
Other releases will be less significant including the latest University of Michigan consumer sentiment on
Friday, and whether weekly jobless claims continue to shake off Memorial Day holiday distortions. The US
auctions 3s, 10s and 30s, and Federal Reserve speak will be focused upon St. Louis Fed President James
Bullard and Boston Fed President Eric Rosengren.
Europe — Rebound At European Factories?
European markets won’t really matter to the global risk trade next week because the macro release and
event schedules are pretty tame. If anything, a modest data schedule should be constructive via expectations
for rebounds in industrial production in countries like France, the UK and Italy. The UK unemployment rate is
expected to hit a new low point not reached since early 2009, while the National Institute of Economic & Social
Research’s monthly GDP print that tracks growth over the preceding three months will reach for the
seventeenth consecutive rise and the fourteenth straight month above a half-point rise, but against the
backdrop of a tough to continue trend of 1% or slightly lower monthly gains over the past three months. The
accelerating pattern of growth is accompanied by house price pressures that have been partly motivated by
the Bank of England’s funding-for-lending scheme that — unlike the ECB’s recently announced program —
does not exclude mortgages.
Derek Holt (416) 863-7707
derek.holt@scotiabank.com
THE WEEK AHEAD
5. Economics
Global Views
June 6, 2014
5
Car Sales Continue To Strengthen In Developed Markets
Sales pace improves in all regions.
Car sales in the major developed nations of North America, Western
Europe and Japan accelerated in May, climbing 7% y/y, up from a
5% gain through April. The improvement was led by a 10.5%
advance in the United States, but sales also quickened in other
regions. In particular, while purchases in Japan remained below a
year earlier in response to a hike in the sales tax in April, the decline
eased to only 5.6% y/y — half of the previous month’s fall-off. The
strengthening in car sales across the developed world is consistent
with recent data pointing to a pick-up in global economic growth
during the month of May. In particular, several indicators suggest
that new order activity accelerated last month, lifting the backlogs for
both manufacturers and service providers.
In the United States, passenger vehicle sales climbed to a
seasonally adjusted 16.7 million units in May, the highest level in
nearly eight years and well above the 16.1 million units that had
been expected. The improvement reflects a strengthening labour
market and healthy household balance sheets that are enabling households to replace their aging clunkers
with top quality new vehicles. As in previous months, crossover utility vehicles (CUVs) led the way. CUV sales
jumped 19% y/y in May and now total nearly double the level of mid-2005 when overall U.S. passenger
vehicle volumes hit a monthly peak of more than 20 million units. CUVs became the largest segment of the
U.S. auto market in 2009 and now account for 27% of overall sales, 7 percentage points above the previous
market leader — mid-size cars.
Despite CUVs outperforming, purchases advanced above a year earlier in every segment, prompting
automakers to boost their third-quarter North American production schedule to an annualized 17.4 million
units, up from 17.1 million units in the second quarter. This represents the highest level since the first half of
2000, when vehicle assemblies in North America reached a peak of more than 18 million units. Mexico will
post the largest gain, with vehicle output climbing 9% above a year earlier due to the recent opening of
several new auto assembly plants by Japanese automakers. However, production will also strengthen in both
the United States and Canada.
Passenger vehicle sales in Canada set a record last month, climbing to an annualized 1.89 million units and
surpassing the previous peak of 1.88 million set in January 2008. As in the United States, the rapidly growing
CUV segment led the way, soaring 17% above a year earlier. The record-setting sales pace of recent months
combined with the recent launch of ‘employee pricing’ by General Motors, virtually guarantees that full-year
2014 Canadian sales will climb to record highs. April through June are the industry’s highest volume months,
accounting for more than 30% of overall annual sales.
Purchases in the four largest auto markets of Western Europe rose 3% above a year earlier, even as activity
weakened in Italy. The United Kingdom led the way, but purchases rebounded in Germany — the largest
market in the region — alongside strengthening economic conditions. The German economy expanded 0.8%
quarter-over-quarter in the opening months of 2014, the fastest pace in three years. Consumer confidence is
at the highest level in more than seven years, lifting vehicle replacement demand. For example, used car
prices — a leading indicator of new vehicle sales — have been gaining momentum over the past year and are
now surging 16% y/y, one of the fastest gains on record. This represents a sharp reversal from declining
prices through the opening months of 2013, and is a clear indication of the improving auto industry
fundamentals in Germany.
Carlos Gomes (416) 866-4735
carlos.gomes@scotiabank.com
AUTOS
5
7
9
11
13
15
17
19
07 08 09 10 11 12 13 14
Auto Sales Strengthen
United States
Western
Europe
millions of units, 3MMA
Source: Scotiabank Economics.
6. Economics
Global Views
June 6, 2014
6
Rising Energy Prices Squeeze Household Budgets
Rising energy prices are eroding the purchasing power of Canadian households, and will
likely reinforce a more cautious consumer spending profile over the coming year.
The average cost of energy products and other utilities used in household operations and motor vehicle
transportation has risen roughly 5% this year, amid broad-based increases in gasoline, fuel oil, natural gas,
electricity and water. Spending on energy products is fairly inelastic in the short-term, as most households are
limited in their ability to quickly or substantially alter their daily household activities and/or driving patterns. A 5%
increase in average energy prices could divert as much as $4 billion from other less discretionary purchases.
Despite conservation efforts and technological efficiency advances, the share of household expenditures
allocated to energy products and other utilities has been trending higher since the late-1990s. Outlays totaled
a record $88 billion (annualized) in the first quarter of 2014, accounting for 8½% of all household expenditures
— about a percentage point above its long-term average (chart 1).
A discernible long-term upward trend in the cost of energy products is fuelling the growing household energy
bill. The retail price of gasoline, fuel oil, electricity and water have all notably outpaced broad inflation since
the 1980s, and increasingly so since the new millennium (chart 2). Natural gas prices also outpaced inflation
over this period, though pressures have eased in recent years as new production technologies bolster North
American supplies.
The rapid expansion in industrial activity among emerging markets has
been a major factor in lifting global energy demand. Meanwhile,
periodic bouts of geopolitical tension have added to supply concerns.
Domestically, the pressures of population growth, industrial expansion
and aging infrastructure have raised electricity and water costs.
Gasoline accounts for roughly half of household energy
expenditures. Its share of the average household budget has
steadily increased over the past decade and a half, reversing the
declining trend from the early 1980s through the mid-1990s. In part,
significant gains in motor vehicle fuel efficiency have been
moderated by a shift in consumer preferences toward less fuel-
efficient light trucks.
Given the potential for real energy prices to continue to drift higher
over the medium term, there is a strong economic incentive for
Canadians to reduce their energy consumption — or at least slow its
rise. Any potential savings could be redirected to other spending,
saving or paying down debt. Longer-term, reducing energy
consumption would lower the sensitivity of household spending and
the overall economy to any future price shocks.
Encouragingly, progress is being made in home energy efficiency.
As a share of household spending, housing-related energy costs
have trended lower over the past two decades. Increased energy
demand stemming from growing air conditioning use and the
proliferation of personal computers and electronic devices has been
offset by improvements in efficiency in a number of areas, including
home heating systems, appliances and lighting fixtures. Canada’s
housing stock itself is becoming more energy efficient, reflecting the
elevated pace of new construction and renovation activity, as well as
the growing shift to less energy-intensive high-density living.
Adrienne Warren (416) 866-4315
adrienne.warren@scotiabank.com
CANADA
0
100
200
300
400
500
600
80 85 90 95 00 05 10
Chart 2: Consumer Prices
Source: Statistics Canada, Scotiabank Economics
index 1980=100
Gasoline
Total CPI
Water, Fuel
& Electricity
6
7
8
9
10
80 85 90 95 00 05 10
Chart 1: Household Spending
On Energy & Other Utilities
Source: Statistics Canada, Scotiabank Economics
% of total expenditures
1981-2013 average
7. Economics
Global Views
June 6, 2014
7
US Labour Slack Is Heavily Cyclical And Canada Shows Why
Evidence from Canada shows why a sharp decline in the US labour force participation
rate is heavily cyclical and not mostly demographics.
There is more slack in the US labour market than commonly accepted and
Canada’s experience helps to prove this point. This conclusion figures
prominently into the debate over the efficacy of Federal Reserve policy actions
and the pace of withdrawing monetary policy stimulus.
That's because the two countries offer a unique way of testing the theory that an
aging workforce explains most of the drop in the US labour force participation rate
by virtue of the fact that the age structures of their populations are nearly identical.
As chart 1 depicts, the two countries' population pyramids are very close to one
another. The US is a little heavier in the younger tail thanks to a higher fertility rate
particularly across the southern states (to the greater benefit of US housing and
consumer markets than Canada’s), but the share of the populations represented
in all other age cohorts are a near-perfect match to one another. Therefore, if
demographics really is such an obvious and dominating influence on movements
in the labour force participation rate, then both countries should have experienced
comparable declines in their labour force participation rates as baby boomers
age into retirement.
Not so, however, in that the steep decline in the US participation rate has
exceeded Canada's by several orders of magnitude (chart 2), and this is true
even after accounting for measurement differences. Canada’s participation rate
has dropped from a peak of 67.8% in late 2007 to 66.1% as of last month. The
US participation rate has declined from 66.4% in early 2007 to 62.8% now. The
decline of 1.7 points in the Canadian rate is less than half of the 3.6 point decline
in the US over this similar period. Furthermore, some of the decline in the
Canadian labour force participation rate is also likely to have been cyclical itself,
and the slightly older age structure of the Canadian population should mean that
Canada would have a bigger participation rate problem than the US if
demographics really were the main culprit.
One might retort that the smaller decline in the Canadian rate is because the
two economies have performed very differently over the crisis era as Canada
ran a better banking sector, had a stronger fiscal position, prospered under
supportive commodity prices, and had its deep crisis in the 1990s. That's
precisely our point! It's the economy and non-demographic factors that matter
more than demographics. Indeed even the disastrous early 1990s Canadian
experience taught us that.
It may well be that over time an additional insulating factor against demographic
change could be that older cohorts are choosing to remain attached to the work
force longer than previously. Chart 3 makes this point and what’s remarkable is
how rising participation rates for workers aged over 55 fly in the face of the broader
decline in the economy’s participation rate even though there remains a steep
drop-off on participation rates from the under-50 cohorts into the over-55 groups.
The broadest implication here is that by using the Canadian example we side
more with the Fed's bias that much of the decline in the participation rate is
cyclical. That, in turn, could keep the pace of monetary belt tightening
relatively slow in terms of this one consideration.
US-CANADIAN MACRO COMMENT
Derek Holt (416) 863-7707
derek.holt@scotiabank.com
60
61
62
63
64
65
66
67
68
69
76 82 88 94 00 06 12
Source: BLS, Statistics Canada,
Scotiabank Economics.
%
Participation Rates
U.S.
Participation
Rate
Canada
Participation
Rate
0.0
1.0
2.0
3.0
4.0
5.0
6.0
7.0
8.0
9.0
0-4 10-
14
20-
24
30-
34
40-
44
50-
54
60-
64
70-
74
80-
84
Canada
(2013)
U.S. (2012)
Source: Statistics Canada, U.S. Census Bureau
US and Canadian Population
Pyramids Are Identical
Age Cohorts
%
0
10
20
30
40
50
60
70
50 58 66 74 82 90 98 06 14
Source: BLS, Scotiabank Economics.
US participation rates, %
Older Cohorts On The Rise
Ages 55-64
Ages 65+
8. Economics
Global Views
June 6, 2014
8
Bank Of Canada Has To Explain Inflation Downside Concerns More Fully
Does the BoC still stand by inflation pass-through estimates?
As we had expected, the latest BoC policy statement referenced
how headline inflation has risen back to target "sooner than
anticipated" and core "has drifted up slightly." Thus far, the
BoC’s messaging is consistent with our view that its
ambivalence toward the direction of the next rate move and
warnings about downside risks to inflation are potentially
on the way out later in the summer in favour of greater
emphasis being placed upon long-pause arguments. The
recent June policy statement could therefore represent a first
step toward softening the argument as a necessary
acknowledgement that inflation has bounced off of its lows in
2013.
Although that path may lie ahead, the BoC is not going there just
yet. The BoC said that "increased risks to economic growth
leave downside risks to the inflation outlook as important as
before," but that perspective is likely to become less defensible
as the summer wears on. Ditto on the growth risks which appear
to be a backward-looking assessment at Q1 weather effects, as
a Q2 acceleration from a soft Q1 is likely, including on the export
side after a very soft Q1. Indeed, the BoC faces a greater sales
job to explain why in the near-term "downside risks to the
inflation outlook [are] as important as before" which we see
differently. We would expect much greater depth on the issue in
the July MPR to be convinced that the BoC is correctly flagging
such downside risks to inflation. A full update on BoC thinking
toward import-price pass-through effects would be helpful as
import price inflation sharply accelerates (chart 1), and in a
broadly based manner (chart 2) — something the BoC has only
recently begun to acknowledge. It’s possible that such pressures
get absorbed in record-high retailer and wholesaler margins
(chart 3), but this is by no means clear to us.
The ultimate key here may be
whether the BoC still stands by
its prior estimate that a 10%
trade-weighted depreciation in
CAD (which lies within the
recent experience) lifts core
inflation by a half percent within
two years (chart 4). If so, why
the downsides talk? One
complication is that this estimate
is drawn from a sample period
that is skewed toward the pre-
crisis environment. The reality
remains, however, that the
BoC’s inflation forecasts have
been too low this year (see page
7 here).
CANADIAN MONETARY POLICY
Derek Holt (416) 863-7707
derek.holt@scotiabank.com
-15
0
15
30
-2.5
0.0
2.5
5.0
10 12 14
CPI, Y/Y (LHS)
Import Prices, Y/Y (RHS)
%
Source: Statistics Canada, Scotiabank Economics
Canada Import Prices
Pass Through to CPI to Materialize?
%
-20 -15 -10 -5 0 5 10 15
Other
Animal and vegetable oils
Machinery and transport
Beverages and tobacco
Mineral fuels
Crude materials
Total
Miscellaneous mfg. articles
Manufactured goods
Chemicals
Food and live animals
Broadly Based Import Price Pressures
Source: Statistics Canada, Scotiabank Economics.
Apr 2014 y/y %
change by category of
import price
9. Economics
Global Views
June 6, 2014
9
The Provinces Reset Their Budget Paths
The challenge of sustainable deficit elimination spurs new policy.
This week’s Budget from Quebec’s new administration leaves the combined provincial deficit for fiscal 2013-
14 (FY14) at $14.2 billion, wider than the aggregate shortfall from the spring 2013 Budget estimates. The
FY14 combined provincial deficit may, in fact, narrow significantly early this summer when the three most
western Provinces release their final FY14 results incorporating the buoyant late FY14 oil & natural gas prices.
For FY15, this spring’s Budgets indicate three Provinces expecting black ink and a combined deficit narrowing
to $13.6 billion, similar to the final FY13 level. With six Provinces deferring their balanced budget targets, and
capital programs for FY15 raised in several jurisdictions, aggregate provincial debt has shifted higher. The
revised mid-decade peak in their aggregate debt burden, however, is still expected to remain below the high
of the mid-1990s at just over 33% of GDP.
The Provinces over the past year have faced setbacks, including in several cases a significantly slower-than-
expected economic expansion. For calendar 2014, Scotiabank Economics in January 2013 forecast for
Canada a 2.4% rise in real GDP, a 4.3% increase in nominal GDP and a 1.2% gain in employment (side
chart). In our latest forecast on May 29th
, our projections for
2014 are lower at 2.2%, 3.6% and 0.8%, respectively. We still
expect Canada’s nominal GDP growth, a broad proxy for
government revenue gains, to reach 4.0%, but in 2015.
Importantly, the assist from a strengthening U.S. economy
should benefit provinces such as New Brunswick, Quebec and
Ontario that are seeking broader expansion.
There is some evidence across the provinces of ‘austerity
fatigue’ following consecutive years of restraint. Yet the
setbacks in a number of instances have spurred longer-term
adjustments, in retirement benefits and other areas, to achieve
more sustainable paths. Quebec’s new Budget responds to
the possibility of a substantially wider FY15 shortfall by
outlining the first steps in an extensive two-year restructuring
covering taxes (plus tax expenditures) and government
services.
Mary Webb (416) 866-4202
mary.webb@scotiabank.com
Emily Jackson (416) 863-7463
emilyj.jackson@scotiabank.com
FISCAL
Target for
FY15b Balance
$Ch vs $Ch vs $ Ch $ Ch. $ Ch. Budget
FinalBud Rev Final Bud Rev Final vs Bud Final vs Bud. Rev. vs Bud. 2014 FY10 FY11 FY12 FY13 FY14r FY15b
NL -33 262 594 109 974 915 -195 -204 -349 215 -538 -0.1 2.0 2.9 -0.6 -0.9 -1.4 FY16
PE -74 10 -63 -9 -84 -42 -79 -4 -52 7 -40 -1.5 -1.2 -1.6 -1.4 -0.9 -0.7 FY16
NS -269 219 585 138 -256 134 -302 -91 -562 -579 -279 -0.8 1.6 -0.7 -0.8 -1.4 -0.7 FY18
NB -696 47 -618 122 -245 204 -508 -325 -564 -85 -391 -2.4 -2.1 -0.8 -1.6 -1.8 -1.2 FY18
QC -3,174 1,083 -3,150 1,050 -2,628 1,172 -1,600 0 -3,100 -3,100 -2,350 -1.0 -1.0 -0.8 -0.4 -0.8 -0.6 FY16
ON -19,262 2,068 -14,011 2,675 -12,969 3,347 -9,220 5,600 -11,300 443 -12,505 -3.2 -2.2 -2.0 -1.4 -1.6 -1.8 FY18
MB -185 370 -181 286 -1,001 -563 -580 -120 -432 86 -357 -0.4 -0.3 -1.8 -1.0 -0.7 -0.6 FY17
SK -409 -384 -13 609 -105 -159 37 23 591 441 71 -0.7 0.0 -0.1 0.0 0.7 0.1 Surplus
AB** 0 0 0 0 0 0 0 0 1,393 1,844 2,644 0 0 0 0 0.4 0.8 Surplus
BC -1,810 965 -241 1,024 -1,814 -889 -1,146 -178 175 22 184 -0.9 -0.1 -0.8 -0.5 0.1 0.1 Surplus
All Prov. -25,912 4,640 -17,098 6,004 -18,128 4,118 -13,592 4,701 -14,200 -706 -13,560 -1.7 -1.0 -1.0 -0.8 -0.7 -0.7
Federal -55,598 -1,798 -33,372 2,828 -26,279 6,021 -18,929 2,171 -13,800 4,900 -3,600 -3.5 -2.0 -1.5 -1.0 -0.7 -0.2 FY16
__________
* Post-transfer. QC pre-transfer FY10 final: -$3.6 bn.; Ontario's FY13 Budget estimate includes April 2012 changes. ** Alberta pre-transfer consolidated deficits on a Fiscal Plan basis are: FY10: -$1.0 bn;
FY11:-$3.4 bn; FY12:-$23 mn; FY13:-$2.8 bn. Alberta for FY14 and FY15: operational balances. Source: Provincial documents; Statistics Canada; nom. GDP & fed. deficit fcsts: Scotiabank Economics.
The Provinces' Budget Balances*
$ millions unless otherwise noted
FY10 FY11 FY12 FY13 FY14r % of GDP
0
1
2
3
NL PE NS NB QC ON MB SK AB BC CA
Jan. 31, 2013
May 29, 2014
Scotiabank Economics
Employment Forecasts
annual % change, 2014
Forecast Prepared:
* May 29, 2014, employment forecast for NS: 0%.
Source: Scotiabank Economics, Global Forecast Update.
10. Economics
Global Views
June 6, 2014
10
Core Europe Regional Outlook
Economic, debt and financial market stabilization is ongoing in the region, but downside
risks to the recovery and longer-term structural challenges remain.
Uneven Growth & Monetary Policy Dynamics Among Core European Economies
The core economies of Europe are experiencing a slow and gradual
recovery from the deep contraction initially triggered by the 2008-09
global financial crisis. While Germany remains the continent’s primary
growth engine, the prospects for the United Kingdom (UK), Switzerland
and Sweden are also promising for 2014-15. During the first quarter of
2014 output expanded strongly in Germany and the UK, building on the
positive trends established in 2013. With sustained momentum, the UK
will likely be the growth leader among developed economies this year,
advancing by 2.8%. In Germany, where recuperating domestic demand
is now taking over as the main economic driver, real GDP growth will
land around the 1.8% mark. France stagnated at the start of 2014 and
the recovery will likely resume at a subdued pace in the coming
quarters, limiting growth to below 1% for the year. Sweden and
Switzerland are well positioned for gains in the 2-2.5% range, near their
respective trend rates, though developments in both economies are
contingent on a pick-up in external demand, particularly in Europe. The
Bank of England (BoE) is expected to become the first major central
bank to raise its policy interest rate, by the first quarter of 2015. Meanwhile, still fragile growth prospects and
disinflation concerns will prolong the European Central Bank’s (ECB) monetary easing campaign.
Robust Capital Flows Reflected in Regional Currency Equity Market Strength
Strong capital inflows into European equity markets at the start of 2014 — driven by an expected narrowing of
growth differentials between advanced and emerging-market economies, together with concerns about
China’s growth outlook — have instilled a positive view for corporate earnings. Ongoing fiscal consolidation
efforts and prompt intervention of multilateral financial institutions to support the process of sovereign
deleveraging have also underpinned the resilience of the euro (EUR), despite the relatively fragile economic
recovery of the euro area compared to peer high-income countries. However, the trend is starting to shift and
the outlook for the EUR against the US dollar is negative, especially as the ECB shows a willingness to
weaken the currency. Beyond the euro zone, financial market metrics indicate a marked preference for the
British Pound (GBP) and Swiss Franc (CHF) over the Swedish Krone (SEK).
Debt Consolidation Underway; Longer-Term Structural
Reforms Needed
General government debt levels have begun to move lower in Germany
and Switzerland and are nearing a peak in Sweden, France and the UK.
The process of gradual deficit reduction evident most countries in
Europe is encouraging. Although the fiscal shortfalls of the UK and
France continue to exceed the European Union (EU) mandated limit of
3% of GDP, they have been trimmed down from very high levels.
Nevertheless, considerable challenges remain to ensuring a sustainable
downward debt trajectory, most obviously for France, where low growth
and inflation combined with a persisting primary budget deficit
(excluding interest payments) will continue to pressure the debt-to-GDP
ratio higher in the absence of further material budget consolidation.
Global investor unease regarding European sovereign debt
Sarah Howcroft (416) 862-3174
sarah.howcroft@scotiabank.com
Pablo Bréard (416) 862-3876
pablo.breard@scotiabank.com
EUROPE
0 1 2 3
France
Euro Area
Germany
Switzerland
U.K.
Sweden
2014-15F
2004-13
Real GDP Growth
y/y %
change
Source: IMF, Scotiabank Economics.
0 20 40 60 80 100
France
Euro Area
Germany
Switzerland
U.K.
Sweden
2014-15F
2004-13
General Government Gross Debt
% of GDP
Source: IMF, Scotiabank Economics.
11. Economics
Global Views
June 6, 2014
11
… continued from previous page
sustainability has not disappeared entirely, yet it has eased considerably. Germany, Sweden and Switzerland
continue to enjoy membership in the elite group of AAA-rated countries while both the UK and France have
been subject to downgrade revisions. Credit ratings have now stabilized for the most part, although France
and the UK remain subject to a “negative” outlook from one of the three major ratings agencies. The effect of
aging populations on public finances will pose considerable policy challenges down the road. Reforms to
pension and social security systems and measures to boost labour market participation, especially for
females, will be needed. Some governments have already made progress in these areas.
Continued Banking Sector Stabilization; Ongoing Challenges Linked to Household
Debt & Property Markets
The UK’s economic rebound has proven robust despite lingering concerns regarding the systemic strength of
domestic financial institutions (some of which remain subject to ongoing state intervention) and increasing
imbalances in the real estate market. The gradual erosion of banking secrecy in Switzerland has emerged as
a threat to the sector’s competitive advantage and a source of intensified diplomatic tensions with the US and
the EU. Sovereign and corporate de-leveraging efforts have been rewarded with improved access to
European bond markets, yet the high degree of household indebtedness remains a structural challenge in
parts of the region. Household debt to disposable income ratios are well above 100% in the UK, Sweden and
Switzerland. Finally, policymakers are still concerned about the potential development of housing bubbles, as
housing price inflation in excess of nominal GDP growth has led to overvaluation in certain property segments.
Enhanced Regional Governance; Geo-Political Risks Remain in Place
Following elections in May, the eighth European Parliament will convene in July under an expanded set of
decision-making powers and responsibilities. Since the onset of the debt crisis, the economic governance
structure of the EU has gradually been improved by stepped-up institutional monitoring and enforcement of
national budgets and reform programs. Over the coming months, in order to restore credibility to the banking
sector and in concert with the ECB’s “Comprehensive Assessment” of euro area banks’ balance sheets, EU
regulators will perform stress tests on 124 of the region’s biggest lenders. Heightened diplomatic and military
tensions associated with the Ukraine/Russia conflict will remain a source of instability over the near term.
Nevertheless, there is a sense of cautious optimism that Germany can act as an effective broker to resolve
the conflict. Energy prices seem to be incorporating a geopolitical risk premium, yet there is no evidence at
present of an imminent supply disruption.
EUROPE
Sarah Howcroft (416) 862-3174
sarah.howcroft@scotiabank.com
Pablo Bréard (416) 862-3876
pablo.breard@scotiabank.com
12. Economics
Global Views
June 6, 2014
12
South Korea & Singapore Enjoy The Benefits Of Improving Global Demand
The economic outlook of the two externally oriented economies continues to recuperate.
The outlook for South Korean and Singaporean economies is favourable
as exports continue to pick up reflecting stronger demand globally. Both
nations have faced similar challenges in establishing a sustainable
economic recovery due to their reliance on foreign trade, with exports of
goods and services equivalent to close to 60% of GDP in South Korea
and 200% in Singapore. Signs of accelerating momentum are now
evident; net exports increased by around 11% y/y and 16% y/y in South
Korea and Singapore, respectively, in the first quarter of the year.
Complementing the improving external environment, both economies
maintain solid domestic demand momentum as labour market conditions
underpin household spending and a favourable global outlook supports
investment activity. Healthy government finances further buttress the
encouraging macroeconomic context; both nations will record fiscal
surpluses in 2014-15, according to the International Monetary Fund.
South Korean real GDP grew by 4.0% y/y in the first quarter of the year,
while Singapore’s output increased by 4.9%. We expect modest
outperformance by Singapore to be maintained over the next couple of
years, with its economy expanding by 4% annually compared with an
advance of around 3.4% in South Korea.
South Korea and Singapore produce similar goods such as electronics,
machinery and mineral fuels, with the former’s auto industry being the
major differentiating factor. In terms of goods produced, the South
Korean export sector is more diversified than that of Singapore.
Nevertheless, Singapore is less dependent on one single export
destination as its market consists of a larger number of countries.
Malaysia is Singapore’s main trading partner, purchasing 12% of
shipments, while South Korea relies relatively heavily on demand from
China, which is the endpoint for 26% of all Korean exported goods.
Singapore is very well-positioned to benefit from globalization; it ranks
second (out of 148) in the World Economic Forum’s 2013-2014 Global
Competitiveness Index, while South Korea is placed in the 25th
position. Singapore enjoys a respectable performance across all
dimensions of the index, while South Korea’s assessment is diminished
by its fairly weak quality of public and private institutions, the rigidity and
inefficiencies of its labour market, as well as poorly functioning financial
markets. Similarly, Singapore’s regulatory environment is more
conducive to the starting and operation of a local firm; the World Bank’s
Ease of Doing Business Index places Singapore on the very top, though
South Korea does not fare poorly either, being placed in the 7th
position
in the world. Despite Singapore’s aforementioned favourable attributes,
one of the persisting challenges that the economy faces is its low
productivity growth. According to the Conference Board statistics, over
the past 10 years Singapore’s labour productivity (per hour worked) has
increased on average by 1% annually, while the corresponding figure for
Korea is over 4%. Accordingly, the Singaporean government continues
its long-term efforts to increase productivity and innovation through
focused measures in its 2014-15 Budget.
Tuuli McCully (416) 863-2859
tuuli.mccully@scotiabank.com
ASIA
-12
-7
-2
3
8
Jan-13 Jul-13 Jan-14
Source: Bloomberg.
y/y % change,
3-m MA
Export Growth
Singapore
Korea
Korean Exports
(2013)
U.S.
(11%)
Euro Area (6%)
Other (46%)
China
(26%)
Japan
(6%)Hong (5%)
Kong
Source: IMF Direction of Trade Database.
Singaporean Exports
(2013)
Malaysia
(12%)
Euro Area (7%)
Other (48%)
China
(12%)
Indonesia
(10%)
Source: IMF Direction of Trade Database.
Hong
Kong(11%)
13. Economics
Global Views
June 6, 2014
13
Harsh Drought Highlights The Risks Of Brazil’s Hydroelectric Dependence
Drought-strained hydroelectric supplies in Brazil are hurting the government’s balance
sheet and threatens to damage an already fragile economic outlook.
Brazil’s worst drought in decades is overextending the country’s power
sector, which depends on hydroelectricity for the vast majority of
generation. With less than a week until the World Cup kicks off, the
government is striving to keep the lights on; these efforts, however,
are putting tremendous financial strain on the government as well as
distorting the market mechanisms that would normally bring the
system into equilibrium. Any shock to the price or supply of electricity
would significantly and negatively affect Brazil’s already anemic
economic growth.
Hydropower accounts for roughly 80% of the electricity Brazil
generates in a given year, providing the Brazilian economy with
cheap, clean energy. In drought conditions, however, the rains that
normally replenish the reservoirs are absent and thermal backup
stations must pick up the slack. Power generation costs increase as
producers are forced onto the spot market to purchase coal, oil, and
natural gas to fuel the plants. As reservoir capacity falls, upward
pressure on wholesale electricity prices increases (top chart).
Exacerbating factors further, the government slashed electricity rates in
early 2014 from an average pre-tax consumer rate of R$300.11/MWh
in January to R$243.27/MWh in March. Despite the rising cost of
wholesale electricity, distributors are unable to raise rates accordingly
(middle chart), which has necessitated capital infusions for distributors
from the central government. These bailouts temporarily put off the
consumer rate increases and the subsequent “load-shedding” (i.e.
demand reductions) that would naturally bring the system into
equilibrium. In fact, the opposite is occurring: Brazil recorded its
highest-ever electricity demand in January.
The situation will likely get worse before it gets better. The rainy
season normally begins replenishing reservoirs in December and
levels continue to rise until May, when the dry season begins. Over
the past decade, reservoir levels in Brazil’s southeast region (the
largest hydroelectric producer) have increased an average of 24%
over the course of the rainy season; this year, they decreased by 14%
(bottom chart). With such shallow reservoirs heading into the dry
season, the next six months will significantly strain the system.
Brazilian policy makers are aiming to balance the fiscal burden of
electricity subsidies against the risk of fanning inflation and hurting the
economic competitiveness of Brazilian industry. However, substantive
reforms are unlikely to take shape until after the national election in
October. Even without electricity rate increases, Brazilian aluminum
producers are cutting production in the wake of falling aluminum
prices; higher electricity costs will only serve to worsen this trend.
Regardless of what direction the government takes, the Brazilian
economy is intimately linked to the water cycle and the strained
situation will persist until much-needed rain begins to fall.
Rory Johnston (416) 862-3908
rory.johnston@scotiabank.com
LATIN AMERICA
0.0
100.0
200.0
300.0
400.0
500.0
600.0
700.0
800.0
900.0
Jan-11 Jan-12 Jan-13 Jan-14
Wholesale Benchmark
Rate
Rate w Taxes
Wholesale vs Consumer Price
Weighted regional averages.
Source: ANEEL, CCEE, Scotiabank Economics
$R/MWh
0% 50% 100%
2014
2013
2012
2011
2010
2009
2008
2007
2006
2005
December
May
Historical Southeast Reservoir
Capacity - Rainy Season Change
Historical Southeast Reservoir
Capacity - Rainy Season Change
Weighted regional averages. .
Source: ONS, Scotiabank Economics.
+18%
+16%
+39%
+40%
+27%
+4%
+46%
+10%
+40%
—14%
0%
10%
20%
30%
40%
50%
60%
70%
80%
90%
100%
0
100
200
300
400
500
600
700
800
900
Jan-10 Jan-11 Jan-12 Jan-13 Jan-14
Wholesale Price, LHS
Capacity, RHS
Price & capacity figures are weighted averages.
Source: CCEE, ONS, Scotiabank Economics.
Wholesale Electricity Price &
Southeast Reservoir Capacity
$R/MWh
14. Fixed Income Strategy
Global Views
June 6, 2014
14
UK — Fancy A Wager?
Next week’s labour report could be a major determinant of how soon we will see the first BoE rate hike. In
particular, wage inflation was much lower than expected last month. Another downward surprise next week
would seriously dent the chances of a rate hike before the end of the year.
Wages are the new celebrity indicator
A key focal point for the Bank of England in helping to determine the timing of the first rate hike is how much
slack there is in the economy. A good proxy for this is wage inflation. Employment has been surging of late
and the unemployment rate has fallen like a stone. Yet, wage inflation has been somewhat disappointing —
running at around 1.5% y/y. The implication is that despite rapid hiring, there remains considerable slack
which has held back wage increases. If that is the case and there is considerable residual slack, then the
Monetary Policy Committee can afford to delay the first rate hike.
Wages are also an important
barometer of how much
household disposable income is
growing. If the combination of
employment growth and wage
inflation sufficiently outpaces CPI
inflation, then this should support
robust consumer spending
growth. Right now, rapid hiring is
doing all of the heavy lifting, given
employment growth of almost
2½% y/y. That is the fastest pace
of growth for 25 years! (Chart 1).
A more normal pace of
employment growth is around 1%
y/y. The point is that this break-
neck pace of hiring is unlikely to support disposable income growth forever. So unless wage inflation starts to
pull its weight, disposable income growth and the pace of consumer spending growth are at risk. Wage
inflation tells us about slack and the prospects for growth.
‘Normal’ wage inflation used to be in the region of 4.5% y/y. The Bank of England assumes that wage inflation
will recover to around 2½% y/y by the end of the year. However, there is a serious danger that the underlying
wage inflation series posts a reading of 1.0% y/y or lower next week, having slowed from 1.4% in February.
Wages are Up but Earnings are Down
Headline Average Weekly Earnings (AWE) represents the growth in the average company wage bill. This can
go up (or down) for several reasons. Clearly if firms on average increase everyone’s pay rate by x%, that will
push up the headline AWE series. However, if firms increase their headcount, or increase the proportion of
full-time relative to part-time workers, that will also inflate the average company wage bill and hence the pace
of headline AWE wage inflation. Our assumption had been that in a rapid hiring environment, we would see a
triple whammy for the AWE — wages rising, bigger headcounts and more full-time versus part-time workers.
In fact, we have seen the opposite.
The AWE is made up of two components — the wage contribution and the employment contribution. The
wage contribution (as the name suggests) captures the effect of explicit pay increases. That component is
actually running faster than the headline AWE as firms on average have raised wages.
Alan Clarke (44 207) 826-5986
alan.clarke@scotiabank.com
Employment (% y/y)
2.4% y/y - Fastest for 25 Years!
-4
-3
-2
-1
0
1
2
3
4
1972 1974 1976 1978 1980 1982 1984 1986 1988 1990 1992 1994 1996 1998 2000 2002 2004 2006 2008 2010 2012 2014
Source:
Chart 1: Employment Growth (% y/y)
15. Fixed Income Strategy
Global Views
June 6, 2014
15
… continued from previous page
However, the average
company pay bill is rising less
quickly because the other
component of the AWE, i.e.,
the employment contribution, is
posing a drag. Clearly we are
seeing rapid hiring, however
these jobs have tended to be
lower quality jobs. This
increased concentration in
lower-paid jobs is subtracting
around ½% point from headline
wage inflation (Chart 2).
Although self-employment is
not captured by the AWE data,
it is a decent proxy for what is
going on in the labour market.
Self-employment has accounted for over half of the increase in overall hiring in recent months. So while there
has been a substantial increase in the number of people in employment, these jobs have tended to be less
productive and lower-paid jobs — which explains why the ‘employment contribution’ of the AWE has fallen —
holding back over AWE inflation.
Wage inflation could fall below 1%!!
Next week’s wage inflation data need to be seen in the context of what was happening a year ago. Last April,
the top rate of income tax was lowered from 50% to 45%. Hence there was an incentive for firms to delay
bonuses from March (or even earlier) until April to take advantage of the lower rate of income tax. This caused
a massive increase in the headline measure of wages (up by 3.6% m/m) during April. If that jump is not
matched this April, then the % y/y pace of wage inflation will slump. That appears to be what the consensus is
assuming, with the median expectation that AWE including bonuses slumps from 1.7% 3m/yr down to just
1.2% y/y. We are a little less downbeat since we believe that there has been a persistent change in the
calendar timing for bonus payments. If a firm paid a bonus in April last year instead of March, there is a good
chance that they stuck with that for this year. At the end of the day, the measure that includes bonuses is
polluted and the BoE will treat it with caution.
The measure that will make or break the BoE outlook is average earnings excluding bonuses. There are
similar (although much smaller) base effects for this measure. A ‘normal’ % m/m gain in this measure has
been in the range of -0.2% m/m to +0.2% m/m. Last April saw a bumper 0.5% m/m gain. Our forecast
assumes that this 0.5% m/m gain is matched. That would push the % 3m/yr rate down from 1.3% to 1.1%. If
that 0.5% m/m is not matched, then there is a good chance that we see a 1% reading or lower. We only need
to see a -0.1% m/m reading in order to push the % 3m/yr reading below 1%.
The consensus at the time of writing is for a 1.2% 3m/yr reading. That implies a 0.6% m/m gain — i.e., even
faster than last April. We think this is too high and a downward surprise could seriously dent any residual
expectations of a BoE rate hike before the end of the year.
Alan Clarke (44 207) 826-5986
alan.clarke@scotiabank.com
Employment contribution typically reflects an increase / decrease
in the relative number of employees in a high-paying industry.
Average Weekly Earnings - Employment Contribution (% y/y)
0
-1.25
-1.00
-0.75
-0.50
-0.25
0.00
0.25
0.50
2001 2002 2003 2004 2005 2006 2007 2008 2009 2010 2011 2012 2013
Source:
Chart 2: Employment Contribution to Headline AWE
16. Fixed Income Strategy
Global Views
June 6, 2014
16
European Central Bank June Decision — Super Mario Is Back!
Bold, Unanimous Action
The ECB raised hopes last month that it was prepared to take bold action in June, and it didn’t disappoint.
Not only was the action bold, it was unanimous, which reinforced the impact of the ECB’s measures. It
also showed that Draghi’s leadership inside the board is strengthening.
The decision to announce a full set of measures also illustrates some follow-through on the “whatever it
takes” commitment from some time ago.
The key measures were:
1. The deposit rate was cut into negative territory to -0.10%. The refi rate was also cut by 10bp to 0.15%
while the marginal rates drop by 35bp to 0.40%.
2. The main refinancing operations (MROs) were prolonged as fixed-rate tender procedures with full
allotment for as long as necessary, and at least until the end of the Eurosystem’s reserve maintenance
period ending in December 2016.
3. The SMP sterilisation programme ended, which will immediately increase liquidity in the system by €165
bn. However, on this issue, the ECB may face legal challenges.
4. A 4-year targeted long-term refinancing operation (maturing Sept 2018 and at fixed rate +0.1% above the
MRO) amounting to €400bn initially and intended to improve bank lending to the euro area non-financial
private sector (excluding housing loans). The first two “TLTROs” will be conducted in September and
December of this year. By that time the ECB will have a pretty good view on the strength of the banking
sector through the asset quality review (AQR). So, in a way, this timing avoids impacting the AQR.
5. Intensified preparatory work related to outright purchases of asset-backed securities (ABS). By this
decision, the ECB showed that it has made a big step toward entering into some form of quantitative
easing (QE).
Addressing EUR strength and the lack of credit growth
The ECB president made it clear that this package is intended to achieve three aims:
First, strengthen the ECB’s forward guidance that accommodative monetary policy will stay in
place for a prolonged period. “Longer than previously thought”.
Second, deal with the strength of the EUR which has been one of the key factors behind lower-
than-expected inflation. In that sense, the decision to cut the deposit rate to -0.1% was made in
view of the success of the Danish central bank’s efforts to lower the DKK.
Third, speed up the recovery process by enhancing the liquidity available for banks to offer credit
through in particular the targeted LTRO or the ABS programme.
Potential impact on the market
Lower the euro.
Further rally on short-term rates through a stronger commitment to keep rates low for a
sustainable period.
Frédéric Prêtet (00 33) 17037-7705
frederic.pretet@scotiabank.com
17. Fixed Income Strategy
Global Views
June 6, 2014
17
… continued from previous page
Steepen the yield curve beyond the 5Y as the ECB wants to speed up / strengthen the recovery
process.
Provide support for the rally in peripheral yields as the “low rate environment” amplifies the
search for yield. From a macroeconomic perspective also, the willingness of the ECB to reflate
the economy and push inflation higher is also a support for the sustainability of eurozone
sovereign debt.
On the Linker market: Higher breakevens and inflation swaps with an outperformance of 2Y in
2Y inflation swaps or a flatter 5Y/10Y inflation swaps curve. At the end of the day, however, the
performance on the Linker market will be linked to the scale of the drop in the euro.
The updated ECB staff projections reaffirmed the belief that the recovery in growth is ongoing, but
emphasised the increased nervousness on the inflation outlook (see Table).
Unsurprisingly, following the weaker-than-expected Q1 GDP number, the ECB revised down its
2014 GDP growth forecast from 1.2% to 1.0%. This assumption suggests around a +0.3% q/q
per quarter pace of expansion over the coming three quarters. For 2015, the forecast was
revised slightly up to 1.7% from 1.5%, largely due to base effects. For 2016, the scenario was
unchanged at 1.8%.
The changes were more
significant for inflation, with the
entire profile shunted lower.
While a significant downside
adjustment for this year was to
be expected, the cut in 2015 and
2016 (at a time when commodity
prices are higher than in March)
illustrates the nervousness on
core inflation. By Q4 2016,
inflation is no longer seen as
coming back to price stability at
1.7% y/y but now stands at 1.5%
y/y.
English lessons
How does the ECB’s TLTRO differ from Bank of England’s Funding for Lending Scheme (FLS)?
The fee / incentives are similar, but different. For TLTRO there are two phases:
Phase 1) Two TLTROS in Sep-14 and Dec-14 enable participants to use the scheme up to 7% of
outstanding non-housing non-financial loans (as at end-April 14)
Phase 2) From Mar-15 to Jun-16, for every 1 EUR of new net lending (i.e., gross lending less
redemptions) a participant can tap the TLTRO for 3 EUR.
The fee is the MRO rate plus 10bp.
So this is a little different than the BoE FLS. The fee for the FLS went down by a set formula for each institution as
more net lending was provided. By contrast, the fee is the same for the ECB TLTRO irrespective of how much
Frédéric Prêtet (00 33) 17037-7705
frederic.pretet@scotiabank.com
18. Fixed Income Strategy
Global Views
June 6, 2014
18
… continued from previous page
new net lending is provided. However, the more new net lending an institution provides, the more access to cheap
funding that institution will get to refinance other existing more expensive borrowings.
There is also a cleverly designed safety feature. The UK experience of the FLS showed that some lenders were
wary of using the FLS for fear of facing a penal borrowing rate if their net lending turned negative. These lenders
feared big redemptions on existing loans, which are completely outside of their control. The ECB has addressed
this by stating that if net lending turns negative, then that institution will have to repay its TLTRO at the end of
2016 (instead of the end of 2018).
Doubts?
There is of course a question mark regarding the capacity of this new TLTRO to lift credit growth in view of the
lack of success of previous LTROs. However, today’s situation is different. First, we are in a recovery now and
risk aversion has receded. So, the environment is more favourable and the last ECB survey showed less
tightening in banking credit conditions. Second, the latest ECB lending survey also showed renewed appetite from
the demand side for borrowing. Thirdly, the structure of the TLTRO explicitly encourages financial institutions to
increase their net lending. Admittedly, the TLTROs where increased new net lending is rewarded through the
scheme are almost a year away (Mar-15-Jun-16) — why are we waiting!!!
Nonetheless, all in all, today’s actions create a better environment for the transmission of monetary policy.
Frédéric Prêtet (00 33) 17037-7705
frederic.pretet@scotiabank.com
19. Foreign Exchange Strategy
Global Views
June 6, 2014
19
Latin America Week Ahead: For The Week Of June 9 - 13
Week-ahead highlights
Although the week looks fairly quiet in the developed world from a data pipeline perspective, in LATAM, the
week contains a number of tier-1 releases. In the US, the main events look set to be the release of retail
sales and Fed speakers Bullard and Rosengren on Monday, which should be watched. However, the slim US
data pipeline opens the opportunity for LATAM FX to continue to diverge based on domestic factors. In
Colombia, the run-up to the elections will be interesting, as the two candidates continue to elaborate on their
plans to differentiate from each other in an election that looks tough to call (June 15th). BRL remains
supported by its high carry, and seemingly by FX intervention by both the central bank and FinMin. In PEN,
the BCRP seems likely to set a ceiling on the sol’s USD cross as inflation remains stubborn. For MXN and
CLP, our bias remains to be long MXN/CLP.
Week-ahead views:
Brazil: The BCB’s latest minutes seemed to signal that the rate hike cycle is over (at least for now), as growth
concerns took a more important place in the central bank’s debate. However, both the minutes and the
statement did not seem to fully shut the door on anything. There still seems to be some residual inflationary
pressure, so this week’s inflation data will be important to watch, as well as the BCB’s weekly survey to
monitor expectations. However, the BCB has repeated that it believes a portion of its tightening is still running
its course through the pipelines, signaling that even if we saw some residual upwards momentum in inflation
or its expectations, the rate hike cycle is likely at an end for now (material surprises could change this, but we
don’t see it as anywhere near a base case). On the growth front, this week’s retail sales and monthly
economic activity will likely be a key direction provider, as recent data has been a big disappointment due to
the leveraged stated of consumer balance sheets (whose debt service to disposable income ratio has
remained flat at around 21.5% since last November, which is still too high in our view).
In our view, there are still many hurdles to overcome before growth can sustainably accelerate, which include
deleveraging in important parts of the economy, but also a tax overhaul (i.e. on Thursday, Fiat’s CEO said
Brazil has the highest tax burden on cars of any economy globally; underscoring the 18% y/y drop in May’s
auto production in the country), and changing incentives for investment. The other important part of the puzzle
we get this week is formal job creation. In our opinion, although consumers are still highly leveraged, the high
rates on consumer loans mean that their capacity to pay is more determined by employment than interest rate
sensitivity (although Moody’s on Thursday warned that public banks’ loan portfolio quality started deteriorating
since the second half of 2013), so employment is a key indicator to watch. For BRL, the big debate now is
what the BCB’s intervention policy will be going forward, with the increase in swap auctions and the IOF
measure from last week signaling the central bank does not want the currency to weaken much further. It is
interesting that over the course of this week, both FinMin Mantega and the director of BNDES defended the
role of the development bank in supporting investment.
Chile: We expect this week’s main event to be the central bank’s MPC meeting, where consensus is looking
for unchanged rates, although the easing bias is expected to remain in place. Earlier this week, Governor
Vergara hinted that the central bank is likely to revise its growth forecast lower, which we don’t expect to be a
shock to the market, given weakness in recent data. Vergara also prepared us for the possibility that inflation
will remain above target for a few months before edging down towards the target. However, he was fairly clear
in signaling that with inflation persistently high, rate cuts will have to wait (today’s 4.7% CPI reinforces the
message). In addition to the MPC meeting, next week we are expecting the release of the trade balance,
where consensus looks for a surplus of ~US$1bn.
Colombia: With 10 days to go before the second round of the presidential elections, the latest poll by “el
Tiempo” puts President Santos marginally ahead of opposition candidate Zuluaga (who won round 1), with the
president leading 41.9% to 37%. However, RCN’s latest poll gave Zuluaga 49% and Santos 41%. The
election seems too close to call, as different polls seem to alternate on which candidate is ahead. On the FX
Eduardo Suárez (416) 945-4538
eduardo.suarez@scotiabank.com
20. Foreign Exchange Strategy
Global Views
June 6, 2014
20
… continued from previous page
front, FinMin Cardenas once again said he is worried about the peso’s strength (an increasingly frequent
message) which suggests that the FX intervention program will at least be extended, and potentially increased
(which we think will depend on how markets are progressing). We are looking forward to reading BanRep’s
MPC meeting minutes, after being caught offside in the last two decisions. In the first we did not expect the
hike due to FX concerns (thinking the central bank would view broad financial conditions as having been
tightened by currency appreciation), while in the second instance we took the central bank’s signal that they
had started the hiking cycle early so that tightening could be gradual as a sign that it would be an intermittent
cycle as data was evaluated… Both were the wrong call. Accordingly, we will look for guidance from the
upcoming minutes. The other part of the debate we will be interested in is the exchange rate, as we seek
guidance on what will be done with the FX intervention program.
Mexico: Banxico is widely expected to leave the O/N rate unchanged today, but it will be interesting to look for
any changes in the central bank’s perception of the economy. Our sense is that we are seeing a gradual
upswing in activity, but that some components of domestic demand remain sluggish. On the data front, the
release of CPI data will be interesting to watch, as will AMIA’s auto sector data, as well as industrial and
manufacturing production (which is somewhat of the engine of the economy). In addition, we see the release
of gross fixed investment data as a useful metric of confidence in the business sector, but we may need to
wait for clarity on secondary legislation before we see a true upswing. Reform discussions should also heat
up, as extraordinary sessions on the telecoms and energy secondary legislation kick off.
Peru: This week is relatively heavy with tier-1 events, with the BCRP’s MPC meeting being the highlight,
although the reference is likely to remain unchanged. The latest inflation print came in a little stronger than
anticipated (3.56%), and remains above target, but the central bank’s action has so far been on the FX front,
and reserve requirement adjustments. It will be interesting to see if there are any changes in bias. In addition,
it will be important to watch the trade balance release, where a deficit of -US$440mn is expected by
consensus. The sol remains range-bound since last January, with the BCRP setting a ceiling.
Eduardo Suárez (416) 945-4538
eduardo.suarez@scotiabank.com
21. Economics
Global Views
June 6, 2014
21
Key Data Preview
CANADA
We’re looking for a bump higher in Canadian
manufacturing sales by 0.4% m/m when numbers for
April are released on June 13. Our call is premised on
a mix of strong data that showed exports of machinery
higher by 1.8% m/m and exports of cars higher by 2.4%
m/m — that’s the good news. The bad news is that
prices for refined petroleum products fell by 0.2% m/m
and a big drop in new orders in March pulled the
absolute level of orders down substantially, below
levels seen prior to a defense order-induced surge in
the new orders numbers in February (see chart). That
should cap momentum moving forward, and generally
speaking, leaves us more than moderately skeptical
that a manufacturing rebound will materialize later this
year.
UNITED STATES
We’re looking for healthy growth in U.S. retail sales
(June 12) on the order of 0.4% m/m, with a smaller gain
(0.2% m/m) coming after excluding auto sales. Yes,
you’ve guessed it, we think that auto dealer sales
should be very strong on the month after industry
sources reported a 4.5% m/m increase in sales
volumes of new cars — a post-crisis high that is in-line
with the 16.85m annual average of sales from 2000-
2007 — i.e. before the pre-crisis slump (see chart).
Other indicators are… fairly mixed. Gasoline prices
were roughly flat (+0.4% m/m), so prices shouldn’t give
much of a lift in that category. The ICSC index of store
sales was weak on the month (-1.5% m/m) pointing to a
ceiling on gains.
The federal Treasury budget statement for May lands
on June 11, and the deficit so far in FY2014 (i.e., since
October 2013) stands at USD -306bn vs. USD -487bn
at this point in FY2013 — an improvement of USD
181bn. FY2013’s deficit came in at USD680bn vs.
USD1.09tn in FY2012 (see chart). FY2014’s pace of
deficit contraction is not pointing to a comparable
improvement as the effects of the expiry of some Bush-
era tax cuts plus the spending growth slowdown
associated with the political wrangling in Congress had
the most radical impact on FY2013. Still, economic
growth has government tax revenues rising at a solid
pace this year, and should cause the deficit to be
whittled down further.
Dov Zigler (416) 862-3080
dov.zigler@scotiabank.com
Derek Holt (416) 863-7707
derek.holt@scotiabank.com
A1
35
40
45
50
55
60
07 08 09 10 11 12 13 14
New Orders
Shipments
C$, Billions
Source: Statistics Canada, Scotiabank Economics
Canadian Manufacturing Sales & Orders
New Orders Volatility...
1
1.5
2
2.5
3
3.5
4
4.5
8
10
12
14
16
18
20
22
05 07 09 11 13
Auto Sales
Inventories (RHS)
Millions
Source: Bloomberg, Scotiabank Economics
Too Much Too Soon?
U.S. Vehicle Sales & Inventories
Millions
-12
-10
-8
-6
-4
-2
0
-1600
-1400
-1200
-1000
-800
-600
-400
-200
0
2009 2010 2011 2012 2013 2014 2015
Deficit (lhs)
Deficit as % of GDP (rhs)USD, Bn %
US Budget Defict:
Rapid Improvement, Still Huge
Source: CBO, Scotiabank Economics; Dates are Fiscal Years
CBO
Forecast
U.S. Budget Deficit
22. Economics
Global Views
June 6, 2014
22
Tuuli McCully (416) 863-2859
tuuli.mccully@scotiabank.com
… continued from previous page
EUROPE
The Turkish economy decelerated in the first quarter of 2014; we
anticipate that real GDP expanded by 3.5% y/y, down from 4.4%
in the final quarter of 2013. Ongoing softness is concentrated on
the domestic demand side, as previously robust consumer
spending is under strain from higher interest rates (the central
bank raised rates significantly in the January before partly
reversing the move in May) and higher unemployment (above
10%). Tighter credit conditions have reduced the rate of
consumer loan growth by half since late last year, from 28% y/y
in September-October to 14% in May. Meanwhile, exports have
performed well so far this year, rising by 8.9% y/y in the first
quarter, while imports shrunk 2.2%. These factors have
supported a narrowing in the current account deficit (as intended
by the central bank), which diminished to its smallest — albeit
still elevated — level in five quarters in the January-March
period. We expect further moderation in activity in the coming
quarters, limiting growth to 2.4% for the year as a whole.
LATIN AMERICA
Brazilian economic performance continues to be very
disappointing during the first months of the year. Recent data on
industrial production and retail sales as well as consumer and
business confidence surveys confirm a marked deterioration in
growth projections; we have adjusted our forecast accordingly
and we now estimate that real GDP will expand by 1.5% this
year.
ASIA
The Bank of Japan (BoJ) will convene on June 12-13th
for its
monthly monetary policy meeting. The members of the Policy
Board of the BoJ will focus on assessing the impact of the April
consumption tax increase on inflation and economic growth. For
the time being, we expect the policymakers to maintain the
current policy stance of expanding the nation’s monetary base
by ¥60-70 trillion annually (by 30-35% in 2014 as a whole),
which would take it to around ¥270 trillion by the end of the year.
We assess that the BoJ will likely provide additional monetary
stimulus by potentially extending and increasing the asset
purchase program in the coming months if the tax hike leads to a
prolonged stalling of economic momentum.
Neil Shankar (416) 866-6781
neil.shankar@scotiabank.com
Sarah Howcroft (416) 862-3174
sarah.howcroft@scotiabank.com
Pablo Bréard (416) 862-3876
pablo.breard@scotiabank.com
A2
0
2
4
6
8
10
12
14
Mar-11 Mar-12 Mar-13 Mar-14
Turkey Real GDP Growth
y/y % change
Source: Bloomberg, Scotiabank Economics.
0
10
20
30
40
50
60
0
50
100
150
200
250
Jan-13 Jul-13 Jan-14
y/y %
change
LHS
RHS
Source: Bloomberg.
Japan's Monetary Base
¥ tns
23. Economics
Global Views
June 6, 2014
1
Key Indicators for the week of June 9 – 13
Forecasts at time of publication.
Source: Bloomberg, Scotiabank Economics.
North America
Europe
A3
Country Date Time Indicator Period BNS Consensus Latest
PO 06/09 06:00 Real GDP (q/q) 1Q F -0.7 -0.7 -0.7
FR 06/10 02:45 Industrial Production (m/m) Apr 0.5 0.3 -0.7
FR 06/10 02:45 Manufacturing Production (m/m) Apr 0.5 0.4 -0.7
TU 06/10 03:00 Real GDP (y/y) 1Q 3.5 4.2 4.4
IT 06/10 04:00 Industrial Production (m/m) Apr -- 0.4 -0.5
UK 06/10 04:30 Industrial Production (m/m) Apr 0.5 0.4 -0.1
UK 06/10 04:30 Manufacturing Production (m/m) Apr 0.3 0.4 0.5
IT 06/10 05:00 Real GDP (q/q) 1Q F -0.1 -0.1 -0.1
UK 06/11 04:30 Average Weekly Earnings (3-month, y/y) Apr 1.7 1.2 1.7
UK 06/11 04:30 Employment Change (3M/3M, 000s) Apr 280.0 270.0 283.0
UK 06/11 04:30 Jobless Claims Change (000s) May -30.0 -25.0 -25.1
UK 06/11 04:30 ILO Unemployment Rate (%) Apr 6.7 6.7 6.8
FR 06/12 02:45 CPI (y/y) May 0.7 0.7 0.7
FR 06/12 02:45 CPI - EU Harmonized (m/m) May 0.0 0.1 0.0
FR 06/12 02:45 CPI - EU Harmonized (y/y) May 0.8 0.8 0.8
EC 06/12 05:00 Industrial Production (m/m) Apr 0.2 0.5 -0.3
SP 06/13 03:00 CPI (y/y) May F 0.2 0.2 0.2
SP 06/13 03:00 CPI - EU Harmonized (y/y) May F 0.2 0.2 0.2
IT 06/13 04:00 CPI - EU Harmonized (y/y) May F 0.4 0.4 0.4
EC 06/13 05:00 Employment (q/q) 1Q -- -- 0.1
EC 06/13 05:00 Trade Balance (€ mn) Apr -- 16.3 17088.4
Country Date Time Indicator Period BNS Consensus Latest
CA 06/09 08:15 Housing Starts (000s a.r.) May 185.0 185.0 195.3
MX 06/09 09:00 Bi-Weekly Core CPI (% change) May 31 -- 0.1 0.1
MX 06/09 09:00 Bi-Weekly CPI (% change) May 31 -- 0.1 -0.4
MX 06/09 09:00 Consumer Prices (m/m) May -- -0.4 -0.2
MX 06/09 09:00 Consumer Prices (y/y) May -- 3.5 3.5
MX 06/09 09:00 Consumer Prices Core (m/m) May -- 0.1 0.3
US 06/10 10:00 Wholesale Inventories (m/m) Apr -- 0.5 1.1
US 06/11 07:00 MBA Mortgage Applications (w/w) JUN 6 -- -- -3.1
MX 06/11 09:00 Industrial Production (m/m) Apr -- -- -0.1
MX 06/11 09:00 Industrial Production (y/y) Apr -- -0.2 3.4
US 06/11 14:00 Treasury Budget (US$ bn) May -- -130.0 106.9
CA 06/12 08:30 Capacity Utilization (%) 1Q -- 82.4 82.0
CA 06/12 08:30 New Housing Price Index (m/m) Apr -- 0.2 0.2
US 06/12 08:30 Initial Jobless Claims (000s) JUN 7 310 309 312
US 06/12 08:30 Continuing Claims (000s) MAY 31 2580 2612 2603
US 06/12 08:30 Export Prices (m/m) May -- 0.2 -0.4
US 06/12 08:30 Import Prices (m/m) May -- 0.2 -0.4
US 06/12 08:30 Retail Sales (m/m) May 0.4 0.6 0.1
US 06/12 08:30 Retail Sales ex. Autos (m/m) May 0.2 0.4 0.0
CA 06/12 09:00 Teranet - National Bank HPI (y/y) May -- -- 4.9
US 06/12 10:00 Business Inventories (m/m) Apr -- 0.4 0.4
CA 06/13 08:30 Manufacturing Shipments (m/m) Apr 0.4 0.8 0.4
US 06/13 08:30 PPI (m/m) May 0.2 0.1 0.6
US 06/13 08:30 PPI (y/y) May 2.5 2.4 2.1
US 06/13 09:55 U. of Michigan Consumer Sentiment Jun P 83.5 83.0 81.9
24. Economics
Global Views
June 6, 2014
2
Key Indicators for the week of June 9 – 13
Asia Pacific
Forecasts at time of publication.
Source: Bloomberg, Scotiabank Economics.
A4
Country Date Time Indicator Period BNS Consensus Latest
CH JUN 7-8 Exports (y/y) May -- 6.7 0.9
CH JUN 7-8 Imports (y/y) May -- 6.0 0.8
CH JUN 7-8 Trade Balance (USD bn) May -- 22.6 18.5
JN 06/08 19:50 Bank Lending (y/y) May -- -- 2.1
JN 06/08 19:50 Current Account (¥ bn) Apr -- 287.7 116.4
JN 06/08 19:50 GDP (q/q) 1Q F 1.5 1.4 1.5
JN 06/08 19:50 Trade Balance - BOP Basis (¥ bn) Apr -- -640.0 -1133.6
JN 06/09 01:00 Consumer Confidence May -- 37.6 37.0
JN 06/09 02:00 Eco Watchers Survey (current) May -- 45.0 41.6
JN 06/09 02:00 Eco Watchers Survey (outlook) May -- 52.0 50.3
TA 06/09 04:00 Exports (y/y) May -- 4.0 6.2
TA 06/09 04:00 Imports (y/y) May -- 10.2 5.8
TA 06/09 04:00 Trade Balance (US$ bn) May -- 2.9 2.5
NZ 06/09 18:45 Manufacturing Activity 1Q -- -- 6.3
JN 06/09 19:50 Tertiary Industry Index (m/m) Apr -- -3.5 2.4
JN 06/09 19:50 Japan Money Stock M2 (y/y) May -- 3.2 3.4
JN 06/09 19:50 Japan Money Stock M3 (y/y) May -- 2.7 2.8
PH 06/09 21:00 Exports (y/y) Apr -- -- 12.4
PH 06/09 21:00 Unemployment Rate (%) Apr -- -- 7.5
AU 06/09 21:30 Home Loans (%) Apr -- 0.2 -0.9
AU 06/09 21:30 Investment Lending (% change) Apr -- -- -0.8
CH 06/09 21:30 CPI (y/y) May 2.3 2.4 1.8
CH 06/09 21:30 PPI (y/y) May -- -1.5 -2.0
CH JUN 9-15 Aggregate Financing (CNY bn) May -- 1400.0 1553.8
CH JUN 9-15 New Yuan Loans (bn) May -- 750.0 774.7
IN JUN 9-16 Exports (y/y) May -- -- 5.26
IN JUN 9-16 Imports (y/y) May -- -- -15.00
NZ JUN 9-13 Business NZ PMI May -- -- 55.2
NZ JUN 9-13 REINZ House Sales (y/y) May -- -- -20.2
NZ JUN 9-13 REINZ Housing Price Index (m/m) May -- -- 0.1
JN 06/10 02:00 Machine Tool Orders (y/y) May P -- -- 48.7
SK 06/10 19:00 Unemployment Rate (%) May 3.7 3.5 3.7
AU 06/10 21:00 Consumer Inflation Expectation (%) Jun -- -- 2.4
MA 06/11 00:01 Industrial Production (y/y) Apr -- 4.0 4.3
NZ 06/11 17:00 RBNZ Official Cash Rate (%) Jun 12 3.00 3.25 3.00
JN 06/11 19:50 Machine Orders (m/m) Apr -- -10.8 19.1
SK 06/11 21:00 BoK Base Rate (%) Jun 12 2.50 2.50 2.50
AU 06/11 21:30 Employment (000s) May -- 10.0 14.2
AU 06/11 21:30 Unemployment Rate (%) May 5.8 5.9 5.8
ID JUN 11-12 BI Reference Interest Rate (%) Jun 12 7.50 7.50 7.50
IN 06/12 08:00 CPI (y/y) May 8.9 -- 8.6
IN 06/12 08:00 Industrial Production (y/y) Apr -- -- -0.5
SI 06/12 22:00 Unemployment Rate (%) 1Q F 2.1 2.1 2.1
JN JUN 12-13 BoJ Monetary Base Target (¥ tn) Jun 13 270.0 -- 270.0
JN 06/13 00:30 Capacity Utilization (m/m) Apr -- -- 0.4
JN 06/13 00:30 Industrial Production (y/y) Apr F 4.1 -- 4.1
SI 06/13 01:00 Retail Sales (y/y) Apr -- -2.6 -3.9
CH 06/13 01:30 Fixed Asset Investment YTD (y/y) May -- 17.1 17.3
CH 06/13 01:30 Industrial Production (y/y) May -- 8.8 8.7
CH 06/13 01:30 Retail Sales (y/y) May -- 12.2 11.9
HK 06/13 04:30 Industrial Production (y/y) 1Q -- -- 0.5
25. Economics
Global Views
June 6, 2014
3
Key Indicators for the week of June 9 – 13
Latin America
Forecasts at time of publication.
Source: Bloomberg, Scotiabank Economics.
A5
Country Date Time Indicator Period BNS Consensus Latest
PE 06/09 Trade Balance (USD mn) Apr -- -- -440.8
BZ 06/12 08:00 Retail Sales (y/y) Apr -- 5.9 -1.1
CL 06/12 18:00 Nominal Overnight Rate Target (%) Jun 12 4.00 4.00 4.00
PE 06/12 19:00 Reference Rate (%) Jun 4.00 4.00 4.00
BZ 06/13 07:30 Economic Activity Index NSA (y/y) Apr -- -1.4 -0.1
26. Economics
Global Views
June 6, 2014
4
Global Auctions for the week of June 9 – 13
A6
North America
Europe
Source: Bloomberg, Scotiabank Economics.
A6
Country Date Time Event
US 06/09 11:00 U.S. to Fed Purchase USD0.85-1.10 Bln Notes
US 06/09 11:30 U.S. to Sell 3-Month Bills
US 06/09 11:30 U.S. to Sell 6-Month Bills
US 06/10 11:00 U.S. to Fed Purchase USD2.50-3.25 Bln Notes
US 06/10 11:30 U.S. to Sell 4-Week Bills
US 06/10 13:00 U.S. to Sell 3-Year Notes
US 06/11 11:00 U.S. to Fed Purchase USD0.85-1.10 Bln Notes
CA 06/11 12:00 Canada to Sell 30-Year Real-Return Bonds
US 06/11 13:00 U.S. to Sell 10-Year Notes Reopening
US 06/12 11:00 U.S. to Fed Purchase USD0.55-0.80 Bln Notes
US 06/12 13:00 U.S. to Sell 30-Year Bonds Reopening
Country Date Time Event
NE 06/10 4:30 Netherlands to Sell Up to EUR3.5 Bln 0.5% 2017 Bonds
NO 06/10 5:00 Norway to Sell NOK3 Bln 4.25% 2017 Bonds
EC 06/10 5:10 ECB Main Refinancing Operation Result
EC 06/10 5:10 ECB Long-Term Refinancing Operation Result
UK 06/10 5:30 U.K. to Sell GBP3.25 Bln 2.75% 2024 Bonds
EC 06/10 7:00 ECB Open Market Operation Result
IT 06/11 5:00 Italy to Sell 12-month Bills
SZ 06/11 5:30 Switzerland to Sell Bonds
GE 06/11 5:30 Germany to Sell EUR4 Bln 0.25% 2016 Bonds
IT 06/12 5:00 Italy to Sell 3-year Bonds
SW 06/12 5:03 Sweden to Sell SEK1 Bln 0.25% I/L 2022 Bonds on June 12
UK 06/12 5:30 U.K. to Sell GBP1.4 Bln 0.125% I/L 2019 Bonds
Asia Pacific
Country Date Time Event
AU 06/09 21:00 Australia Plans to Sell I/L Bond
CH 06/09 23:00 China to Sell 3-Year Saving Bonds
CH 06/09 23:00 China to Sell 5-Year Saving Bonds
JN 06/10 04:00 Japan Auction for Enhanced-Liquidity
CH 06/10 23:00 China to Sell 1-Year Bonds
JN 06/10 23:35 Japan to Sell 2-Month Bill
AU 06/11 20:30 Australia Plans to Sell Bills
JN 06/11 23:35 Japan to Sell 3-Month Bill
JN 06/11 23:45 Japan to Sell 5-Year Bonds
Latin America
Country Date Time Event
BZ 06/11 11:00 Brazil to Sell Bills due 10/01/2014 - LTN
BZ 06/11 11:00 Brazil to Sell Bills due 4/1/2016 - LTN
BZ 06/11 11:00 Brazil to Sell Bills due 1/1/2018 - LTN
BZ 06/11 11:00 Brazil to Sell Fixed-rate bonds due 1/1/2021 - NTN-F
BZ 06/11 11:00 Brazil to Sell Fixed-rate bonds due 1/1/2025 - NTN-F
CO 06/11 11:30 5Y Fixed Amount Sold
CO 06/11 11:30 10Y Fixed Amount Sold
CO 06/11 11:30 15Y Fixed Amount Sold
27. Economics
Global Views
June 6, 2014
5
Events for the week of June 9 – 13
North America
Europe
Source: Bloomberg, Scotiabank Economics.
A7
Country Date Time Event
CA JUN 3-7 Canadian Prime Minister Harper Visits Poland, Belgium, France
MX JUN 4-7 Mexican Oil Congress Held in Acapulco
US 06/07 U.S. Vice President Biden Visits Ukraine
CA 06/07 Canadian Prime Minister Harper Attends Ukraine Inauguration
CA JUN 8-9 Canadian Prime Minister Harper Meets Australian Prime Minister
US 06/09 9:10 Fed's Bullard Speaks on U.S. Economic Outlook in Florida
US 06/09 13:30 Fed's Rosengren Speaks in Guatemala
CA 06/09 International Economic Forum of the Americas in Montreal
CA 06/10 10:30 Alberta Premier Hancock Speaks at Heavy Oil Conference
CA 06/12 10:30 Bank of Canada publishes its Financial System Review
CA 06/12 11:15 BoC Governor Poloz, Senior Dep. Wilkins hold press conference
CA 06/12 Ontario Holds Elections
Country Date Time Event
IT 06/07 5:00 Renzi Speaks in Naples
IT 06/09 5:00 Bank of Italy Report on Balance-Sheet Aggregates
GE 06/09 Merkel, Cameron, Rutte, Reinfeldt Meet at Swedish Summit
FI 06/09 Russian Foreign Minister Lavrov to Visit Finland June 9-10
EC 06/10 3:00 EU's Barroso, Rehn Speak at Brussels Economic Forum
FI 06/10 4:00 ECB's Liikanen Speaks at Bank of Finland Briefing in Helsinki
EC 06/10 5:30 European Commission's Buti Speaks at Brussels Economic Forum
EC 06/10 10:00 ECB's Mersch, Poland's Belka Speak at Brussels Economic Forum
EC 06/10 11:15 EU's Van Rompuy Speaks at Brussels Economic Forum
EC 06/10 End of Eurosystem Reserve Maintenance Period
SP 06/11 4:15 ECB's Mersch Speaks in Barcelona
PO 06/11 8:00 Bank of Portugal Releases Summer Economic Bulletin
GE 06/11 11:00 Schaeuble, Greece's Stournaras Hold Panel Discussion in Berlin
PO 06/11 Bank of Portugal Releases Data on Banks
EC 06/12 4:00 ECB Publishes Monthly Report
SP 06/12 6:45 Bank of Spain's Duran Speaks in Madrid
SP 06/13 3:30 ECB's Linde Speaks in Madrid
UK 06/13 U.K. Sovereign Debt Rating Published by S&P, Fitch
IT 06/13 Italy Sovereign Debt Rating May Be Published by Moody's
FR 06/13 France Sovereign Debt Rating Published by Fitch
28. Economics
Global Views
June 6, 2014
6
Events for the week of June 9 – 13
A9
Asia Pacific
Source: Bloomberg, Scotiabank Economics.
A8
Latin America
Country Date Time Event
IN JUN 8-9 Indian Upper House Holds Meeting
AU 06/09 12:00 RBA's Stevens Speech in San Francisco
IT 06/09 Italian Prime Minister Renzi Visits China, Vietnam, Kazakhstan
NZ 06/11 17:00 RBNZ Official Cash Rate
NZ 06/11 17:05 RBNZ Governor Wheeler News Conference
SK 06/11 21:00 BoK 7-Day Repo Rate
ID 06/11 Bank Indonesia Reference Rate
JN 06/12 BOJ 2014 Monetary Base Target
JN 06/12 Bank of Japan Monetary Policy Statement
Country Date Time Event
CL 06/12 18:00 Overnight Rate Target
PE 06/12 19:00 Reference Rate
29. Economics
Global Views
June 6, 2014
7
Global Central Bank Watch
NORTH AMERICA
Rate Current Rate Next Meeting Scotia's Forecasts Consensus Forecasts
Bank of Canada – Overnight Target Rate 1.00 July 16, 2014 1.00 --
Federal Reserve – Federal Funds Target Rate 0.25 June 18, 2014 0.25 0.25
Banco de México – Overnight Rate 3.00 July 11, 2014 3.50 --
EUROPE
Rate Current Rate Next Meeting Scotia's Forecasts Consensus Forecasts
European Central Bank – Refinancing Rate 0.15 July 3, 2014 0.15 --
Bank of England – Bank Rate 0.50 July 10, 2014 0.50 0.50
Swiss National Bank – Libor Target Rate 0.00 June 19, 2014 0.00 --
Central Bank of Russia – One-Week Auction Rate 7.50 June 16, 2014 7.50 7.50
Hungarian National Bank – Base Rate 2.40 June 24, 2014 2.40 2.30
Central Bank of the Republic of Turkey – 1 Wk Repo Rate 9.50 June 24, 2014 9.50 --
Sweden Riksbank – Repo Rate 0.75 July 3, 2014 0.75 --
Norges Bank – Deposit Rate 1.50 June 19, 2014 1.50 --
ASIA PACIFIC
Rate Current Rate Next Meeting Scotia's Forecasts Consensus Forecasts
Reserve Bank of Australia – Cash Target Rate 2.50 July 1, 2014 2.50 2.50
Reserve Bank of New Zealand – Cash Rate 3.00 June 11, 2014 3.25 3.25
People's Bank of China – Lending Rate 6.00 TBA -- --
Reserve Bank of India – Repo Rate 8.00 August 5, 2014 8.00 --
Bank of Korea – Bank Rate 2.50 June 11, 2014 2.50 2.50
Bank of Thailand – Repo Rate 2.00 June 18, 2014 2.00 --
Bank Indonesia – Reference Interest Rate 7.50 June 12, 2014 7.50 7.50
LATIN AMERICA
Rate Current Rate Next Meeting Scotia's Forecasts Consensus Forecasts
Banco Central do Brasil – Selic Rate 11.00 July 16, 2014 11.00 --
Banco Central de Chile – Overnight Rate 4.00 June 12, 2014 4.00 4.00
Banco de la República de Colombia – Lending Rate 3.75 June 20, 2014 3.75 --
Banco Central de Reserva del Perú – Reference Rate 4.00 June 12, 2014 4.00 --
AFRICA
Rate Current Rate Next Meeting Scotia's Forecasts Consensus Forecasts
South African Reserve Bank – Repo Rate 5.50 July 17, 2014 5.50 --
BoC: The latest BoC statement acknowledged that inflation has picked up (due in part to the weak C$), but tried to talk down the CPI upside. We think that
this can only go on for so long, and believe that there is a solid risk that the BoC’s ambivalence toward the direction of the next rate move and warnings
about downside risks to inflation are potentially on the way out later in the summer. Fed: Strong jobs numbers out of the U.S. (217k in May, spot on with the
2014 average) continue to give the Fed all of the justification that it needs to continue with its gradual and deliberate monetary policy normalization path.
Economic divergence has emerged as the norm amongst the relatively well performing economies in the South Pacific Americas, Peru and Chile. Recent
data confirm a steady weakening of economic conditions in Chile influenced by multiple factors such as lower mining-related investment, growth-deterring
tax adjustments and somewhat decelerating domestic consumption. We are, however, expecting the central bank to keep its reference rate unchanged on
June 12th, with a possible easing bias in the coming months. As for Peru, we do not envisage a change in the current monetary stance, in line with the
rhetoric from central bank officials and current growth and inflation trends (although Mexico’s unexpected rate decision raises a question about forward
guidance practices in Latin America). Both the Peruvian sol and Chilean peso maintain a stable trading bias.
The Reserve Bank of New Zealand (RBNZ) will likely continue to tighten monetary conditions by raising the official cash rate by another 25 basis points
(bps) next week. The official cash rate was raised by 50 bps between March and April to the current level of 3.0% as the RBNZ aims to limit general
inflation pressure in the robustly growing economy. In Indonesia, persistent inflationary pressures prompted the central bank to raise the reference rate by
175 bps last year to the current level of 7.5% in an effort to direct the rate of inflation towards its target corridor, which is set at 3½-5½% y/y for 2014 and 3-
5% for 2015. As consumer price inflation closed 2013 at 8.4% y/y, we expect the reference rate to be maintained at the current level of 7.5% for the
foreseeable future. The Bank of Korea will likely maintain its benchmark rate at 2.5% as inflationary pressures in South Korea still remain relatively low
with consumer prices increasing by 1.7% y/y in May.
North America
Europe
Asia Pacific
Latin America
Africa
Forecasts at time of publication.
Source: Bloomberg, Scotiabank Economics.
A9
30. Economics
Global Views
June 6, 2014
8
Forecasts as at May 29, 2014* 2000-12 2013 2014f 2015f 2000-12 2013 2014f 2015f
Output and Inflation (annual % change) Real GDP Consumer Prices
2
World1
3.7 3.0 3.3 3.6
Canada 2.2 2.0 2.2 2.5 2.1 0.9 1.8 1.8
United States 1.9 1.9 2.4 3.2 2.5 1.5 1.8 2.0
Mexico 2.4 1.1 2.7 3.7 4.7 4.0 4.2 4.0
United Kingdom 1.7 1.8 2.8 2.1 2.3 2.0 1.8 2.1
Euro zone 1.3 -0.4 1.0 1.4 2.1 0.8 0.9 1.3
Japan 0.9 1.6 1.4 1.2 -0.3 1.6 2.3 1.9
Australia 3.1 2.4 2.7 2.9 3.0 2.7 2.9 2.9
China 9.3 7.7 7.3 7.0 2.4 2.5 2.6 3.1
India 7.2 4.6 5.2 5.7 6.7 6.4 5.3 5.8
Korea 4.2 3.0 3.6 3.2 3.1 1.1 2.2 2.5
Thailand 4.2 2.9 2.0 4.0 2.7 1.7 2.5 2.8
Brazil 3.4 2.3 2.0 2.5 6.5 5.9 6.0 5.5
Chile 4.5 4.1 3.4 4.1 2.9 2.9 3.6 3.2
Peru 5.5 5.6 5.3 5.6 2.6 2.9 2.8 2.8
Central Bank Rates (%, end of period) 13Q4 14Q1 14Q2f 14Q3f 14Q4f 15Q1f 15Q2f 15Q3f
Bank of Canada 1.00 1.00 1.00 1.00 1.00 1.00 1.00 1.00
Federal Reserve 0.25 0.25 0.25 0.25 0.25 0.25 0.50 0.75
European Central Bank 0.25 0.25 0.10 0.10 0.10 0.10 0.10 0.10
Bank of England 0.50 0.50 0.50 0.50 0.50 0.75 1.00 1.25
Swiss National Bank 0.00 0.00 0.00 0.00 0.00 0.00 0.00 0.00
Reserve Bank of Australia 2.50 2.50 2.50 2.50 2.75 3.00 3.25 3.50
Exchange Rates (end of period)
Canadian Dollar (USDCAD) 1.06 1.11 1.10 1.11 1.12 1.14 1.14 1.12
Canadian Dollar (CADUSD) 0.94 0.90 0.91 0.90 0.89 0.88 0.88 0.89
Euro (EURUSD) 1.37 1.38 1.37 1.33 1.30 1.28 1.26 1.25
Sterling (GBPUSD) 1.66 1.67 1.70 1.68 1.67 1.65 1.63 1.61
Yen (USDJPY) 105 103 104 107 109 110 111 112
Australian Dollar (AUDUSD) 0.89 0.93 0.93 0.94 0.92 0.89 0.89 0.89
Chinese Yuan (USDCNY) 6.1 6.2 6.2 6.2 6.1 6.1 6.0 6.0
Mexican Peso (USDMXN) 13.0 13.1 13.0 13.1 13.2 13.3 13.2 13.2
Brazilian Real (USDBRL) 2.36 2.27 2.38 2.40 2.45 2.48 2.48 2.50
Commodities (annual average) 2000-12 2013 2014f 2015f
WTI Oil (US$/bbl) 60 98 99 95
Brent Oil (US$/bbl) 62 109 108 108
Nymex Natural Gas (US$/mmbtu) 5.45 3.73 4.60 4.50
Copper (US$/lb) 2.22 3.32 3.08 3.00
Zinc (US$/lb) 0.78 0.87 0.95 1.25
Nickel (US$/lb) 7.64 6.80 8.30 10.75
Gold, London PM Fix (US$/oz) 745 1,410 1,300 1,375
Pulp (US$/tonne) 730 941 985 985
Newsprint (US$/tonne) 585 608 607 630
Lumber (US$/mfbm) 274 356 380 400
1
World GDP for 2003-12 are
IMF PPP estimates; 2013-15f
are Scotiabank Economics'
estimates based on a 2012
PPP-weighted sample of 38
countries.
2
CPI for Canada and the
United States are annual
averages. For other countries,
CPI are year-end rates.
* See Scotiabank Economics 'Global Forecast Update' report for additional forecasts & commentary.
Brazil
India
South Korea
Thailand
Chile
Peru
Japan
Canada
United States
Mexico
United Kingdom
Australia
China
Euro Zone
A10
Forecasts as at May 29, 2014*
31. Economics
Global Views
June 6, 2014
9
North America
Canada 2013 13Q4 14Q1 Latest United States 2013 13Q4 14Q1 Latest
Real GDP (annual rates) 2.0 2.7 1.2 Real GDP (annual rates) 1.9 2.6 -1.0
Current Acc. Bal. (C$B, ar) -60.3 -62.6 -49.5 Current Acc. Bal. (US$B, ar) -379 -324
Merch. Trade Bal. (C$B, ar) -7.3 -9.0 4.9 -7.7 (Apr) Merch. Trade Bal. (US$B, ar) -702 -676 -729 -789 (Apr)
Industrial Production 0.4 0.5 2.6 3.9 (Apr) Industrial Production 2.9 3.5 3.8 3.2 (Apr)
Housing Starts (000s) 188 194 175 195 (Apr) Housing Starts (millions) 0.93 1.03 0.92 1.07 (Apr)
Employment 1.3 1.0 0.8 0.4 (May) Employment 1.7 1.8 1.7 1.8 (May)
Unemployment Rate (%) 7.1 7.0 7.0 7.0 (May) Unemployment Rate (%) 7.4 7.0 6.7 6.3 (May)
Retail Sales 3.2 4.0 3.9 3.9 (Mar) Retail Sales 4.3 3.8 2.4 4.2 (Apr)
Auto Sales (000s) 1744 1758 1698 1695 (Mar) Auto Sales (millions) 15.5 15.6 15.6 16.7 (May)
CPI 0.9 0.9 1.4 2.0 (Apr) CPI 1.5 1.2 1.4 2.0 (Apr)
IPPI 0.4 0.5 2.6 -3.9 (Apr) PPI 1.2 0.8 1.5 3.1 (Apr)
Pre-tax Corp. Profits -1.7 4.3 6.8 Pre-tax Corp. Profits 3.4 4.8 6.6
Mexico
Real GDP 1.1 0.7 1.8
Current Acc. Bal. (US$B, ar) -25.9 -30.2 -18.1
Merch. Trade Bal. (US$B, ar) -1.0 7.4 -4.8 6.1 (Apr)
Industrial Production -0.7 -0.4 1.6 3.4 (Mar)
CPI 3.8 3.7 4.2 3.5 (Apr)
Euro Zone 2013 13Q4 14Q1 Latest Germany 2013 13Q4 14Q1 Latest
Real GDP -0.4 0.5 0.9 Real GDP 0.5 1.4 2.3
Current Acc. Bal. (US$B, ar) 288 474 228 346 (Mar) Current Acc. Bal. (US$B, ar) 273.9 342.4 265.7 323.4 (Mar)
Merch. Trade Bal. (US$B, ar) 230.3 283.3 192.4 313.1 (Mar) Merch. Trade Bal. (US$B, ar) 265.5 284.4 263.7 248.6 (Mar)
Industrial Production -0.7 1.5 1.4 0.5 (Mar) Industrial Production 0.1 3.1 4.1 3.0 (Mar)
Unemployment Rate (%) 11.9 11.9 11.8 11.7 (Apr) Unemployment Rate (%) 6.9 6.9 6.8 6.7 (May)
CPI 1.4 0.8 0.6 0.7 (Apr) CPI 1.5 1.3 1.2 2.6 (May)
France United Kingdom
Real GDP 0.4 0.8 0.8 Real GDP 1.7 2.7 3.1
Current Acc. Bal. (US$B, ar) -36.6 -13.1 -59.6 -43.4 (Mar) Current Acc. Bal. (US$B, ar) -111.5 -138.5
Merch. Trade Bal. (US$B, ar) -46.3 -46.1 -42.1 -42.9 (Mar) Merch. Trade Bal. (US$B, ar) -168.5 -172.8 -176.7 -169.1 (Mar)
Industrial Production -0.5 0.7 -0.2 -0.8 (Mar) Industrial Production -0.3 2.3 2.5 2.3 (Mar)
Unemployment Rate (%) 10.3 10.2 10.4 10.4 (Apr) Unemployment Rate (%) 7.6 7.2 6.8 (Feb)
CPI 0.9 0.6 0.7 0.7 (Apr) CPI 2.6 2.1 1.7 1.8 (Apr)
Italy Russia
Real GDP -1.8 -0.9 -0.5 Real GDP 1.3 2.0
Current Acc. Bal. (US$B, ar) 20.7 57.9 -0.1 16.7 (Mar) Current Acc. Bal. (US$B, ar) 32.8 8.9
Merch. Trade Bal. (US$B, ar) 40.3 58.6 37.8 64.2 (Mar) Merch. Trade Bal. (US$B, ar) 15.0 15.7 17.0 19.7 (Mar)
Industrial Production -3.1 -0.4 0.0 -0.1 (Mar) Industrial Production 0.4 1.4 1.1 2.4 (Apr)
CPI 1.2 0.6 0.4 0.4 (Apr) CPI 6.8 6.4 6.4 7.6 (May)
Europe
All data expressed as year-over-year % change unless otherwise noted.
Economic Statistics
Source: Bloomberg, Global Insight, Scotiabank Economics.
A11
32. Economics
Global Views
June 6, 2014
10
Asia Pacific
Australia 2013 13Q4 14Q1 Latest Japan 2013 13Q4 14Q1 Latest
Real GDP 2.4 2.7 3.5 Real GDP 1.6 2.5 2.7
Current Acc. Bal. (US$B, ar) -48.6 -50.4 -19.0 Current Acc. Bal. (US$B, ar) 33.6 -56.5 -32.6 13.7 (Mar)
Merch. Trade Bal. (US$B, ar) 20.1 20.5 26.2 33.0 (Apr) Merch. Trade Bal. (US$B, ar) -117.1 -149.0 -176.2 -98.8 (Apr)
Industrial Production 3.6 2.4 5.7 Industrial Production -0.6 5.8 8.3 4.1 (Apr)
Unemployment Rate (%) 5.7 5.8 5.9 5.8 (Apr) Unemployment Rate (%) 4.0 3.9 3.6 3.6 (Apr)
CPI 2.4 2.7 2.9 CPI 0.4 1.4 1.5 3.4 (Apr)
South Korea China
Real GDP 3.0 3.7 3.9 Real GDP 7.7 7.7 7.4
Current Acc. Bal. (US$B, ar) 79.9 99.4 60.3 85.5 (Apr) Current Acc. Bal. (US$B, ar) 182.8
Merch. Trade Bal. (US$B, ar) 44.1 53.2 20.8 64.2 (May) Merch. Trade Bal. (US$B, ar) 259.2 360.3 67.1 221.4 (Apr)
Industrial Production 0.2 0.6 1.2 2.4 (Apr) Industrial Production 9.7 9.7 8.8 8.7 (Apr)
CPI 1.3 1.1 1.1 3.0 (May) CPI 2.5 2.5 2.4 1.8 (Apr)
Thailand India
Real GDP 2.9 0.6 Real GDP 4.7 4.6
Current Acc. Bal. (US$B, ar) -2.8 3.0 8.2 Current Acc. Bal. (US$B, ar) -49.3 -4.2
Merch. Trade Bal. (US$B, ar) 0.5 1.3 2.2 0.6 (Apr) Merch. Trade Bal. (US$B, ar) -12.8 -10.2 -9.5 -10.1 (Apr)
Industrial Production -3.1 -6.7 -7.1 -4.6 (Apr) Industrial Production 0.6 -0.8 -0.5 -0.5 (Mar)
CPI 2.2 1.7 2.0 2.6 (May) WPI 6.3 7.1 5.3 5.2 (Apr)
Indonesia
Real GDP 5.8 5.7
Current Acc. Bal. (US$B, ar) -29.1 -4.3
Merch. Trade Bal. (US$B, ar) -0.3 0.8 0.4 -2.0 (Apr)
Industrial Production 6.0 1.5 3.8 4.9 (Mar)
CPI 6.4 8.0 7.8 7.3 (May)
Brazil 2013 13Q4 14Q1 Latest Chile 2013 13Q4 14Q1 Latest
Real GDP 2.3 1.9 1.8 Real GDP 4.1 2.7 2.6
Current Acc. Bal. (US$B, ar) -81.1 -83.3 -100.7 Current Acc. Bal. (US$B, ar) -4.3 -9.7 -3.2
Merch. Trade Bal. (US$B, ar) 2.6 16.7 -24.3 8.5 (May) Merch. Trade Bal. (US$B, ar) 8.0 3.1 8.3 11.4 (Apr)
Industrial Production 2.3 0.0 -0.4 -2.2 (Apr) Industrial Production 3.1 2.5 0.6 1.2 (Apr)
CPI 6.2 5.8 5.8 6.3 (Apr) CPI 1.9 2.3 3.2 4.3 (Apr)
Peru Colombia
Real GDP 5.8 6.9 Real GDP 4.3 4.9
Current Acc. Bal. (US$B, ar) -10.2 -2.2 Current Acc. Bal. (US$B, ar) -12.7 -3.4
Merch. Trade Bal. (US$B, ar) 0.1 0.2 -0.3 -0.4 (Mar) Merch. Trade Bal. (US$B, ar) 0.2 0.1 -0.2 -0.3 (Mar)
Unemployment Rate (%) 5.9 5.8 6.8 6.3 (Apr) Industrial Production -1.8 0.2 4.4 9.8 (Mar)
CPI 2.8 2.9 3.4 3.6 (May) CPI 2.0 1.8 2.3 2.9 (May)
Latin America
Economic Statistics
All data expressed as year-over-year % change unless otherwise noted.
Source: Bloomberg, Global Insight, Scotiabank Economics.
A12