Zabbix visión general del sistema - 04.12.2013
•Télécharger en tant que PPTX, PDF•
2 j'aime•2,076 vues


Recommandé
Recommandé
Contenu connexe
Tendances
Tendances (20)
Similaire à Zabbix visión general del sistema - 04.12.2013
Similaire à Zabbix visión general del sistema - 04.12.2013 (20)
Zabbix visión general del sistema - 04.12.2013
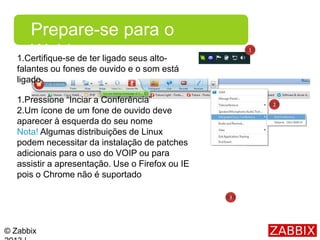
- 1. © Zabbix Prepare-se para o Webinar1.Certifique-se de ter ligado seus alto- falantes ou fones de ouvido e o som está ligado 1.Pressione “Inciar a Conferência” 2.Um ícone de um fone de ouvido deve aparecer à esquerda do seu nome Nota! Algumas distribuições de Linux podem necessitar da instalação de patches adicionais para o uso do VOIP ou para assistir a apresentação. Use o Firefox ou IE pois o Chrome não é suportado 2 1 3
- 2. © Zabbix Como efetuar perguntas no webinar 1.Mova o mouse para a parte superior da tela. Uma barra do Webex irá aparecer 2.Clicar no botão «Chat». A caixa do Chat irá aparecer 3.Selecione «Send to: Everyone» para fazer uma pergunta pública ou escoolha uma pessoa para fazer uma pergunta privada 4.Digite a sua pergunta. Pressione «Send» 1 2 3 4
- 3. © Zabbix Visão geral do sistema Luciano Alves CEO Unirede Soluções
- 4. Luciano Alves Apresentad o por Nome: luciano@unirede.netE-mail: @uniredeTwitter: www.unirede.netHome: Certificado ZABBIX desde 2008 Instrutor Certificado pela ZABBIX SAI Moderador do Fórum PR_BR e ES Credenci ais:
- 5. © Zabbix Conte údo Sobre o Produto 6 Elementos 15 Principais funções 25 Arquitetura 33 Opções de instalação e distribuição 38
- 6. © Zabbix Sobre o produtoIntrodução 7 Historia 8 Licença 10 Benefícios competitivos 11 Desempenho12 ZABBIX em números 13
- 7. © Zabbix Introduction So what’s the problem? Cost of downtime is high Hard to manage nontransparent environment Impossible to make wise planning and purchasing Zabbix solves all these
- 8. © Zabbix History Product idea 199 8 200 1 200 4 200 5 200 6 First GPL release v. 0.1 v. 1.0 Zabbix SIA Compa ny es 1st Stabl e Versi on release v. 1.1 XML Protocol Active Checks Logfile Monitoring Eventlog Monitoring GSM Modem SNMPv3
- 9. © Zabbix History continued 200 7 200 8 200 9 201 2 v. 1.6 v. 1.8 v. 2.0 v. 1.4 LLD Multinamed Host Java Gateway JMX Monitoring Automatic Inventory SNMP Trap Monitoring API Configurati on Cache Passive Zabbix Proxy IBM DB2 Support Calculated Items Escallations Zabbix Proxy LDAP Auth Dashboard Maintenanc e New Interface SQLite Network Discovery Web Monitoring UTF8, IPv6 Zabbix Japan LLC Improved performanc e VMware monitoring Loadable modules Templates for web monitoring Plain text monitoring with regex Self- monitoring v. 2.2 201 3
- 10. © Zabbix License Open SourceNo Hidden (Corporate, Enterprise) versions GP Lv2 Tr ue
- 11. © Zabbix Competitive Benefits Bundled package True Open Source Enterprise-friendly support pricing Monitor anything Distributed monitoring Commercially Backed
- 12. © Zabbix Performanc e With a well structured set- up and powerful hardware, allows to process over 50 000 new values per second, which is equal to monitoring of 100 000 devices against 20 parameters each with 40 second interval Single Zabbix Node
- 13. © Zabbix Zabbix in Numbers times software was downloaded during 2013800 000 Best of Breed Zabbix is nominated for the 2nd time among world’s best monitoring solutions according to Gartner 25 languages Zabbix interface is translated to
- 14. © Zabbix Elements Host 14 Item 15 Trigger 16 Event 20 Template 21
- 15. © Zabbix Host Server or a network device having IP or DNS name Any application Any smart equipment
- 16. © Zabbix Item Sources of InformationZabbix Agent Server polls Zabbix Agent (Active) Processed by Zabbix agent Simple check Executed by Zabbix server SNMP agent All SNMP versions are supported Trapper Used with Zabbix sender Internal Zabbix health Aggregate Average/min/max for host group External check script[parameters] SSH Password and key authentication supported Telnet Calculated From existing data
- 17. © Zabbix Trigger Logical expression that can describe threshold or complex problem condition 6 severity levels may be assigned to a Trigger visual representation - different colors for different severities audio in global alarms - different audio for different severities user media - different media (notification channel) for different severities limiting actions by conditions against trigger severities
- 18. © Zabbix Trigger ExpressionsSyntax {host:key.function(param)}= 0 {zabbix:system.cpu.load.av g(600)}>5 Operators -, +, /, *, <, >, =, #, |, and Expression Constructor makes it easier to build complex expressions Functions min, max, avg, last, diff, count, delta, time, etc Not limited to single item or host {host1:item1}=1 and {host2:item2}>3 | {host3:item3}<0
- 19. © Zabbix Trigger Dependencies Investigates the real cause of multiple problems Skips dependent notifications Hides dependent triggers in the frontend CRM does’t respond MySQL doesn’t respond Linux on Host 1 stopped Disk free space Host 1 = 0 Mb Alarm Alarm Alarm Alarm Real problem: Disk is full
- 20. © Zabbix Trigger HysteresisTask: Average server room temperature is 12-14ºC. Alarm if temperature exceeds 20ºC and release alarm only if temperature goes below 15ºC. ({TRIGGER.VALUE}= 0 and {server:temp.last(0)}> 20) | ({TRIGGER.VALUE}= 1 and {server:temp.last(0)}> 15)
- 21. © Zabbix Relative TriggerAllows to compare current result with some result in the past Example {server:system.cpu.load.avg(1h)} / {server:system.cpu.load.avg(1h, 1d)}>2 Task: Compare average load on system CPU for 1 hour today with average load for the same period yesterday and notify if it is more than 2 times larger
- 22. © Zabbix TemplateA template is a set of elements that can be conveniently applied to manage monitoring of multiple hosts. Nested templates allow to manage different hosts efficiently. Mail Server #1 Mail Server #2 Web Server Template_MailSe rver Template_WebSer ver Template_AppSer ver Template_ Linux Template_P ostfix Template_B acula Template_A pache Template_ MySQL Application Server Template_J Boss
- 23. © Zabbix Main FunctionsCollect 21 Store 25 Manage 26 Alert 27 Visualize 28
- 24. © Zabbix Collect data Data is gathered using various methods, including Zabbix native agents and agent-less options: SNMP ver.1, 2, 3, IPMI, trappers, SSH, Telnet. Hardwar e Any application that Customer depends on. Network OS Middlewa re Applicati ons
- 25. © Zabbix Automated Device Management Way to manage 200,000 devices and more Network discover y Auto- registrati on Low- level discover Periodically search within IP+Port range for a certain reply Conditio n Create/delete Host and assign Template Action New device arrives ! New file system added! Install Zabbix agent on a new device, provide Zabbix server location Condition Create/delete Host and assign Template Action Periodically search on all Hosts for a new / missing components For existing Hosts Create/delete Items for existing host Action
- 26. © Zabbix Collect data | Web Monitoring Response code, time, and speed (200; 5ms; 256kB/s) Web scenarios, including login/logout, are supported HTTP and HTTPS are supported Check for pre-defined string [word/number] is supported
- 27. © Zabbix Store data Relation database (MySQL, PostgreSQL, Oracle, DB2, SQLite) Unlimited amount of historical data Support of NoSQL storages (like Cassandra) is coming Reuse stored data at any time
- 28. © Zabbix Manage data History Built-in data reduction Averaged historical data Housekeeping Long term storage Per-item retention periods
- 29. © Zabbix Alert Notification methods: E-mail, SMS, & Jabber Chat message Command Execution Event Acknowledgement function Flexible escalation
- 31. © Zabbix Visualize | GraphsSimple graphs are created automatically, no need to set up Complex graphs may visualize data from different sources
- 32. © Zabbix Visualize | Maps Different available elements Easy editing, Drag and Drop Reference data along elements Nested maps – ability to drill-down UTF-8 support
- 34. © Zabbix Visualize | Screens Compound pages Better context Large display for helpdesk
- 35. © Zabbix Architectur e Zabbix Server 33 Zabbix Proxy 34 Zabbix Agent 39
- 37. © Zabbix Zabbix Proxy Proxy is an aggregator of data collected by Agents Zero maintenance Automatically creates SQLite DB. Other DBs can be used as well Hundreds of devices can work through a single Proxy Zabbix Server Zabbix Proxy
- 38. © Zabbix Web Monitoring by Proxy Headquarters – New York Branch #1 - London Zabbix Server Zabbix Proxy Branch #2 - Paris Zabbix Proxy Web Server
- 39. © Zabbix Zabbix Agent Native agents. Written in C. Small footprint, low system resource usage Available for most platforms
- 40. © Zabbix Agen t Zabbix Agent | Modes Serv er Passive mode Request: CPU load Response: 1.95 Active mode Request: What to check? Response: CPU load, ... CPU load: 4.32 Fan speed (RPM): 3524Free diskspace: 13 Gb Buff er Request frequency set by Agent, 120 sec. by default Higher Performance More secure
- 41. © Zabbix Trouble Free Maintenance Everything, Data and Configuration, is stored in DB. To back-up Zabbix, just back-up corresponding Zabbix DB No DB changes within major versions (Front-end from 2.0.6 works great with Back- end 2.0.0) Agents are backward compatible with Zabbix Server (Agent v.1.2 works fine with Zabbix Server 2.0.6) Starting from Zabbix v.2.2, DB will be upgraded automatically when connected from
- 42. © Zabbix Installation and Deployment OptionsSingle server installation 45 Distributed installation 46 Single Node demployment 47 Distributed with Proxy demployment 48
- 44. © Zabbix Distributed acrossServer 1 Server 3 Zabbix Back-end Server 2 Zabbix Front-End Database
- 45. © Zabbix Single Node Headquart ers Branch #2 Rule for each device has to be created on firewall Zabbix Server
- 46. © Zabbix Distributed by Proxy Headquart ers Branch #2 Zabbix Server Branch #1 Passive Zabbix Proxy Active Zabbix Proxy
- 47. © Zabbix Download Use virtual appliance to test Install from a package (RHEL, CentOS, Debian, Ubuntu) Install from a source 3 options
- 48. © Zabbix Strategy & Services Strategy 46 Services 47 Partners 48
- 49. © Zabbix Strategy Stay Open Source Concentrate on enterprise-level companies, while continue to be the best solution for small and medium companies Deliver improvements regularly Listen to customers’ needs, while defining strategy ourselves.
- 50. © Zabbix Professional training Our ServicesConsulting Turn-Key Solution Technical Support Remote Troubleshoo ting Developme nt Upgrade Template Building Obtain knowledge Build around customer s to fit their unique business needs, requirem ents and Talk to expert Outsource set-up Technical Advise Get assistance Optim ize Get new version Add unique device
- 51. © Zabbix Partner Network partners are actively involved in Zabbix promotion all over the 5 1 6
- 52. © Zabbix Upcoming TrainingsLocation Dates Language San Diego, USA 9-13 December English Riga, Latvia 9-13 December English Osaka, Japan 20-24 January Japanese Osaka, Japan 16-18 April Japanese
- 53. Next Topic «Tune your Zabbix for Better Performance» Presenter: Alexei Vladishev, CEO, Founder When: December 5, 2013, 17:00 GMT+2 How to register: Follow us for announcement or check www.zabbix.com/webinars.php twitter.com/zabbi x google.com/+Zab bix linkedin.com/company/zab bix facebook.com/zabbix
Notes de l'éditeur
- 1
- 2
- 3
- 5
- 6
- 7
- 8
- 9
- 10
- 11
- 12
- 13
- 14
- 15
- 16
- 17
- 18
- 19
- 20
- 21
- 22
- 23
- 24
- 25
- 26
- 27
- 28
- 29
- 30
- 31
- 32
- 33
- 34
- 35
- 36
- 37
- 38
- 39
- 40
- 41
- 42
- 43
- 44
- 45
- 46
- 47
- 48
- 49
- 50
- 51
- 52