Contenu connexe
Similaire à Hitting the Wall - company growth outpaces infrastructure (20)
Hitting the Wall - company growth outpaces infrastructure
- 1. ©
2008, 2012, Eric M. Ross
Hitting the Wall
Companies need to change as they grow. This change generally must include management
approach, organization, processes, systems, and working capital availability. If a company does
not change these aspects of the business at least once or twice each time it increases its top-line
10-fold, it seriously risks losing its ability to operate and do business efficiently and effectively,
usually due to increasing size and complexity and an increasingly inadequate infrastructure.
Many U.S. companies have been badly harmed or have gone out of business, for this very reason.
In general, as doing business becomes tougher with growth, there are several symptoms of the
pending problem. The most general (but not always present) are 1) increasing difficulty in
making a profit, 2) a growing sense that things are out of control, 3) an increasing bureaucratic
burden and/or increasing need for ad hoc actions, 4) increasing cash flow problems, and 5) a
change from a sense of optimism and a spirit of cooperation, to growing levels of stress and
internal discord. Companies in this situation often start taking drastic measures to maintain
performance, and company leadership often feels it has “hit a wall.” Although “emergency” ad
hoc measures often temporarily halt cash flow and profitability decline, they do not correct the
underlying problem, and other symptoms may surface (a more complete listing of symptoms is on
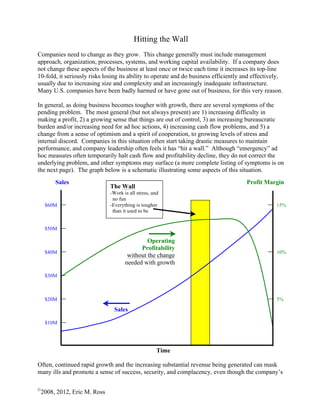
the next page). The graph below is a schematic illustrating some aspects of this situation.
Often, continued rapid growth and the increasing substantial revenue being generated can mask
many ills and promote a sense of success, security, and complacency, even though the company’s
Sales
Operating
Profitability
without the change
needed with growth
The Wall
-Work is all stress, and
no fun
-Everything is tougher
than it used to be
$10M
$20M
$30M
$40M
$50M
Sales Profit Margin
5%
10%
15%$60M
Time
- 2. ©
2008, 2012, Eric M. Ross
ability to perform efficiently and effectively may be rapidly diminishing. Key symptoms of being
in this condition—in which growth and dynamics of the business have outpaced the changes
needed to maintain and improve efficiency and effectiveness—are outlined below. Typically,
several to many, but not all of the symptoms will be present, and the number of those present will
increase as the company continues on its path to, into, and through the wall, without the needed
internal change.
• There is little or no profitability growth, except for temporary gains from traditional cost
cutting measures, and profitability may well be in an increasing decline.
• Cash availability increasingly lags cash needs.
• Often, the company finds itself struggling with either 1) a growing loss of former customers
with sales growth being maintained through an increasing rate of investment in selling and/or
in the acquisition of other companies (this is the usual case) or 2) the start of a difficult-to-
explain decline in sales growth.
• In some instances of case “2)” above, sales rapidly plateaus.
• The company is losing internal connectivity and/or is increasingly challenged by a lack of
integration. There usually are a number of islands of automation, islands of sophistication,
and/or islands of operation, and the company is becoming more and more “stove-piped.”
• Quality and workmanship and/or timeliness seem to be or are degrading, quality issues are
increasing, or there are more and more instances of disgruntled customers and of process
failure.
• Senior management is generating lots of initiatives and changes to try to make things better;
decisions are becoming more ad hoc and reactive; and cash is being “thrown” at problems.
• Process improvement is increasingly ad hoc, based on instant problems and needs and often
visionary – but usually independently generated – initiatives.
• Sub-processes and sub-organizations increasingly operate (at least partially) in a manner that
is detrimental to the organization’s overall best interest.
• The company is frequently reorganizing itself.
• There are more and more instances of changes made in one area causing problems in others.
• Getting things done becomes more and more challenging.
• Written standards, policies, and procedures either are generally lacking or are limited to a
very few areas and are often informal or are outdated or bureaucratic and aren’t being used.
• There is increased frustration, inconsistency, stress, and disruption, at all levels;
• There are growing indications of employee dissatisfaction, often including growing employee
turnover.
• More and more employees become disconnected from driving the company forward and
become more inwardly focused. Employees become increasingly focused on self-promotion
and preservation, rather than on performance.
• There are more and more disagreements among individuals and departments on what the top
priorities should be for the organization.
- 3. ©
2008, 2012, Eric M. Ross
• Owners, if the company is privately owned, are becoming or are increasingly discouraged.
The graph below depicts an actual example. The company—a manufacturer of electronic test
equipment, located in southeastern New England—was owned by three business partners until its
sale in late 1995. The graph is an approximate illustration, recreated from memory, of the
company’s financial performance. At that time, the company was continuing its steady growth of
about 20%/year, that had been underway for a number of years. Although proactive investments
had been made in manufacturing automation and technology, in a fine plant, and in establishing
small operating divisions in key market geographical areas; most aspects of how the company
was managed, its processes, its operating procedures, its systems, and its approach to information
processing automation remained much as they had been or only had slightly changed from where
they had been when the company was much smaller (in annual sales).
As a result, although sales were continuing to increase, profitability and then actual profit were in
significant declines. A proactive performance improvement effort was started in 1994 (the
vertical dotted line), which led to a number of management changes, systems initiatives, and
process improvements. In part due to the somewhat unique nature of this manufacturing
company, these—in turn—led to a fairly quick reversal of the trend, as illustrated by the dashed
green line. This reversal was augmented by a significant downsizing, done to position the
company for a more profitable sale. The dashed portion of the blue annual sales line indicates the
then projected continued growth in sales, prior to the changes within and the sale of the company.
Sales
Operating Profitability
$5M
$10M
$15M
$20M
$25M
Sales Profit Margin
X%
2X%
$30M
Time