January 2013's Monthly Indicators report
•
0 j'aime•369 vues

The document provides a monthly summary of housing market indicators for the Greater Boston region. Key points include: - Closed home sales increased 15.3% for single-family homes and 22.3% for condominiums compared to the previous January. - The median sales price rose 6.0% for single-family homes to $430,000 and 3.5% for condominiums to $367,250. - Inventory levels decreased substantially while months supply of inventory also declined, signaling a stronger seller's market.

Recommandé
Recommandé
Contenu connexe
Tendances
Tendances (17)
Similaire à January 2013's Monthly Indicators report
Similaire à January 2013's Monthly Indicators report (20)
Plus de Unit Realty Group
Plus de Unit Realty Group (20)
January 2013's Monthly Indicators report
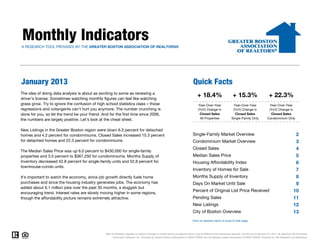
- 1. Monthly Indicators A RESEARCH TOOL PROVIDED BY THE GREATER BOSTON ASSOCIATION OF REALTORS® January 2013 Quick Facts The idea of doing data analysis is about as exciting to some as renewing a driver's license. Sometimes watching monthly figures can feel like watching + 18.4% + 15.3% + 22.3% grass grow. Try to ignore the confusion of high school statistics class – those Year-Over-Year Year-Over-Year Year-Over-Year regressions and cotangents can't hurt you anymore. The number crunching is (YoY) Change in (YoY) Change in (YoY) Change in done for you, so let the trend be your friend. And for the first time since 2006, Closed Sales Closed Sales Closed Sales the numbers are largely positive. Let's look at the cheat sheet. All Properties Single-Family Only Condominium Only New Listings in the Greater Boston region were down 6.3 percent for detached homes and 4.2 percent for condominiums. Closed Sales increased 15.3 percent Single-Family Market Overview 2 for detached homes and 22.3 percent for condominiums. Condominium Market Overview 3 Closed Sales 4 The Median Sales Price was up 6.0 percent to $430,000 for single-family properties and 3.5 percent to $367,250 for condominiums. Months Supply of Median Sales Price 5 Inventory decreased 42.8 percent for single-family units and 52.8 percent for Housing Affordability Index 6 townhouse-condo units. Inventory of Homes for Sale 7 It's important to watch the economy, since job growth directly fuels home Months Supply of Inventory 8 purchases and since the housing industry generates jobs. The economy has Days On Market Until Sale 9 added about 6.1 million jobs over the past 35 months, a sluggish but encouraging trend. Interest rates are slowly moving higher in some regions, Percent of Original List Price Received 10 though the affordability picture remains extremely attractive. Pending Sales 11 New Listings 12 City of Boston Overview 13 Click on desired metric to jump to that page. Data is refreshed regularly to capture changes in market activity so figures shown may be different than previously reported. Current as of February 22, 2013. All data from MLS Property Information Network, Inc. Provided by Greater Boston Association of REALTORS® and the Massachusetts Association of REALTORS®. Powered by 10K Research and Marketing.
- 2. Single-Family Market Overview Key market metrics for the current month and year-to-date figures for Single-Family Homes Only. Key Metrics Historical Sparklines Jan-2012 Jan-2013 +/– YTD 2012 YTD 2013 +/– Closed Sales 522 602 + 15.3% 522 602 + 15.3% 1-2010 1-2011 1-2012 1-2013 Median Sales Price $405,500 $430,000 + 6.0% $405,500 $430,000 + 6.0% 1-2010 1-2011 1-2012 1-2013 Housing Affordability Index 120 122 + 1.7% 120 122 + 1.7% 1-2010 1-2011 1-2012 1-2013 Inventory of Homes for Sale 3,649 2,407 - 34.0% -- -- -- 1-2010 1 2010 1-2011 1 2011 1-2012 1 2012 1-2013 1 2013 Months Supply of Inventory 7.0 4.0 - 42.8% -- -- -- 1-2010 1-2011 1-2012 1-2013 Days on Market Until Sale 130 109 - 16.3% 130 109 - 16.3% 1-2010 1-2011 1-2012 1-2013 Percent of Original 90.5% 93.8% + 3.7% 90.5% 93.8% + 3.7% List Price Received 1-2010 1-2011 1-2012 1-2013 Pending Sales 540 584 + 8.1% 540 584 + 8.1% 1-2010 1-2011 1-2012 1-2013 New Listings 963 902 - 6.3% 963 902 - 6.3% 1-2010 1-2011 1-2012 1-2013 All data from MLS Property Information Network, Inc. Provided by the Greater Boston Association of REALTORS® and the Massachusetts Association of REALTORS®. Powered by 10K Research and Marketing. | Click for Cover Page | 2
- 3. Condominium Market Overview Key market metrics for the current month and year-to-date figures for Condominium Properties Only. Key Metrics Historical Sparklines Jan-2012 Jan-2013 +/– YTD 2012 YTD 2013 +/– Closed Sales 412 504 + 22.3% 412 504 + 22.3% 1-2010 1-2011 1-2012 1-2013 Median Sales Price $355,000 $367,250 + 3.5% $355,000 $367,250 + 3.5% 1-2010 1-2011 1-2012 1-2013 Housing Affordability Index 136 141 + 4.0% 136 141 + 4.0% 1-2010 1-2011 1-2012 1-2013 Inventory of Homes for Sale 2,970 1,715 - 42.3% -- -- -- 1-2010 1 2010 1-2011 1 2011 1-2012 1 2012 1-2013 1 2013 Months Supply of Inventory 7.2 3.4 - 52.8% -- -- -- 1-2010 1-2011 1-2012 1-2013 Days on Market Until Sale 125 88 - 29.6% 125 88 - 29.6% 1-2010 1-2011 1-2012 1-2013 Percent of Original 93.0% 96.0% + 3.2% 93.0% 96.0% + 3.2% List Price Received 1-2010 1-2011 1-2012 1-2013 Pending Sales 483 618 + 28.0% 483 618 + 28.0% 1-2010 1-2011 1-2012 1-2013 New Listings 954 914 - 4.2% 954 914 - 4.2% 1-2010 1-2011 1-2012 1-2013 All data from MLS Property Information Network, Inc. Provided by the Greater Boston Association of REALTORS® and the Massachusetts Association of REALTORS®. Powered by 10K Research and Marketing. | Click for Cover Page | 3
- 4. Closed Sales A count of the actual sales that have closed in a given month. January Year to Date Single-Family YoY Change Condominium YoY Change Feb-2012 464 + 32.2% 384 + 12.3% Mar-2012 648 + 16.5% 607 + 11.0% 602 602 Apr-2012 743 + 12.6% 758 + 20.1% 522 504 522 504 May-2012 1,005 + 20.5% 1,012 + 32.1% 460 460 Jun-2012 1,510 + 21.3% 1,264 + 20.3% 400 412 400 412 Jul-2012 1,279 + 25.3% 1,040 + 21.6% Aug-2012 1,299 + 26.0% 1,203 + 25.2% Sep-2012 766 - 1.2% 753 + 16.4% Oct-2012 791 + 28.6% 711 + 38.9% Nov-2012 906 + 32.5% 759 + 35.1% Dec-2012 824 + 11.8% 765 + 19.0% 2011 2012 2013 2011 2012 2013 2011 2012 2013 2011 2012 2013 Jan-2013 602 + 15.3% 504 + 22.3% +13.5% +15.3% +3.0% +22.3% +13.5% +15.3% +3.0% +22.3% Total 10,837 + 20.0% 9,760 + 23.1% Single-Family Condominium Single-Family Condominium Historical Closed Sales Activity Single-Family Condominium 1,800 1,600 1,400 1,200 1,000 800 600 400 200 Jan-2003 Jan-2004 Jan-2005 Jan-2006 Jan-2007 Jan-2008 Jan-2009 Jan-2010 Jan-2011 Jan-2012 Jan-2013 All data from MLS Property Information Network, Inc. Provided by the Greater Boston Association of REALTORS® and the Massachusetts Association of REALTORS®. Powered by 10K Research and Marketing. | Click for Cover Page | 4
- 5. Median Sales Price Median price point for all closed sales, not accounting for seller concessions, in a given month. January Year to Date Single-Family YoY Change Condominium YoY Change Feb-2012 $395,000 + 3.9% $370,000 + 6.2% $449,000 $449,000 Mar-2012 $414,838 - 1.5% $340,000 + 4.6% $430,000 $430,000 $405,500 $405,500 Apr-2012 $418,500 - 2.9% $371,500 + 4.6% $367,250 $367,250 $356,000 $355,000 $356,000 $355,000 May-2012 $465,000 + 1.4% $381,000 + 4.4% Jun-2012 $503,250 - 0.3% $400,000 + 6.7% Jul-2012 $510,000 + 2.0% $387,000 + 6.3% Aug-2012 $490,000 - 1.8% $380,000 + 3.0% Sep-2012 $430,475 - 4.3% $375,000 + 2.0% Oct-2012 $430,000 + 10.3% $366,265 + 5.1% Nov-2012 $448,250 + 6.0% $380,000 + 8.4% Dec-2012 $470,000 + 6.8% $383,000 + 11.0% 2011 2012 2013 2011 2012 2013 2011 2012 2013 2011 2012 2013 Jan-2013 $430,000 + 6.0% $367,250 + 3.5% -9.7% +6.0% -0.3% +3.5% -9.7% +6.0% -0.3% +3.5% Median $460,000 + 2.2% $380,000 + 5.6% Single-Family Condominium Single-Family Condominium Historical Median Sales Price Single-Family Condominium $550,000 $500,000 $450,000 $400,000 $350,000 $300,000 $250,000 Jan-2003 Jan-2004 Jan-2005 Jan-2006 Jan-2007 Jan-2008 Jan-2009 Jan-2010 Jan-2011 Jan-2012 Jan-2013 All data from MLS Property Information Network, Inc. Provided by the Greater Boston Association of REALTORS® and the Massachusetts Association of REALTORS®. Powered by 10K Research and Marketing. | Click for Cover Page | 5
- 6. Housing Affordability Index This index measures housing affordability for the region. An index of 120 means the median household income was 120% of what is necessary to qualify for the median-priced home under prevailing interest rates. A higher number means greater affordability. January Year to Date Single-Family YoY Change Condominium YoY Change 141 141 Feb-2012 124 + 10.4% 131 + 8.3% 136 136 Mar-2012 118 + 15.0% 141 + 8.8% 120 122 120 120 122 120 Apr-2012 116 + 16.0% 129 + 8.2% May-2012 106 + 10.2% 127 + 7.2% 97 97 Jun-2012 100 + 11.7% 124 + 4.9% Jul-2012 101 + 11.2% 130 + 6.9% Aug-2012 105 + 14.1% 132 + 9.1% Sep-2012 121 + 18.5% 137 + 11.6% Oct-2012 120 + 2.3% 139 + 6.8% Nov-2012 117 + 6.5% 135 + 4.3% Dec-2012 113 + 6.5% 136 + 2.9% 2011 2012 2013 2011 2012 2013 2011 2012 2013 2011 2012 2013 Jan-2013 122 + 1.7% 141 + 4.0% +24.3% +1.7% +13.4% +4.0% +24.3% +1.7% +13.4% +4.0% Average 114 +10.3% 134 +6.9% Single-Family Condominium Single-Family Condominium Historical Housing Affordability Index Single-Family Condominium 150 140 130 120 110 100 90 80 70 60 Jan-2004 Jan-2005 Jan-2006 Jan-2007 Jan-2008 Jan-2009 Jan-2010 Jan-2011 Jan-2012 Jan-2013 All data from MLS Property Information Network, Inc. Provided by the Greater Boston Association of REALTORS® and the Massachusetts Association of REALTORS®. Powered by 10K Research and Marketing. | Click for Cover Page | 6
- 7. Inventory of Homes for Sale The number of properties available for sale in active status at the end of a given month. January Single-Family YoY Change Condominium YoY Change Feb-2012 4,040 + 6.7% 3,256 - 16.7% 3,734 3,649 3,672 Mar-2012 4,664 + 2.0% 3,689 - 21.2% Apr-2012 5,014 - 4.5% 3,842 - 25.7% 2,970 May-2012 5,111 - 9.8% 3,655 - 29.9% 2,407 Jun-2012 4,792 - 15.3% 3,389 - 33.4% Jul-2012 4,364 - 20.9% 3,125 - 33.6% 1,715 Aug-2012 4,016 - 24.1% 2,722 - 35.4% Sep-2012 4,216 - 24.3% 2,840 - 34.2% Oct-2012 3,925 - 26.5% 2,602 - 36.4% Nov-2012 3,271 - 27.9% 2,194 - 38.8% Dec-2012 2,406 - 33.3% 1,642 - 41.6% 2011 2012 2013 2011 2012 2013 Jan-2013 2,407 - 34.0% 1,715 - 42.3% -2.3% -34.0% -19.1% -42.3% Average 4,019 - 17.5% 2,889 - 31.7% Single-Family Condominium Historical Inventory of Homes for Sale Single-Family Condominium 9,000 8,000 7,000 6,000 5,000 4,000 3,000 2,000 1,000 Jan-2003 Jan-2004 Jan-2005 Jan-2006 Jan-2007 Jan-2008 Jan-2009 Jan-2010 Jan-2011 Jan-2012 Jan-2013 All data from MLS Property Information Network, Inc. Provided by the Greater Boston Association of REALTORS® and the Massachusetts Association of REALTORS®. Powered by 10K Research and Marketing. | Click for Cover Page | 7
- 8. Months Supply of Inventory The inventory of homes for sale at the end of a given month, divided by the average monthly pending sales from the last 12 months. January Single-Family YoY Change Condominium YoY Change 9.2 Feb-2012 8.7 - 19.3% 8.5 - 25.8% 8.1 Mar-2012 7.2 - 12.5% 6.1 - 29.0% 7.2 Apr-2012 6.7 - 15.2% 5.1 - 38.1% 7.0 May-2012 5.1 - 25.1% 3.6 - 46.9% Jun-2012 3.2 - 30.2% 2.7 - 44.6% Jul-2012 3.4 - 36.8% 3.0 - 45.4% 4.0 Aug-2012 3.1 - 39.8% 2.3 - 48.4% 3.4 Sep-2012 5.5 - 23.5% 3.8 - 43.5% Oct-2012 5.0 - 42.8% 3.7 - 54.2% Nov-2012 3.6 - 45.5% 2.9 - 54.7% Dec-2012 2.9 - 40.4% 2.1 - 50.9% 2011 2012 2013 2011 2012 2013 Jan-2013 4.0 - 42.8% 3.4 - 52.8% -13.9% -42.8% -21.5% -52.8% Average 4.9 - 26.4% 4.0 - 38.5% Single-Family Condominium Historical Months Supply of Inventory Single-Family Condominium 16 14 12 10 8 6 4 2 0 Jan-2004 Jan-2005 Jan-2006 Jan-2007 Jan-2008 Jan-2009 Jan-2010 Jan-2011 Jan-2012 Jan-2013 All data from MLS Property Information Network, Inc. Provided by the Greater Boston Association of REALTORS® and the Massachusetts Association of REALTORS®. Powered by 10K Research and Marketing. | Click for Cover Page | 8
- 9. Days on Market Until Sale Average number of days between when a property is listed and when an offer is accepted in a given month. January Year to Date Single-Family YoY Change Condominium YoY Change Feb-2012 134 + 3.7% 123 - 9.8% 130 131 130 131 125 125 Mar-2012 130 - 3.1% 117 - 4.6% 114 114 Apr-2012 120 - 1.7% 98 - 16.8% 109 109 May-2012 96 - 5.9% 86 - 11.9% 88 88 Jun-2012 90 - 0.2% 75 - 20.4% Jul-2012 80 - 3.9% 71 - 20.6% Aug-2012 87 - 5.8% 76 - 18.3% Sep-2012 89 - 12.0% 85 - 18.1% Oct-2012 90 - 17.6% 84 - 11.4% Nov-2012 89 - 17.9% 76 - 30.5% Dec-2012 97 - 12.4% 84 - 30.0% 2011 2012 2013 2011 2012 2013 2011 2012 2013 2011 2012 2013 Jan-2013 109 - 16.3% 88 - 29.6% +14.7% -16.3% -4.7% -29.6% +14.7% -16.3% -4.7% -29.6% Total 97 - 7.7% 79 - 17.3% Single-Family Condominium Single-Family Condominium Historical Days on Market Until Sale Single-Family Condominium 160 140 120 100 80 60 40 Jan-2003 Jan-2004 Jan-2005 Jan-2006 Jan-2007 Jan-2008 Jan-2009 Jan-2010 Jan-2011 Jan-2012 Jan-2013 All data from MLS Property Information Network, Inc. Provided by the Greater Boston Association of REALTORS® and the Massachusetts Association of REALTORS®. Powered by 10K Research and Marketing. | Click for Cover Page | 9
- 10. Percent of Original List Price Received Percentage found when dividing a property’s sales price by its original list price, then taking the average for all properties sold in a given month, not accounting for seller concessions. January Year to Date Single-Family YoY Change Condominium YoY Change Feb-2012 91.2% + 0.3% 93.4% + 1.5% Mar-2012 93.0% + 0.7% 94.0% + 0.9% 96.0% 96.0% Apr-2012 93.5% + 0.8% 95.7% + 2.0% 90.9% 90.5% 93.8% 92.3% 93.0% 90.9% 90.5% 93.8% 92.3% 93.0% May-2012 95.4% + 1.1% 96.1% + 1.0% Jun-2012 95.3% + 0.8% 96.4% + 1.8% Jul-2012 95.8% + 1.6% 96.6% + 1.7% Aug-2012 94.8% + 1.5% 96.3% + 2.2% Sep-2012 94.6% + 1.5% 96.4% + 2.3% Oct-2012 94.3% + 2.8% 95.9% + 2.5% Nov-2012 94.6% + 2.3% 96.2% + 2.5% Dec-2012 94.2% + 2.2% 96.2% + 3.4% 2011 2012 2013 2011 2012 2013 2011 2012 2013 2011 2012 2013 Jan-2013 93.8% + 3.7% 96.0% + 3.2% -0.5% +3.7% +0.7% +3.2% -0.5% +3.7% +0.7% +3.2% Average 94.5% + 1.6% 95.9% + 2.1% Single-Family Condominium Single-Family Condominium Historical Percent of Original List Price Received Single-Family Condominium 99% 98% 97% 96% 95% 94% 93% 92% 91% 90% 89% Jan-2003 Jan-2004 Jan-2005 Jan-2006 Jan-2007 Jan-2008 Jan-2009 Jan-2010 Jan-2011 Jan-2012 Jan-2013 All data from MLS Property Information Network, Inc. Provided by the Greater Boston Association of REALTORS® and the Massachusetts Association of REALTORS®. Powered by 10K Research and Marketing. | Click for Cover Page | 10
- 11. Pending Sales A count of the properties in UAG status between the first and last day in a given month, regardless of current status (based on Off Market Date). January Year to Date Single-Family YoY Change Condominium YoY Change Feb-2012 639 + 22.2% 635 + 24.3% 618 618 Mar-2012 982 + 25.1% 1,009 + 32.2% 584 584 Apr-2012 1,142 + 21.7% 1,047 + 24.6% 540 540 483 483 May-2012 1,326 + 23.1% 1,266 + 28.9% 423 423 Jun-2012 1,255 + 13.3% 1,040 + 19.4% 407 407 Jul-2012 1,045 + 26.4% 831 + 9.1% Aug-2012 896 + 17.1% 817 + 22.5% Sep-2012 842 + 28.0% 718 + 38.6% Oct-2012 870 + 17.9% 821 + 38.9% Nov-2012 793 + 17.5% 666 + 18.5% Dec-2012 599 + 6.4% 507 + 8.3% 2011 2012 2013 2011 2012 2013 2011 2012 2013 2011 2012 2013 Jan-2013 584 + 8.1% 618 + 28.0% +27.7% +8.1% +18.7% +28.0% +27.7% +8.1% +18.7% +28.0% Total 10,973 + 19.3% 9,975 + 24.4% Single-Family Condominium Single-Family Condominium Historical Pending Sales Activity Single-Family Condominium 1,400 1,200 1,000 800 600 400 200 Jan-2003 Jan-2004 Jan-2005 Jan-2006 Jan-2007 Jan-2008 Jan-2009 Jan-2010 Jan-2011 Jan-2012 Jan-2013 All data from MLS Property Information Network, Inc. Provided by the Greater Boston Association of REALTORS® and the Massachusetts Association of REALTORS®. Powered by 10K Research and Marketing. | Click for Cover Page | 11
- 12. New Listings A count of the properties that have been newly listed on the market in a given month. January Year to Date Single-Family YoY Change Condominium YoY Change Feb-2012 1,319 + 50.1% 1,141 + 5.6% Mar-2012 2,008 + 3.3% 1,740 - 11.7% 963 974 954 963 974 954 Apr-2012 1,798 - 8.8% 1,499 - 13.0% 902 914 902 914 837 837 May-2012 1,783 - 4.6% 1,387 - 7.6% Jun-2012 1,351 - 15.4% 1,152 - 14.2% Jul-2012 1,022 - 12.5% 902 - 7.6% Aug-2012 1,001 - 8.7% 790 - 7.5% Sep-2012 1,419 - 10.2% 1,153 - 9.6% Oct-2012 1,078 - 4.6% 881 - 2.1% Nov-2012 648 - 3.4% 562 - 10.2% Dec-2012 364 - 19.5% 317 - 18.3% 2011 2012 2013 2011 2012 2013 2011 2012 2013 2011 2012 2013 Jan-2013 902 - 6.3% 914 - 4.2% +15.1% -6.3% -2.1% -4.2% +15.1% -6.3% -2.1% -4.2% Total 14,693 - 4.1% 12,438 - 8.5% Single-Family Condominium Single-Family Condominium Historical New Listing Activity Single-Family Condominium 2,750 2,500 2,250 2,000 1,750 1,500 1,250 1,000 750 500 250 0 Jan-2003 Jan-2004 Jan-2005 Jan-2006 Jan-2007 Jan-2008 Jan-2009 Jan-2010 Jan-2011 Jan-2012 Jan-2013 All data from MLS Property Information Network, Inc. Provided by the Greater Boston Association of REALTORS® and the Massachusetts Association of REALTORS®. Powered by 10K Research and Marketing. | Click for Cover Page | 12
- 13. City of Boston – Market Overview Key market metrics for the current month and year-to-date figures for the City of Boston. Key Metrics Historical Sparklines Jan-2012 Jan-2013 +/– YTD 2012 YTD 2013 +/– Closed Sales 240 266 + 10.8% 240 266 + 10.8% 1-2010 1-2011 1-2012 1-2013 Median Sales Price $380,000 $412,500 + 8.6% $380,000 $412,500 + 8.6% 1-2010 1-2011 1-2012 1-2013 Housing Affordability Index 120 122 + 1.7% 120 122 + 1.7% 1-2010 1-2011 1-2012 1-2013 Inventory of Homes for Sale 1,572 809 - 48.5% -- -- -- 1-2010 1 2010 1-2011 1 2011 1-2012 1 2012 1-2013 1 2013 Months Supply of Inventory 6.6 3.0 - 53.6% -- -- -- 1-2010 1-2011 1-2012 1-2013 Days on Market Until Sale 120 76 - 36.2% 120 76 - 36.2% 1-2010 1-2011 1-2012 1-2013 Percent of Original 92.9% 96.4% + 3.8% 92.9% 96.4% + 3.8% List Price Received 1-2010 1-2011 1-2012 1-2013 Pending Sales 267 302 + 13.1% 267 302 + 13.1% 1-2010 1-2011 1-2012 1-2013 New Listings 569 483 - 15.1% 569 483 - 15.1% 1-2010 1-2011 1-2012 1-2013 All data from MLS Property Information Network, Inc. Provided by the Greater Boston Association of REALTORS® and the Massachusetts Association of REALTORS®. Powered by 10K Research and Marketing. | Click for Cover Page | 13