PSMJ Newsletter October 2015-The place where A/E/C firm leaders get proven advice for their thorniest challenges!
•
1 j'aime•1,438 vues

Where can you find the most innovative results-driven strategies and tactics for A/E/C firm leaders? It is all right here...in every issue of Professional Services Management Journal. PSMJ is one of the fastest-growing and most action-oriented sources of proven advice...for less than you probably spend on coffee each week! We've been hard at work making PSMJ more relevant, timely, and action-oriented than ever before! In fact, no other industry publication has the power to transform your firm's growth and your career like PSMJ. Sample a complimentary edition here and then subscribe at http://store.psmj.com/publications/newsletters/professional-services-management-journal/

Recommandé
Recommandé
Contenu connexe
Tendances
Tendances (20)
En vedette
En vedette (20)
Similaire à PSMJ Newsletter October 2015-The place where A/E/C firm leaders get proven advice for their thorniest challenges!
Similaire à PSMJ Newsletter October 2015-The place where A/E/C firm leaders get proven advice for their thorniest challenges! (20)
Dernier
Dernier (20)
PSMJ Newsletter October 2015-The place where A/E/C firm leaders get proven advice for their thorniest challenges!
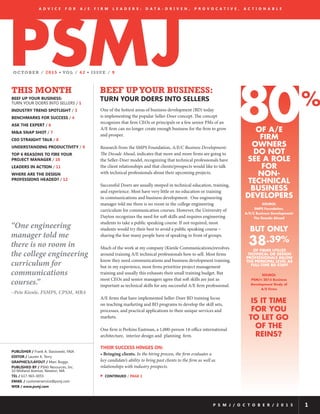
- 1. PSMJOCTOBER / 2015 • VOL / 4 2 • IS S U E / 9 THIS MONTH BEEF UP YOUR BUSINESS: TURN YOUR DOERS INTO SELLERS / 1 INDUSTRY TREND SPOTLIGHT / 3 BENCHMARKS FOR SUCCESS / 4 ASK THE EXPERT / 6 M&A SNAP SHOT / 7 CEO STRAIGHT TALK / 8 UNDERSTANDING PRODUCTIVITY / 9 TOP 6 REASONS TO FIRE YOUR PROJECT MANAGER / 10 LEADERS IN ACTION / 11 WHERE ARE THE DESIGN PROFESSIONS HEADED? / 12 P S M J / O C T O B E R / 2 0 1 5 1 One of the hottest areas of business development (BD) today is implementing the popular Seller-Doer concept. The concept recognizes that firm CEOs or principals or a few senior PMs of an A/E firm can no longer create enough business for the firm to grow and prosper. Research from the SMPS Foundation, A/E/C Business Development: The Decade Ahead, indicates that more and more firms are going to the Seller-Doer model, recognizing that technical professionals have the client relationships and that clients/prospects would like to talk with technical professionals about their upcoming projects. Successful Doers are usually steeped in technical education, training, and experience. Most have very little or no education or training in communications and business development. One engineering manager told me there is no room in the college engineering curriculum for communication courses. However, the University of Dayton recognizes the need for soft skills and requires engineering students to take a public speaking course. If not required, most students would try their best to avoid a public speaking course – sharing the fear many people have of speaking in front of groups. Much of the work at my company (Kienle Communications)revolves around training A/E technical professionals how to sell. Most firms know they need communications and business development training, but in my experience, most firms prioritize project management training and usually this exhausts their small training budget. But most CEOs and senior managers agree that soft skills are just as important as technical skills for any successful A/E firm professional. A/E firms that have implemented Seller-Doer BD training focus on teaching marketing and BD programs to develop the skill sets, processes, and practical applications to their unique services and markets. One firm is Perkins Eastman, a 1,000-person 14-office international architecture, interior design and planning firm. THEIR SUCCESS HINGES ON: • Bringing clients. In the hiring process, the firm evaluates a key candidate’s ability to bring past clients to the firm as well as relationships with industry prospects. BEEF UPYOUR BUSINESS: TURN YOUR DOERS INTO SELLERS A D V I C E F O R A / E F I R M L E A D E R S : D A T A - D R I V E N , P R O V O C A T I V E , A C T I O N A B L E 80% OF A/E FIRM OWNERS DO NOT SEE A ROLE FOR NON- TECHNICAL BUSINESS DEVELOPERS BUT ONLY 38.39% OF FIRMS UTILIZE TECHNICAL OR DESIGN PROFESSIONALS BELOW THE PRINCIPAL LEVEL AS FULL-TIME BD STAFF SOURCE: PSMJ’s 2015 Business Development Study of A/E Firms IS IT TIME FOR YOU TO LET GO OF THE REINS? PUBLISHER / Frank A. Stasiowski, FAIA EDITOR / Lauren K. Terry GRAPHICS/LAYOUT / Marc Boggs PUBLISHED BY / PSMJ Resources, Inc. 10 Midland Avenue, Newton, MA TEL / 617-965-0055 EMAIL / customerservice@psmj.com WEB / www.psmj.com u CONTINUED / PAGE 2 SOURCE: SMPS Foundation, A/E/C Business Development: The Decade Ahead “One engineering manager told me there is no room in the college engineering curriculum for communications courses.” ~Pete Kienle, FSMPS, CPSM, MBA
- 2. P S M J / O C T O B E R / 2 0 1 5 2 • Skills evaluation. The firm evaluates not only the technical skills but also the soft or Seller skills. • Assignment to a Practice Area Leader (PAL). The new employee is assigned to one of the 14 practices and a PAL who helps in developing his technical and business development skills. • Seller-Doer training. The technical professional is coached through workshops and offered 3rd party Seller training. • Becominga “Partner” with clients. The technical professional becomes proficient in critical listening and communications skills necessary to finding out want the client wants and needs and becoming his “Partner” for developing unique solutions. CEOs/firm principals agree that this structured training in both Seller and Doer skills has resulted in increases in work from clients as well as winning new work from prospects. When firms are asked about their first priority, the top answer is more work and more money. Here is a positive and tried and true method for increasing revenue. My advice? Give it a try. l RAPID RECAP: WHAT YOU NEED TO KNOW: 1) Research shows that prospects want to talk with technical staff (preferably a PM) during the selling process. 2) Focus efforts on developing Doers into Sellers 3) The BD goal is to advance from vendor to a partner with the client WHAT YOU NEED TO DO: 1) Put your technical staff into selling roles—provide knowledge as well as training and give them the necessary tools so they can develop their skillset to grow 2) Start early—look for soft skills in new hires and assign a BD mentor at the outset 3) Invest the time in developing the relationship into a trusted partner you will work on solutions together, with your firm doing the work BEEF UP YOUR BUSINESS: TURN YOUR DOERS INTO SELLERS (continued from page 1) Pete Kienle, FSMPS, CPSM, MBA and past SMPS National President, with Kienle Communications LLC has more than 50 years of experience in A/E/C marketing and business development. In addition to reviewing and recommending how to upgrade proposals and marketing materials, the firm specializes in interview coaching and training, and business development training. For more information, call 919-747-1877, e-mail pkienle@kienlecommunications.com or visit www.kienlecommunications.com. J. Dayle Wine is the marketing manager, Washington, DC office, of Perkins Eastman, a 1,000-person, 14- office architecture, interior design, and planning firm. DETERMINING FACTORS IN CHOOSING A FIRM Reputation/Word of Mouth Highly competent, highly professional people and firms Staffing/experience of team members proposed/capability Chemistry between consultant and owner teams Easy to work with Can-do attitude/going above and beyond Best overall proposal, not just cost Project history and relevant experience/track record References Area of expertise Local knowledge Quality of design, work, product/smart design Problem-solving ability/creativity Sustainability/”Green” focus Accessibility Relationship with consultants Track record working with owner Response time/meeting deadlines Price/cost BD ACTIVITIES: LIKES: Specific and formal presentations tailored to owners’ projects or needs Lunch and learns are valuable Seeing the team in their office Industry organizations for networking Industry-wide events Collaboration on new opportunity Introduction to new clients DISLIKES: Cold calls without pertinent information Pitches to the wrong audience General presentations: nothing specific or wrong audience and expectation Meet and greets Being wined and dined Events put on by an individual firm Source: SMPS Foundation, A/E/C Business Development: The Decade Ahead
- 3. A D V I C E F O R A / E F I R M L E A D E R S : D A T A - D R I V E N , P R O V O C A T I V E , A C T I O N A B L E 3 INDUSTRY TREND SPOTLIGHT4 100% 80% 60% 40% 20% 0% -20% -40% YEAR EN D 2004 YEAR EN D 2005 YEAR EN D 2006 YEAR EN D 2007 YEAR EN D 2008 YEAR EN D 2009 YEAR EN D 2010 YEAR EN D 2011 YEAR EN D 2012 YEAR EN D 2013 YEAR EN D 2014 2015 QTR 1 2015 QTR 2 100% 80% 60% 40% 20% 0% -20% -40% -60% -80% YEAR EN D 2004 YEAR EN D 2005 YEAR EN D 2006 YEAR EN D 2007 YEAR EN D 2008 YEAR EN D 2009 YEAR EN D 2010 YEAR EN D 2011 YEAR EN D 2012 YEAR EN D 2013 YEAR EN D 2014 2015 QTR 1 2015 QTR 2 PSMJ’s latest Quarterly Market Forecast data shows continued revenue growth for the A/E industry and a bullish growth outlook from A/E firm leaders. Every quarter, PSMJ surveys A/E firm leaders on their firm’s actual quarterly growth, projected growth, backlog levels, and several other metrics. The following chart summarizes PSMJ’s Net Plus/Minus Index (NPMI) of A/E firm leader sentiment regarding second quarter revenue compared to the first quarter. A positive NPMI indicates that more A/E firm leaders were reporting revenue growth versus revenue contraction. In fact, for the second quarter, the NPMI of +39% has been topped only once since 2004 (when it reached +40% in the end of 2014). Digging deeper into the data, the Housing market is posting continued good results compared to the past years. We have seen gains in multifamily and senior and assisted living for several quarters, but now we are also seeing greater gains as well in the single-family subdivision category, a market that has been in deep depression in the past few years. Despite the increase in workloads, national figures indicate a housing market that is only providing 70% of the new single family units needed to match new family formation, indicating the market still has lots of room for growth. l PSMJ members can access the complete Quarterly Market Forecast report by visiting: http://go.psmj.com/qmf Greg Hart has personally worked with dozens of architecture, engineering, and environmental consulting firms, including many ENR 500 firms, on M&A deals, ownership/leadership transition planning, and business valuations. He has been a frequent contributor to a range of industry publications and spoken to various audiences on topics such as M&A strategy and leadership transition planning. Revenue to Prior Quarter NPMI Trends (Overall) Revenue to Prior Quarter NPMI Trends (Housing Market) RAPID RECAP: WHAT YOU NEED TO KNOW: 1) A/E revenue levels are on the rise, with slow to moderate growth throughout virtually all client markets. 2) The A/E industry is and always will be subject to ‘boom’ and ‘bust’ economic cycles. A period of growth is your chance to build a stronger and more recession-proof organization. WHAT YOU NEED TO DO: 1) Compare your revenue growth to the QMF NPMI trends. How are you trending? Why? 2) If you are seeing a return to growth, now is the time to strengthen to withstand a downturn. That means diversifying into new markets, investing in more efficient project delivery, and developing a contingency plan for cutting overhead. DIDYOU KNOW? Architectural Record recently published a list of the Top 25 U.S. Architecture Firms of 2015, based on 2014 revenue. Topping the list is San Francisco-based firm, Gensler, who surpassed $1 billion in architecture revenue. Yes, that’s billion, with a “B.” And this figure is nearly 250% more than the number 3 firm on the list, Jacobs, of Pasadena. Gensler has 46 offices around the world, on five continents, and more than 3,500 employees. Number 2 on the list was AECOM, with revenue of around $800 million. l
- 4. P S M J / O C T O B E R / 2 0 1 54 RBENCHMARKS FOR SUCCESS TRANSFORMING AN UNDER PERFORMING BUSINESS UNIT INTO A VITAL CONTRIBUTOR TO OVERALL FIRM SUCCESS revenue capacity by direct labor costs results in a target direct labor multiplier, which can be easily determined for each person as well as the business unit. The Modeling Results Can Support Your Business Case & Assist with Top-Down Budgeting. Where to start if you have a business unit that is underperforming? Be sure to start at the top! More specifically, start at the “topline,” which in the financial world refers to a firm’s revenue, the top line of the basic income statement. Many firms’ “topline” includes subconsultants and reimbursable expenses and is sometimes referred to as “total fees” or “gross revenue.” When modeling a business unit, you should be primarily concerned with what your staff can invoice (excluding reimbursable expenses) for their time and effort, which is referred to as “net revenue.” By estimating the net revenue capacity (net revenue does not include subconsultants or reimbursable expenses) for each person as well as for the overall business unit you are forecasting anticipated billings. The details of the model will help you set clear expectations for each person within a unit and each business unit within a firm, and often brings some important questions to light: • Can your business unit generate enough net revenue to meet the goals in the model? • Is your target direct labor multiplier high enough to provide for profit? • Is your business unit generating enough work for employees to reach their chargeability goals? These are just a few issues that the model can help a business unit leader better understand and determine the appropriate action needed to change an underperforming business unit into a business unit that outperforms their goals and contributes at the highest level to overall firm success! HOW TO PUT THIS METHOD INTO ACTION: Step 1:Determine Total Net Revenue Capacity A Net Revenue Capacity Model is based on the number of annual work hours anticipated for each person, with full-time estimated to be 2,080 hours in a year (Input A in the example to the right); the percentage of time that each person in the unit is expected to be working on project work, which is also referred to as the labor utilization rateor chargeability (Input B); and billing rate (Input C).When multiplied together, these metrics provide an overall net revenue target for the business unit (see the blue shaded section at the bottom of Step 1). Step 2: Allocate Labor Costs You can take Step 1 further by including the hourly salary (raw labor without burden) for each person in the business unit as well (Input E in the example below). By adding hourly salary, a natural byproduct of this analysis will include allocation of raw laborcosts (see Step 2 to the right). Based on each person’s utilization, their base salary will either be allocated to direct labor (time spent on projects) or indirect labor (time spent on non-project work). And dividing net Step 1 – Determine Total Net Revenue Capacity; Step 2 – Allocate Labor to Calculate Direct Labor Expense, Indirect Labor Expense, Target Direct Labor Multiplier, and Chargeability (also called Utilization) Prin John 2,080 55% $175 $200,000 Admin Julie 1,560 25% $60 $23,400 PM Kim 2,080 85% $125 $221,000 Jr. PM/Eng Tim 2,000 80% $85 $136,000 Jr. PM/Eng Sue 2,288 90% $95 $195,624 Bus Mgr Peggy 2,080 0% $60 $0 Associate Mike 2,080 80% $145 $241,280 14,168 $106 $1,017,504 TOTAL AVERAGE NET REVENUE ANNUAL BILLING RATE CAPACITY AS WORK HOURS MODELED TOTAL NET REVENUE CAPACITY AS MODELED: $1,017,504 AVERAGE NET REVENUE/TOTAL STAFF AS MODELED: $149,379 POSITION EMPLOYEE # OF ANNUAL EST. % OF TIME HOURLY NET REVENUE WORK HOURS ON PROJECT BILLING/RATE CAPACITY INDICATES AN INPUT A B C D INPUT INPUT INPUT A x B x C STEP 1 - NET REVENUE CAPACITY MODELING E F G H I J K L INPUT A x B INPUT E x F E x G A x E C/E H/J HOURLY # OF # OF DIRECT INDIRECT TOTAL TARGET DIRECT OVERALL SALARY ANNUAL ANNUAL SALARY SALARY ANNUAL LABOR CHARGEABILITY (w/o HOURS ON HOURS ON SALARY MULTIPLIER burden) BILLABLE NON-BILLABLE $50 1,144 936 $57,200 $46,800 $104,000 3.50 $20 390 1,170 $7,800 $23,400 $31,200 3.00 $40 1,768 312 $71,290 $12,581 $83,871 3.10 $28 1,600 400 $45,333 $11,333 $56,667 3.00 $27 2,059 229 $55,893 $6,210 $62,103 3.50 $28 0 2,080 $0 $58,240 $58,240 2.14 $42 1,664 416 $69,888 $17,472 $87,360 3.45 $34 8,625 5,543 $307,404 $176,036 $483,440 3.31 64% AVERAGE TOTAL TOTAL TOTAL OVERALL HOURLY ANNUAL ANNUAL ANNUAL CHARGEABILITY SALARY DIRECT INDIRECT SALARY LABOR LABOR EXPENSE EXPENSE TOTAL DIRECT LABOR EXPENSE: $307,404 TOTAL INDIRECT LABOR EXPENSE: $176,036 TOTAL SALARY EXPENSE: $483,440 TARGET DIRECT LABOR MULTIPLIER: 3.31 OVERALL CHARGEABILITY: 64% STEP 2 - ALLOCATE LABOR COSTS u CONTINUED / PAGE 5
- 5. A D V I C E F O R A / E F I R M L E A D E R S : D A T A - D R I V E N , P R O V O C A T I V E , A C T I O N A B L E 5 Net Revenue Capacity Modeling helps to clearly set expectations for each person within a unit and each business unit within a firm and is the first step in top-down budgeting. Many business unit leaders may challenge the values used as inputs to the model; however, industry benchmarking by peer group(s) is an excellent way to further evaluate the model and defend your decisions with objective and fact-based data. AN EXAMPLE (SEE TABLE ABOVE) Firm Profile: 7 total staff; they practice as engineering sub- consultants; provide services for private clients; and the majority of their revenue is from the Industrial market sector. From this exercise, each business unit can create a model to drive targets for: • Total net revenue capacity as modeled ($1,017,504 for the business unit). • Average net revenue per total staff ($149,379 average; and specific goals for each person, which will differ based on role). • Overall labor utilization rate/chargeability (64% for the business unit; and specific goals for each person). • Target direct labor multiplier (3.31 for the business unit; and if you know your break-even direct labor multiplier for the firm you can review each person’s specific multiplier, based on their billing rate and salary, to make sure each person as well as the business unit meets or exceeds the break-even direct labor multiplier for the firm). BENCHMARKING: Benchmarking data from a reliable source can then be used to test for reasonableness. The data below has been compiled from PSMJ’s 2015 Financial Performance Benchmark Survey Report. For example: • For a firm of 1-20 staff a net revenue per total staff target of $149,379 is above the 75th percentile, but for a firm that serves primarily Industrial clients the target is below the 75th percentile. Depending on the availability for project work this goal may be too high, too low, or it may be a stretch goal for the business unit. • For a firm that practices as an Engineering Subconsultant a target direct labor multiplier of 3.31 could also be a stretch goal, but for a firm with staff size 1-20 it isn’t as much of a stretch. The appropriate target direct labor multiplier depends on the margins available (margins for housing projects tend to be low and margins for industrial projects tend to be higher) in the market sectors served as well as the firm’s overall overhead costs and profit strategy. • For a firm that serves primarily Industrial clients a labor utilization rate of 64% is just below the 75th percentile. Again, if there is adequate work available for the firm this goal may be very reasonable. Monitoring Progress on a Monthly Basis: Once you’ve established the model, you can use it to compare your monthly results by simply dividing the net revenue totals for each person and the business unit by 12. This approach allows you to be proactively managing the business unit’s progress and make mid-course corrections if needed to make sure you’re on track to meet or beat your goals. l Source: PSMJ’s 2015 Financial Performance Benchmark Survey Report and PSMJ’s 2015 Compensation Benchmark Survey Reports Kate Allen, P.E., is Director of A/E/C Industry Surveys for PSMJ. She can be reached at kallen@psmj.com. Source: PSMJ’s 2015 Financial Performance Benchmark Survey Report; additional benchmarking data related to base salary, time allocation, and billing rates can be found in PSMJ’s 2015 Compensation Benchmark Survey Reports. PEER GROUP NET REVENUES PER TOTAL STAFF NET DIRECT LABOR MULTIPLIER ACHIEVED LABOR UTILIZATION RATE (PAYROLL DOLLARS) 25th Percentile $112,445 99,475 116,390 115,370 116,297 Median $127,607 116,313 130,618 130,588 134,546 Mean $130,852 122,743 134,033 134,408 140,811 75th Percentile $146,280 136,284 148,422 151,736 163,361 25th Percentile 2.76 2.73 2.67 2.76 2.50 Median 3.07 3.09 2.98 3.07 2.76 Mean 3.12 3.14 3.01 3.15 2.95 75th Percentile 3.42 3.50 3.32 3.52 3.45 25th Percentile 54.0% 52.8 55.3 53.7 53.6 Median 59.6% 61.6 61.6 59.5 59.9 Mean 60.3% 62.3 61.4 60.5 60.0 75th Percentile 65.6% 69.4 66.5 66.3 66.6 OVERALL STAFF SIZE 1 TO 20 ENGINEERING (SUBCONSULTANT) PRIVATE INDUSTRIAL DIDYOU KNOW? WHAT ARE THE WORLD’S MEGA MEGAPROJECTS? Back in August 2015, Popular Mechanics published a list of what the magazine editors believe are “The World’s 25 Most Impressive Megaprojects.” These are projects with sizes, schedules, dollar figures, and a quantity of contractors that’s almost unfathomable. Here’s are the top 15 costliest of Popular Mechanic’s list. Did your firm work on any of these projects? AL MAKTOUM INTERNATIONAL AIRPORT, DUBAI - 20 YEARS & $31B LONDON CROSSRAIL, LONDON - 11 YEARS & $23B THREE GORGES DAM, CHINA - 17 YEARS & $22B BEIJING DAXING INTERNATIONAL AIRPORT, CHINA - 5 YEARS & $13B JUBAIL INDUSTRIAL CITY, SAUDI ARABIA - 10 YEARS & $11B ETIHAD RAIL, UAE - SCHEDULE UNAVAILABLE & $11B HONG KONG-ZHUHAI-MACAO BRIDGE, CHINA - 7 YEARS & $10.6B SILVER LINE, WASHINGTON DC - 8 YEARS & $6.8B BAY BRIDGE EASTERN SPAN, SAN FRANCISCO-OAKLAND - 12 YEARS & $6.4B PANAMA CANAL EXPANSION, PANAMA - 11 YEARS & $5.25B MARMARAY TUNNEL, TURKEY - 9 YEARS & $4.5B ONE WORLD TRADE CENTER, NEW YORK - 7 YEARS & $3.8B SHANGHAI TOWER, CHINA - 8 YEARS & $2.4B STATE ROUTE 520 FLOATING BRIDGE, SEATTLE -5 YEARS & $2B HYDERABAD METRO RAIL, INDIA - 14 YEARS & $2B BENCHMARK FOR SUCCESS (continued from page 4)
- 6. P S M J / O C T O B E R / 2 0 1 56 "ASK THE EXPERT?QUESTION: I’ve read that the average A/E firm spends something like 4-5% of net revenues on marketing and business development. That’s about what we do as well, but I wonder what you think. Is this enough? (President, 100-person engineering firm) ANSWER: JOHN DOEHRING: In a word, no – but let’s dig a little deeper. More truthfully, this amount might be enough for your firm – depending in part on what ‘enough’ means to you in results. The benchmark you reference refers to the total median expense that organizations report as marketing and business development related. According to PSMJ’s 2015 A/E Financial Performance Benchmark Survey Report, companies do spend between 3.1-5.3% of total net service revenues (NSR) (at the higher level when the firm employs full time business developers, lower if it’s all seller-doers). There are at least two problems with this data. First, a large portion of the expense (66-75%) comes from time—hours charged by professionals and principals to the marketing account. But there’s no information here about productivity—if the time was well spent on growth activities, if what was done was worth the cost. (In fact in too many firms this ‘marketing’ account becomes a safe place to log unbillable and unaccountable hours). A second problem is that much of the remaining marketing expense (25-33%) is focused too much on proposal development. While important, a completely reactive approach to proposal response (without any other business development effort further upstream) is not only ineffective, it’s stupid. PSMJ’s research on organizations in our Circle of Excellence – firms in the top 20% of industry performance – actually report spending less on marketing overall, while simultaneously getting more for their effort. On an investment of 3.9% NSR (verses 5.2% for all respondents), COE firms report 22% growth in revenues and 15% in backlog (median 7% revenue and 9% backlog). This data seems counterintuitive, but suggests that the top firms do a much better job of focusing their marketing and business development investment. Marketing expense at 4-5% of net revenues might be the right number for your firm, but you can almost certainly do a better job of more wisely deploying that investment– on strategic positioning, branding, content development and inbound promotion, client relationship management, and so on. Here’s a few questions for you to consider: 1) What’s the harder part of your business today, finding and capturing the work - or executing the projects once you have them? 2) If you want more growth/success than the median, should you invest more in marketing and sales than others? 3) Where is our industry (and our world) trending – is it becoming easier to break through the noise of the competitive marketplace – or harder? 4) What if you had to spend a lot more on business development (50% or 100% more) in the future – could you adapt your business to survive and succeed? John Doehring is Executive Leader of Advisory Services and Training at PSMJ Resources, Inc. He advises A/E/C firms in the areas of business strategy and planning, marketing and growth, organization development, and operations transformation. He has successfully led dozens of strategic business planning and operational improvement engagements for a wide range of client organizations. John’s passion is helping leaders plan for the future and grow their business. DIDYOU KNOW? WANT TO TAP THE STARTUP MARKET? If your firm is thinking about opening a new branch, you might want to consider a study recently published by NerdWallet, a consumer finance company. The study indicated that smaller cities are popular and productive place for startup companies - just as much as large cities. Many smaller cities have the same resources available to major urban settings, but with lower costs. NerdWallet rated that the top 10 small cities in which to open a startup, and here they are: ALPHARETTA, GEORGIA REDMOND, WASHINGTON WILMINGTON, DELAWARE TROY, MICHIGAN MINNETONKA, MINNESOTA WAUKESHA, WISCONSIN NEWPORT BEACH, CALIFORNIA BETHESDA, MARYLAND GREENVILLE, SOUTH CAROLINA LA CROSSE, WISCONSIN And so, whether you’re thinking of opening a new branch or interested in tapping the startup market, reaching out to small, young companies, it’s worth considering these cities. l How much to spend on marketing and business development – and what to do with your investment – is indeed a key question, and one that must tie directly to the firm’s strategic objectives. So start there with the big stuff: why, where, how, and when. That way you’ll be sure to do enough - for your firm’s growth, profit, and sustainable success! l 7 22 9 15 5.2 3.9 REVENUE GROWTH BACKLOG GROWTH GROWTH RATE (%)MARKETING COSTS (% OF NET REVENUE) MEDIAN FIRM COE FIRM MEDIAN FIRM COE FIRMS COE Firms Used Their Marketing Resources More Effectively
- 7. A D V I C E F O R A / E F I R M L E A D E R S : D A T A - D R I V E N , P R O V O C A T I V E , A C T I O N A B L E 7 TRANSACTION VOLUME UPDATE: PSMJ tracking data is showing relatively stable transaction volume as we start to round the bend towards the last quarter of 2015. The following data is based on the number of announced A/E mergers and acquisitions. THE LATEST DEALS MAKING HEADLINES… North American design firm Stantec (Edmonton, ALB, Canada) signed a letter of intent to acquire Fay, Spofford & Thorndike (Burlington, MA), a 280-person engineering, planning and environmental firm. “FST’s recognized design excellence and commitment to local communities closely align with Stantec’s strengths,” said Bob Gomes, Stantec president and chief executive officer, announcing the acquisition letter of intent. “Together, we bring even greater resources to handle the challenges ahead, whether it’s aging infrastructure, population growth, or general community resilience.” The acquisition is expected to close in October. WSP Global (Montreal, Quebec, Canada) entered into an agreement in connection with the acquisition of all of the issued and outstanding shares of 2,000-person consulting engineering MMM Group Limited (Toronto, Ontario, Canada). MMM Group generated $264 million in net revenues in the fiscal year ended December 31, 2014. WSP will pay an aggregate purchase price of $425 million subject to certain closing and post-closing adjustments. Geotechnology (St. Louis, MO) purchased substantially all of the assets of engineering firm 108-person Thelen Associates (Erlanger, KY). Thelen Associates provides geotechnical engineering and construction materials testing services. Geotechnology provides geotechnical and environmental engineering, geophysics, water resource management, materials testing and drilling services. Geotechnology’s purchase of Thelen’s assets is part of a long-term strategic plan of geographic expansion. GO SOUTH! According to a recent PSMJ study, the South is the U.S. region that is most attractive for growth through acquisition. When firms considering an acquisition were asked what regions they were targeting, nearly half indicated that the South is in their crosshairs. For the purpose of this study, the ‘South’ market is defined as Alabama, Arkansas, District of Columbia, Florida, Georgia, Kentucky, Louisiana, Mississippi, North Carolina, South Carolina, Tennessee, Virginia, and West Virginia. With changing population trends in the nation and the associated infrastructure needs, it comes as no surprise that acquirers are headed south. Here are some must-have tips for success in today’s M&A climate: 1. Expect stronger valuations. This means that buyers may need to put more up-front cash into the deal and get creative on deal structure. 2. Expect more selective sellers. This means that buyers and sellers need to cast a wider net in looking for suitable transaction partners. Ask trusted advisors for some leads or hire a consultant to generate a ‘long list’ for you. 3. Expect fewer resource-driven deals. This means that you are going to be less likely to find sellers with lots of talent but not enough work to do. Sellers are likely to have big backlogs and less likely to be a good fit if you are just looking to add talent resources to your team (e.g. a ‘group hire’). l M&A SNAP SHOT 140 120 100 80 60 40 20 0 2013 2014 2015 Trailing Three-Year Average 50% 45% 40% 35% 30% 25% 20% 15% 10% 5% 0% N ORTH EAST M ID-ATLAN TIC SOUTH EAST SOUTH M IDW EST W EST COAST PACIFIC N ORTH W EST
- 8. P S M J / O C T O B E R / 2 0 1 58 CEO STRAIGHT TALKF YOU NEED TO ENCOURAGE SUCCESSION The Society of Human Resource Management says that 2015 is a “crucial year” for succession planning. Despite that, according to a study by Deloitte, only 1/3 of firms have formal succession plans. Are you among the 2/3 of CEOs clamoring for a plan? If so, allow me to give you some advice: First, to achieve successful succession, we (CEOs and principals) need to be honest with ourselves and others about what will make us happy in the long run. I departed my firm directly and completely at the age of 65. I announced a date of my retirement 15 years before the event so that we could plan correctly and enable leadership continuity of the firm. We had time to test, evaluate, and consider. When the moment of my departure came, I assure you that they were ready. They did not need any more help from me. I had successfully worked myself out of a job. How can you encourage succession in your firm? What to do NOW: • You must plan for succession. Expect the plan to be modified, but have a plan to work against. • Decide (if you can) on the issue of legacy. Do you care more about enabling your firm to continue successfully without you or do you want to maximize the money when you go? • Have an exit contract. Do it early while you are not seen as powerless. • Let all stakeholders know what your plan is. By taking these four steps, you will be encouraging successful succession and growing your business. l Wilson Pollock, FAIA Wilson has been involved with the A/E Design and Construction Industry for more than 40 years, including 34 years as the founder and former president of a Boston-based commercial architecture and interior design firm - ADD, Inc. Under his leadership, ADD Inc. grew to over $20 million a year in revenues and to over two-hundred employees with offices in Massachusetts, California, and Florida. He is now a retired architecture and art professional who lives in Jamestown, RI. We had time to test, evaluate, and consider. When the moment of my departure came, I assure you that they were ready. They did not need any more help from me. A SUCCESSION PLANNING EXERCISE We sincerely hope no firm ever experiences the unexpected loss of a key manager. Unfortunately, such an event can happen to design firms. Do you know how your firm would cope with the loss of an employee? Here is one exercise you can use to help your firm prepare for the shift of responsibilities that must occur when a key team member is suddenly injured, or even killed. At a routine management meeting, unannounced, report that a key manager has been disabled in an accident. This manager should not attend the meeting. Take 30 minutes and have the rest of the managers decide: • Who will assume the duties of the now departed manager or how those duties will be divided. Try and make new individuals responsible for all key aspects of the departed individual. • Determine who will and how clients will be advised of this loss. • How will the changed duties be explained to staff? • Who will and how will the loss be communicated to other firms who are key to the firm (bankers, other project consultants)? The goal is to end the 30 minute exercise with a plan in place to meet the immediate needs of the firm. PSMJ believes this is a worthwhile exercise and it should be repeated at intervals to make sure your firm could react, if needed. The purpose of this exercise is to establish a practice of how an untimely loss will be managed but, not necessarily a fixed plan. Your managers should be prepared to deal with a problem when it occurs. Many issues related to the unexpected loss of a key manager are legal issues where a long period of time is suitable for resolution. Operational issues are immediate and your firm should be prepared to act, if needed. 1/3OF FIRMS HAVE FORMAL SUCCESSION PLANS. AREYOU AMONG THE 2/3 OF CEOS THAT DON’T?
- 9. A D V I C E F O R A / E F I R M L E A D E R S : D A T A - D R I V E N , P R O V O C A T I V E , A C T I O N A B L E UNDERSTANDING PRODUCTIVITY HOW DO YOU MEASURE PRODUCTIVITY? MORE WITH LESS/SAME SALES AND GROWTH MORE CAPABILITY UNABLE TO DEFINE COST REDUCTION 20% 15% 10% 5% 0% WHAT ARE YOUR PLANS TO IMPROVE PRODUCTIVITY IN THE NEXT 12 MONTHS? Identify inefficiencies Review scope of services Review organisational structure Improve utilization of resources Increased training and development These 5 approaches accounted for more than 85% of responses. Research by Melbourne-based Management for Design on the subject of measuring Productivity found that the majority (39%) of firms saw it as “More with less/same,” and surprisingly a third saw it as “Sales and Growth.” WHAT DO YOU NEED TO KNOW? These results are important for design firm leaders for two reasons: • The 33% that think it is “sales and growth” don’t understand the concept of “productivity” - they are confusing it with “production.” Add in the 6% who couldn’t define it, and we see that nearly 40% of the design firm leaders surveyed don’t know what productivity is. • The other 61% of those surveyed DO know what productivity is, and are focused on increasing it by doing “more with less/same” (39%) or “more capability” (19%). Only 3% think that “cutting costs” increases productivity. It rarely does. SO: What is “productivity”? It is defined as the ratio of output volume to input volume – precisely how the 39% view it. Most importantly, productivity is the core component in profitability. Many design firm leaders confuse productivity with utilization, thinking that “pushing up” billable (or chargeable) hours is the way to increase profit. Sure, it’s a factor, but nothing like increasing productivity. For example, if your team can produce 5 hours of billable work in 3 hours, that is very high productivity. It is a very different mental construct from the standard “utilization” thinking that you need to lift your billable hours from 65% to 70% of total hours. Most firms would struggle to increase utlilization by more than a few percent. But look at rework: Most firms don’t know how much rework they do (because they don’t measure it). In the informal surveys I do during training, they estimate it to be in the range of 20-25% of total professional hours. Cutting rework in half would double profitability in a very large percentage of design firms. That is “doing more with less/same.” A further question asked how firms planned to increase productivity. Results: WHAT DO THESE STATISTICS MEAN FOR YOUR FIRM? More than half (54%) of them of them plan to identify inefficiencies, improve utilization of resources, and increase training and development. Another third will be reviewing their services’ scope and organizational structures. To be blunt, if you’re not doing the same things, you’re likely to be left behind those practices that take action in their critical area of their business. In particular, you’ll be less competitive – either earning lower profits at your competitors’ fees or losing projects if you try to retain the same fees. Both lousy options. PSMJ’S ADVICE 1. Consider, as part of your strategic planning effort, whether you are doing enough to maintain an edge with the productivity-savvy 60% of your competitors. 2. If that review causes concern, look at these five approaches that many of your competitors are likely to be taking, and consider whether each of them is as good as it should be in your firm. This means looking at specific improvement programs, the people responsible, how you are measuring results, and whether or not they are on track to delivering real change in your competitive position. 3. If that review shows inadequacies, put in place changes to course- correct. “More with same/less” is a counterintuitive, completely different mindset from the traditional idea that more scope requires proportionally more hours. Instead, those 4 simple words necessarily involve redesign of the design processes, focusing on continual (or radical) improvements in efficiency through challenging the “way we’ve always done it”. What is truly amazing about this data is that this new way of thinking is the focus of 4/10 of firms surveyed. To learn more about design process rethinking, see my website: DesignNode.net u CONTINUED / PAGE 10 9
- 10. P S M J / O C T O B E R / 2 0 1 5 TOP 6 REASONS TO FIREYOUR PROJECT MANAGER Whether your PMs have been on a long-term career track and have gone through project manager training programs (like PSMJ’s PM Bootcamp) or have attained the role of PM through circumstance, they might not be performing up to your—or your team’s—expectations. Here are 6 behaviors that define a bad project manager—and might make you consider a change in staff. NOT HAVING A PLAN A project manager’s whole reason for being is to have a plan and to facilitate its process and completion. PMs need to have numerous plans: plans for the project, plans for meetings and presentations, plans for your team’s tasks during certain phases, etc. If your PMs don’t have a plan, and they’re just winging it, team members (and clients!) will know. NOT COMMUNICATING Project team members are not mind readers. Your PM’s team doesn’t know everything that’s happening with the client, the contractor, or senior management. Good project managers know what’s going on and will keep their team informed - which, in turn, will will motivate the team. NOT SHARING EXPECTATIONS There’s nothing more infuriating for an A/E employee than to put work in front of a supervisor to hear only that it’s not what was expected. PMs need to tell their project team what they expect regarding the quality of their work, their communication with each other, their dress in front of clients, etc. NOT BEING NICE Of course, this goes for any leadership role in any industry. Don’t allow your project manager to be a jerk. And, remember, he/she may act courteously in front of you, but abomindably in front of others. Keep your eye out for mean behavior and let team members know they can come to you with any problems. NOT TAKING RESPONSIBILITY Team members need to be reassured that the buck stops with the project manager (even if it really doesn’t, team members will respect their PM more if the PM takes this stance). You should never catch your PM makeing excuses for project problems and issues. And, they should never blame others for things gone wrong, especially in a group setting. Train your PMs to keep their eyes on the prize—staying goal oriented—with the composure that they are responsible for it all. l David Whitemyer, AIA, is a Contributing Editor at PSMJ Resources, Inc., a licensed architect, and project manager at Brent Johnson Design, a Boston-area firm. He can be reached at dwhitemyer@psmj.com. 4. Be aware that the 40% who really don’t understand productivity are likely to be desperately trying to compete, probably by fee-slashing. You’ll need convincing arguments about why your services may cost more, but deliver better value. 5. If, through better training of your PMs and team leaders, you really do lift productivity, you have the option of lowering your fees and still delivering higher quality. Then the desperate 40% are less of a menace. And if you need help, call PSMJ. We know how to help firms lift their productivity. Learn more on our website, at http://bit.ly/1NzWkQQ for consulting, or http://bit.ly/1UofirH for training. In Australia / New Zealand, go to http://bit.ly/1NzWkQQ. l PSMJ thanks Management for Design (www.M4D.com.au) for permission to use their research results (from the M4D Business Conditions Survey 2012), and M4D Director Rob Peake for suggesting improvements to this article. Charles Nelson, AIA, LFRAIA, is the Director of PSMJ’s Australasia practice. He is also known for writing and speaking extensively on project and practice management. Charles can be reached at cnelson@psmj.com. 97%AN ASTOUNDING 97% OF ORGANIZATIONS BELIEVE PROJECT MANAGEMENT IS CRITICAL TO BUSINESS PERFORMANCE AND ORGANIZATIONAL SUCCESS. (Source: PricewaterhouseCoopers) UNDERSTANDING PRODUCTIVITY (continued from page 9) 10 WRITE FOR PSMJ Do you have some new, innovative tips to share with others about running an A/E firm? Do you have interesting stories about: • Making profits; • Ownership transition; • Human resources; or • The future of A/E? PSMJ is looking for great writers and stories for Professional Services Management Journal! Writing for PSMJ is a remarkable opportunity to enhance your authority, add to your professional resume, bring name recognition to your company, and see your name and contact info in print in a prestigious and highly regarded journal. If you’re interested in writing for us or have a story idea for an upcoming issue, please write to Lauren Terry, PSMJ’s Managing Editor, at lterry@psmj.com.
- 11. A D V I C E F O R A / E F I R M L E A D E R S : D A T A - D R I V E N , P R O V O C A T I V E , A C T I O N A B L E While every project presents a new set of challenges, we live in the paradox of standard details, regulatory constraints, and procedural bureaucracy while constantly needing to respond to the needs of our firm and our clients to innovate around ever-changing technology, science, demographics, and market conditions. Breaking down artificial barriers to solve real problems and do great work separates us from others and we need to continuously raise the bar. The Passion Pursuits program helps fuel that fire. Formally, the Passion Pursuits program gives all employees paid time off and covers expenses to pursue their professional passion. Your professional passion is that simple and pure reason you chose to pursue this career. However, that passion all too often gets lost in the day-to- day grind of the job as the years go by, and we all need to be re-inspired every once in a while. For example, if you have a passion for water quality, and then take a trip to Seattle to learn about what they’re doing to protect the Pugeot Sound. If it’s stormwater management, then see what’s happening in Portland, Oregon. If it’s architecture, then explore Charleston, South Carolina. You get the idea. Meet with local officials. Talk to the consultants. Explore the area. In a nutshell, we announced this program at the end of last year. We gave everyone creative license to define their passion, and develop a pursuit to fit their needs. Some folks are pursuing their passion by themselves and/or tacking on a few extra days to family vacations, while others are teaming up with other staff. All we ask is that upon return of their pursuit, that they share their experience over lunch. We trust our staff and since each passion is unique, we’re very deliberate to not constrain each pursuit. 3) HOW DOES THE PASSION PURSUITS PROGRAM ADDRESS THE NEEDS OF THE NEXT GENERATION OF LEADERS—GEN- XERS AND MILLENNIALS? Not surprisingly, the program is attractive to everyone regardless of when they were born. The millennials are characterized as having the boldness to try new and different things, so a program like this is naturally appealing to them. But the truth is that everyone enjoys what millennials are characterized as enjoying – millennials just had the leverage and courage to demand it. 4) IS THERE A SUCCESS STORY FROM THE PROGRAM THAT YOU CAN SHARE WITH US? This program has magnified the importance of passion in the work we do, which gives more meaning to our work. Additionally, the collaboration among staff in openly sharing their passions and planning their passion pursuits has strengthened the workplace culture. It seems new relationships are being formed around this. Looking forward, we expect that this program will pay dividends as time goes on. The creative ideas and thinking that will emerge from these experiences will bring fresh approaches and solutions to the project challenges we face. 5) WHAT ADVICE DO YOU HAVE FOR FIRM LEADERS WISHING TO INTEGRATE SOMETHING SIMILAR TO THIS? People like authenticity and originality. Be authentic and real. If you can’t, allow others to. l aLEADERS IN ACTION HOW DUSTY ROOD OF RODGERS CONSULTING CREATES A PASSIONATE WORKFORCE Dusty Rood has been the President of Rodgers Consulting, Inc. since December 15, 2014. 4.4% RODGERS’ 3-YEAR TURNOVER AVERAGE 12.3% INDUSTRY AVERAGE SOURCE: PSMJ’s 2015 A/E Financial Performance Benchmark Survey Report. Based out of Germantown, MD, Rodgers has provided planning and engineering services for 58 years. The firm is the recent recipient of PSMJ’s 2015 Circle of Excellence (COE) Award, an honor given only to the top 20% of firms based on a balanced scorecard of 13 key performance indicators. Counting themselves among the elite A+E firms is not new to Rodgers - impressively, they’ve won the COE award for the last three years in a row. With its low staff turnover rate, Rodgers has had enormous success retaining, and engaging, its hires, both new and experienced. We recently sat down with Dusty Rood, AICP, LEED-AP, President of Rodgers Consulting, to learn the secret to Rodgers’ success. 1) IN ADDITION TO BEING A MULTIPLE-YEAR PSMJ COE WINNER, YOU ALSO BOAST AN EXCEPTIONALLY LOW STAFF TURNOVER RATE. TO WHAT DO YOU ATTRIBUTE THIS SUCCESS? We are very clear in who we are and who we are not. We are very clear in our mission as a Firm that we focus on adding value to private sector, land development and real estate clients in a politicized, highly regulated environment in the metropolitan area outside our nation’s capital. We distinguish ourselves from our mostly commodity-oriented competitors who operate in multiple sectors for different client types. We dedicate time every year on operational and strategic planning, and engage a significant amount of staff in that process. We talk about our mission every chance we get; from the hiring process, in our day-to-day operations, at our monthly president’s meetings over pizza, annually during strategic planning and at our end of year company meeting. This helps create clarity of our mission, alignment among staff and engagement of everyone. We are a meritocracy that treats our staff like the professionals they are, not as commodities, line items, or a means to an end. With all of these parameters clicking, the firm is highly productive, clients and projects are successful, collaboration is high and everyone’s having fun. 2) RECENTLY, YOU BEGAN A “PASSION PURSUITS” PROGRAM FOR YOUR STAFF. PLEASE TELL ME A LITTLE ABOUT IT. The Passion Pursuits program is predicated on the belief that all of our staff, considering that most are technically-oriented professionals, are motivated by a passion to understand and contribute to solving complex problems, whether it’s a design problem or a community or organizational issue. 11
- 12. P S M J / O C T O B E R / 2 0 1 5 I write this from my “downunder” perspective, but I suspect that what’s happening here is not so different from what’s happening in the rest of the archiverse. Here are 6 trends I see unfolding. 1. MASSIVE CONSOLIDATION, ESPECIALLY IN ENGINEERING. In Australia, there are few medium-sized engineering firms left – most have been gobbled up by the multinationals. In architecture, the number of large firms (200+) doubled in 2 years (2009-2011). In the same period, the number of mid-size firms (20-199) dropped from 352 to 308, a decline of 12.5%. The US is experiencing a similar decline in mid-size practices. Anecdotal evidence indicates that it is the mid-range generalist practices that are disappearing; but that practices with strong credentials in strong niche markets are relatively stable. Likely outcome: If you own a mid-size generalist practice, you are increasingly likely to be approached for a buy-out or merger. Action: If you are willing to sell or merge your practice, be well prepared to position your firm to get the best deal. Get a copy of PSMJ’s The Ultimate Ownership Transition Manual. 2. INCREASING FRAGMENTATION OF DESIGN SERVICES. This trend may seem to be the opposite of the next one, but it is significant. As the search for better delivery models continues to test new ideas, many developer-clients are taking a bigger slice of the project management role, and are carving up the design work into smaller chunks, which are bid in pieces much like buying bricks and mortar. For many design firms, contract administration is becoming a thing of the past, and increasingly, documentation is being sent offshore – by the clients, not by the designers. The consequences of this trend are less and less control over the end result, and greater risk, coming from an inability to manage design errors & omissions. In this model, the client/developer is responsible for coordination and integration, and often does not have the skills to do it well. If that’s the case, the amount of coordination time you’ll have to do will increase – and you won’t get paid for it. Action: Be very careful about contract language that could make you responsible for coordination you have no control over. Ensure that coordination planning is thorough and carried out by competent people. 3. CONTINUING ADOPTION OF IPD/PROJECT ALLIANCE DELIVERY MODELS. IPD (Integrated Project Delivery) is currently seen as the answer to many of the problems that have dogged design & construction projects for two generations. Project Alliances are an Australian version of the same idea. In these models, a project team is formed very early in the design process or before it starts, that includes the client and the contractor. Typically a “charter” is involved, where the parties agree not to sue each other in case of disputes. Typically, BIM (Building Information Modelling) is used as a delivery vehicle. BIM has several “levels” (3D, 4D and 5D), which refer to “dimensions” of the project data. Where these models come unstuck is where one of the partner identities starts to act outside the intended cooperative nature of the “integrated” or “allied” team, and seeks to wield excessive control. Despite these drawbacks, I see the continued growth of this model, together with efforts to improve the way it works. Action: Ensure the structure is fair and reasonable and provides safeguards against “takeover” by any one party. 4. CONTINUING GROWTH OF PROJECT WEBSITES. Worldwide, we are seeing project websites such as Aconex gain in influence. Although these centralized document management systems have project benefits, they also impose greater costs on design professionals, and increase the quantity of email communication, that are generally unrecoverable. One of the disadvantages is that project data cannot be accessed if you’re offline, and we know of at least one instance where one of the team members (who was paying for the service) got into a dispute with designers and required that the website shut off their access to email. The fact that control of communication passes to a third party is a potential hazard to this type of service. Action: Ensure that extra costs will be reimbursed, that you won’t have to pay extra to get a copy of records at the end of the project, and that you can never be denied access. 5. DISRUPTIVE PRICE-CUTTING IN CYCLICAL SLOWDOWNS. This may not seem like anything new, but increasingly, I’m seeing large/global firms undercutting the smaller, boutique firms, using their brand and size to take work that could better be done by the more specialized practices. The goal for the larger firms is to keep their teams together, even at a loss – and the result is a more chaotic, less predictable workflow for the smaller firms. Expect “poaching in your turf” by bigger firms during slowdowns. Action: Ensure that your client relationships are very strong and well- maintained; sufficient to resist price-cutting offers. 6. EXPANSION OF IN-HOUSE “UNIVERSITIES.” As the consolidation noted in point 1 grows, these larger firms tend to create “in-house universities” to handle all their training programs. There are benefits to this idea – mainly that it is much easier to coordinate training globally – but there are also downsides. The chief of those is the danger that the training programs become insular and start to stagnate, because “new thinking” and cross-fertilization from the outside doesn’t have a natural way to reinvigorate content. Action: Think this through carefully before embarking on the idea. Ensure that continual improvement of content, drawn from external sources, is part of the plan. l WHERE ARE THE DESIGN PROFESSIONS HEADED? Charles Nelson, AIA, LFRAIA, is the Director of PSMJ’s Australasia practice. He is also known for writing and speaking extensively on project and practice management. Charles can be reached at cnelson@psmj.com. 12
- 13. HURRY! Limited-time introductory rate - $297/year (a $100 savings). EXPIRES IN 30 DAYS! PSMJ’s flagship newsletter subscription brings you the most data-driven, action-oriented, and forward-thinking business performance advice for A/E/C firm leaders. Every article in every issue brings you specific insight that comes from PSMJ’s 40+ years of A/E/C industry experience in a cost-effective and easy-to-read format. No generic or unproven fluff here. Best of all, your subscription includes complete access to our searchable online archives as well as exclusive subscriber-only data, special reports, and more. And, the benefits don’t stop there. You also save $100 on every PSMJ seminar or conference registration and 10% on any PSMJ bookstore purchases. IN 12 MONTHLY ISSUES, YOU ACCESS POWERFUL INSIGHT FROM THE A/E/C BUSINESS PERFORMANCE EXPERTS… • 6 Critical Elements in Leadership Transition • The DOs and DON’Ts of Charging Principal Time • 3 Questions to Ask to Weed Out Dead-End Clients • How Great A/E Firms Set Themselves Apart • 9 Hard-Nosed Tactics to Tighten Up Project Delivery • Our ALL-NEW A/E/C Project Management Study ($147 value) • And many more! TAKE ADVANTAGE OF PSMJ ALL ACCESS PASS INTRODUCTORY PRICING – EXPIRES IN 30 DAYS! Your subscription includes PSMJ’s 100% Money Back Guarantee. If you aren’t absolutely 100% satisfied, just let us know and we’ll refund your entire subscription cost. Every penny. No questions asked. Be sure to use promo code PSMJPASS to take advantage of this special offer. Just do the math. Even if you just attend one PSMJ program (save $100) and download one special report (a $147 value), your subscription has already more than paid for itself…before you have read a single issue! PSMJ Subscription – All Access Pass 10 Midland Avenue • Newton, MA 02458 • 617.965.0055 • www.psmj.com YES! I would like to subscribe to PSMJ for one full year for just $297 ($100 savings). Visit http://bit.ly/1PO5PZM to view a complete issue of PSMJ…with our compliments! A D V I C E F O R A / E F I R M L E A D E R S : D ATA - D R I V E N | P R O V O C AT I V E | A C T I O N A B L E PSMJ CALL: (617) 965-0055 E-MAIL: customerservice@psmj.com VISIT: www.psmj.com8 ( *