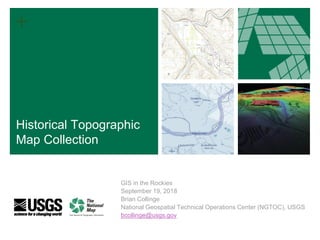
2018 GIS in Government: Historical Topographic Map Collection

The United States Geological Survey (USGS) created nearly 200,000 1:250,000-scale and larger printed topographic maps between the inception of the topographic mapping program in 1884 and 2006 when they began producing digital format maps. In 2011 the USGS began production of the Historical Topographic Map Collection (HTMC) by scanning these maps and creating a GeoPDF and GeoTIFF product for each unique paper map. In addition to producing high-resolution, geo-referenced digital copies of the legacy lithographic maps, the USGS is also accurately cataloging and creating metadata for each product. This presentation will talk about what the HTMC is, how and why it is being created, where you can access the available GeoPDFs and GeoTIFF’s, and the current program status.

Recommandé
Recommandé
Contenu connexe
Tendances
Tendances (20)
Similaire à 2018 GIS in Government: Historical Topographic Map Collection
Similaire à 2018 GIS in Government: Historical Topographic Map Collection (20)
Plus de GIS in the Rockies
Plus de GIS in the Rockies (20)
Dernier
Dernier (20)
2018 GIS in Government: Historical Topographic Map Collection
- 1. + GIS in the Rockies September 19, 2018 Brian Collinge National Geospatial Technical Operations Center (NGTOC), USGS bcollinge@usgs.gov Historical Topographic Map Collection
- 2. + 2 + 2 Presentation Overview ■ What is the Historical Topographic Map Collection (HTMC)? ■ How was the HTMC compiled? ■ Scanning process ■ Metadata collection ■ What issues were encountered? ■ How is the USGS Addressing it? ■ How do I find/acquire HTMC products?
- 3. + 3 + 3 Historical Topographic Map Collection ■ USGS published its topographic map series on paper from 1884 to 2006. ■ During this period an estimated 200,000 printed maps were created. ■ All of the new topographic map products being produced are in a digital format. ■ The new maps in all digital format are designed to replicate the look of the legacy maps, but with added functionality using layers that can conveniently be turned on and off at the user’s preference. What is the Historical Topographic Map Collection (HTMC)?
- 4. + 4 + 4 Historic Topographic Map Collection ■ As the USGS transitioned from printed paper maps to exclusively digital cartographic products, the disposition of over a century's worth of paper maps became problematic. ■ The solution adopted to preserve and distribute these paper maps was to scan them and convert them into a georeferenced digital product (GeoPDF). ■ Between 2009 and 2012 nearly 180,000 USGS-produced paper maps were converted into HTMC GeoPDF products. ■ After initial production, a second format was also created - a GeoTIFF file at reduced resolution. ■ More info at HTMC Web site (https://nationalmap.gov/historical/). What is the HTMC?
- 5. + 5 + 5 Historic Topographic Map Collection ■ The HTMC project involved archiving digital copies of the original paper topographic maps and creating metadata to accompany the high-resolution, digital maps. ■ The primary HTMC products are digital files representing the original paper historical topographic map distributed in GeoPDF and GeoTIFF formats. ■ The GeoPDF product is georeferenced and GeoMark enabled and is designed for users who may not have GIS software. ■ The GeoTIFF product is georeferenced and is designed for users with GIS software. How was the HTMC compiled?
- 6. + 6 + 6 Flow chart from the “Specifications for the U.S. Geological Survey Historical Topographic Map Collection", 2014 Historical Topographic Map Collection
- 7. + 7 + 7Historical Topographic Map Collection map edition 1890 Scale 1:125000
- 8. + 8 + 8Historical Topographic Map Collection Map edition 1942 Scale 1:24000 Map edition 1965 Revised 1994 Scale 1:24000
- 9. + 9 + 9 Historic Topographic Map Collection ■ After initial production, defects in some of the products were uncovered. The most prevalent was a discoloration in the scanned image that wasn't in the original paper map. A second, less common defect was the visibility of text which was on the back side of the scanned paper map. ■ The small window of time and number of people working on the project may have contributed to these errors ■ Nearly 180,000 maps were scanned and made into GeoPDFs with metadata over a three year period. ■ Scanning occurred at nine different locations and was done mostly by student contractors. What issues were encountered?
- 10. + 10 + 10Gray Tint Examples
- 11. + 11 + 11See Through Text Examples
- 12. + 12 + 12 HTMC Corrections The USGS has developed an automated image correction utility using Photoshop scripting and an application of a series of rules that identify those images which need to be corrected.
- 13. + 13 + 13 Flow Chart by Wes Gillman HTMC Gray Tint Correction Workflow
- 14. + 14 + 14 HTMC Corrections ■ The gray tint correction utility creates a quality control JPEG image for every product run through it and a new TIFF product for every image is identified as defective. ■ Each JPEG is then briefly looked at by the person running the process to ensure the utility did not miss anything or cause other errors. ■ See through text is also caught in this quality control step and is sent back through the process for further correction. ■ Once the images are processed and they pass quality control there are several semi-automated steps that create and restore the associated files and prepare them for storage and to be uploaded to the distribution system. ■ The final product of this process is a new HTMC product that replaces the defective one.
- 15. + 15 + 15 HTMC Corrections ■ The gray tint and see through text issues were not discovered until after the bulk of the HTMC products were created. ■ Tint and average pixel brightness value requirements for the map image are included in the HTMC Specification. These requirements apply retroactively to all maps in the HTMC and to any additional scans of historical paper maps added to the HTMC in the future. ■ Standard for the U.S. Geological Survey Historical Topographic Map Collection (https://pubs.usgs.gov/tm/11b03/) ■ Specification for the U.S. Geological Survey Historical Topographic Map Collection (https://pubs.er.usgs.gov/publicati on/tm11B6)
- 16. + 16 + 16 Accessing HTMC Products ■ HTMC products are available to download in both GeoTIFF and GeoPDF formats at no cost ■ They can be accessed at any of these locations ■ GeoPDF ■ The National Map: Download Manager (https://viewer.nationalmap.gov/apps/download_manager) ■ USGS Map Store: Map Locator & Downloader (https://store.usgs.gov/b2c_usgs/usgs/maplocator/(ctype=c atalogEntry&xcm=r3standardpitrex_prd&carea=%24ROOT &layout=6_1_61_48_1&uiarea=2)/.do ) ■ GeoTIFF ■ TopoView Web site (https://ngmdb.usgs.gov/maps/Topoview/)
- 18. + 18 + 18 Additional reference slides
- 19. + 19 + 19 RGB composite histogram levelsCorrection Levels - Intensity Decreased very high B ≥ 100+ any 0 0.0 0 high 93 < B < 100+ high Y ≥ 36 0 0.9 230 mid 30 ≥ Y < 36 0 0.9 230 low Y < 30 0 0.8 245+ mid 85 < B ≤ 93 high Y ≥ 36 0 0.9 195- mid 30 ≥ Y < 36 0 0.9 220+ low Y < 30 0 0.8 220+ low 84 ≤ B ≤ 85 high Y ≥ 37 0 0.9 195- mid 30 ≥ Y < 37 0 0.9 200 low Y < 30 0 0.8 200+ very low B < 84 high Y ≥ 44 0 0.9 195- mid 30 ≥ Y < 44 0 0.9 210 low Y < 30 0 0.8 200 Brightness Value (B) Yellow Value (Y) BLK GAM WHT Measurement of observed averages for pixel data across predicted canvas area LOW MID HIGH
- 20. + 20 + 20 RGB composite histogram levelsCorrection Levels - Intensity Increased very high B ≥ 100+ any 0 0.0 0 high 93 < B < 100+ high Y ≥ 36 0 0.9 230 mid 30 ≥ Y < 36 0 0.9 230 low Y < 30 0 0.8 200- mid 85 < B ≤ 93 high Y ≥ 36 0 0.9 195- mid 30 ≥ Y < 36 0 0.9 200 low Y < 30 0 0.8 200 low 84 ≤ B ≤ 85 high Y ≥ 37 0 0.9 195- mid 30 ≥ Y < 37 0 0.9 200 low Y < 30 0 0.8 190 very low B < 84 high Y ≥ 44 0 0.9 195- mid 30 ≥ Y < 44 0 0.9 190 low Y < 30 0 0.8 180 Brightness Value (B) Yellow Value (Y) BLK GAM WHT Measurement of observed averages for pixel data across predicted canvas area LOW MID HIGH