
Recommandé
Contenu connexe
En vedette
En vedette (17)
Similaire à Pubmed dataset visualisation pecha kucha
Similaire à Pubmed dataset visualisation pecha kucha (20)
Dernier
Dernier (20)
Pubmed dataset visualisation pecha kucha
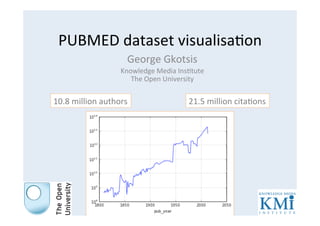
- 1. PUBMED dataset visualisa1on George Gkotsis Knowledge Media Ins1tute The Open University 21.5 million cita1ons 10.8 million authors
- 2. Visualisa1on • XKCD-style • Infographic-‐style Ver1cal scrolling
- 3. Data analysis 1. Co-‐authorship network 2. Academic reten1on and produc1vity 3. Terminology & evolu1on
- 4. 1. Co-‐authorship network • For each year, a co-‐authorship graph is constructed • Visualise graph proper1es: – Nodes – Edges – Clustering coefficient – Entropy: Rowe & Strohmaier, WWW2014
- 5. 1. Co-‐authorship network (cont.)
- 6. 2. Academic throughput and reten1on • Researcher profile – 4 aYributes: [1] Year of first publica1on [2] Year of last publica1on [3] Number of publica1ons [4] Dura1on of research ac1vity ([2]-‐[1]) 1966 -‐ 2001
- 7. 2. Academic throughput and reten1on (cont.)
- 8. 3. Terminology & evolu1on w: 1-‐gram word-‐term M: 5-‐year ;tles’ corpus
- 9. 3. Terminology & evolu1on (cont.)
- 10. Development • Pandas Data analysis and manipula1on • NetworkX Network analysis • NLTK Natural Language processing • Matplotlib Plobng