1. Putting time on your side
July 2015
Investment Essentials
Investing in the stock market can be very rewarding. However, as share prices fluctuate, it is also possible that
you can lose money. This can particularly be the case when you react to short-term stock market falls. This is why
Financial Advisers typically recommend that investors should take a five to ten-year view. They know that the
longer you hold your shares, the more chance there is that you will make money.
This conclusion is supported by history. We have looked back over
the last 10 years to see how you would have fared by investing in
the UK and international stock markets. We analysed how many
times you would have made and lost money over one, five
and ten years.
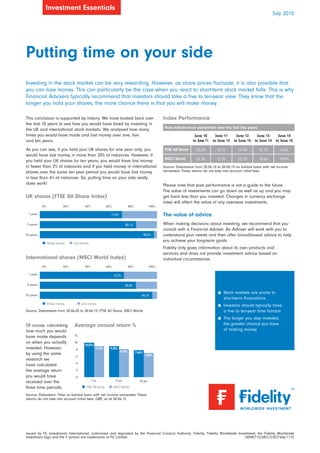
As you can see, if you held your UK shares for one year only, you
would have lost money in more than 20% of instances. However, if
you held your UK shares for ten years, you would have lost money
in fewer than 2% of instances and if you held money in international
shares over the same ten year period you would have lost money
in less than 4% of instances. So, putting time on your side really
does work! Please note that past performance is not a guide to the future.
The value of investments can go down as well as up and you may
get back less than you invested. Changes in currency exchange
rates will affect the value of any overseas investments.
The value of advice
When making decisions about investing, we recommend that you
consult with a Financial Adviser. An Adviser will work with you to
understand your needs and then offer broad-based advice to help
you achieve your long-term goals.
Fidelity only gives information about its own products and
services and does not provide investment advice based on
individual circumstances.
Source: Datastream from 30.06.10 to 30.06.15 on bid-bid basis with net income
reinvested. These returns do not take into account initial fees.
Index Performance
How indices have performed over the last five years
June 10
to June11
June 11
to June 12
June 12
to June 13
June 13
to June 14
June 14
to June 15
FTSE All Share 25.6% -3.1% 17.9% 13.1% 2.6%
MSCI World 22.3% -2.2% 23.3% 10.6% 10.9%
Issued by FIL Investments International, authorised and regulated by the Financial Conduct Authority. Fidelity, Fidelity Worldwide Investment, the Fidelity Worldwide
Investment logo and the F symbol are trademarks of FIL Limited. UKM0715/6851/CSO7466/1115
n Stock markets are prone to
short-term fluctuations
n Investors should typically have
a five to ten-year time horizon
n The longer you stay invested,
the greater chance you have
of making money
Of course, calculating
how much you would
have made depends
on when you actually
invested. However,
by using the same
research we
have calculated
the average return
you would have
received over the
three time periods.
Source: Datasteam. Total on bid-bid basis with net income reinvested. These
returns do not take into account initial fees, GBP, as at 30.06.15
Made money Lost money
1 year
5 years
10 years
0% 20% 40% 60% 80% 100%
77.9%
85.1%
UK shares (FTSE All Share Index)
98.3%
Average annual return %
FTSE All share MSCI World
12
10
8
6
4
2
0
1 yr 5 yrs
9.25%
8.50%
9.78%
10 yrs
10.07%
7.60%
6.88%
0% 20% 40% 60% 80% 100%
Made money Lost money
1 year
5 years
10 years
International shares (MSCI World Index)
83.8%
96.1%
76.5%
Source: Datastream from 30.06.05 to 30.06.15, FTSE All Share, MSCI World.