2016 04-18--pusle article
•
0 j'aime•195 vues

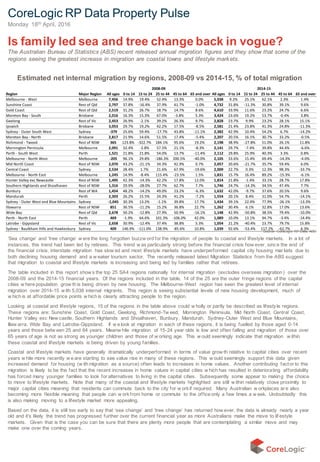
‘Sea change’ and ‘tree change’ were the long forgotten buzzword for the migration of people to coastal and lifestyle markets. In a lot of instances, this trend had been led by retirees. This trend was particularly strong before the financial crisis however, since the end of the financial crisis, interstate migration has slowed and most lifestyle markets have underperformed capital city housing markets due to both declining housing demand and a weaker tourism sector. The recently released latest Migration Statistics from the ABS suggest that migration to coastal and lifestyle markets is increasing and being led by families rather that retirees.
Recommandé

Recommandé
Contenu connexe
En vedette
En vedette (14)
Similaire à 2016 04-18--pusle article
Similaire à 2016 04-18--pusle article (20)
Plus de LJ Gilland Real Estate Pty Ltd
Plus de LJ Gilland Real Estate Pty Ltd (20)
Dernier
Dernier (20)
2016 04-18--pusle article
- 1. Region Major Region All ages 0 to 14 15 to 24 25 to 44 45 to 64 65 and over All ages 0 to 14 15 to 24 25 to 44 45 to 64 65 and over Melbourne - West Melbourne 7,456 14.9% 19.4% 52.4% 13.3% 0.0% 5,038 9.2% 25.1% 62.1% 2.3% 1.4% Sunshine Coast Rest of Qld 2,797 37.8% -16.4% 37.9% 41.7% -1.0% 4,732 31.8% -11.3% 30.8% 39.1% 9.6% Gold Coast Rest of Qld 2,519 31.2% 26.7% 18.7% 14.7% 8.6% 4,610 33.9% 11.6% 23.2% 24.7% 6.6% Moreton Bay - South Brisbane 2,016 16.3% 15.3% 67.0% -3.8% 5.3% 3,424 23.6% 19.2% 53.7% -0.4% 3.8% Geelong Rest of Vic 2,453 26.9% -2.1% 39.2% 26.3% 9.7% 2,828 23.7% 9.9% 23.2% 28.1% 15.1% Ipswich Brisbane 3,053 29.7% 19.2% 42.2% 17.5% -8.5% 2,581 21.4% 23.8% 41.3% 24.8% -11.3% Sydney - Outer South West Sydney -379 25.6% 59.4% -17.7% 43.8% -11.1% 2,382 42.9% 10.4% 54.2% 6.7% -14.2% Moreton Bay - North Brisbane 2,817 21.9% 14.6% 51.5% 17.4% -5.4% 2,207 20.5% 16.1% 30.7% 33.2% -0.5% Richmond - Tweed Rest of NSW 365 123.8% -322.7% 184.1% 95.6% 19.2% 2,198 38.9% -27.8% 51.0% 26.1% 11.8% Mornington Peninsula Melbourne 2,091 32.4% -2.8% 57.5% 21.1% -8.3% 2,141 29.7% -7.4% 39.8% 44.4% -6.6% Perth - South West Perth 1,521 21.8% 21.8% 54.0% 13.7% -11.4% 2,112 29.8% 25.9% 40.3% 3.3% 0.8% Melbourne - North West Melbourne -205 96.1% 29.8% -186.3% 200.5% -40.0% 2,105 33.6% 15.4% 69.4% -14.3% -4.0% Mid North Coast Rest of NSW 2,070 43.2% -21.1% 34.3% 42.9% 0.7% 2,057 20.6% -21.7% 35.7% 59.4% 6.0% Central Coast Sydney 2,534 28.4% 1.7% 21.6% 67.9% -19.6% 2,009 22.7% 0.3% 12.3% 98.3% -33.7% Melbourne - North East Melbourne 1,245 14.9% -8.4% 115.4% -23.5% 1.5% 1,831 15.7% 16.4% 89.2% -15.3% -6.1% Hunter Valley exc Newcastle Rest of NSW 1,495 42.3% -14.3% 42.2% 17.8% 12.0% 1,814 21.8% -1.4% 33.1% 28.7% 17.8% Southern Highlands and Shoalhaven Rest of NSW 1,316 29.9% -28.0% 27.7% 62.7% 7.7% 1,746 24.7% -14.3% 34.5% 47.4% 7.7% Bunbury Rest of WA 1,454 48.2% -14.2% 49.0% 23.2% -6.3% 1,632 42.0% -9.7% 37.6% 20.5% 9.6% Mandurah Perth 2,303 26.2% 15.5% 24.3% 41.2% -7.2% 1,554 20.1% 8.4% 31.0% 54.7% -14.1% Sydney - Outer West and Blue Mountains Sydney -1,045 30.3% 13.2% -1.1% 39.8% 17.7% 1,434 39.1% 22.4% 77.9% -26.1% -13.3% Illawarra Rest of NSW 851 36.5% -11.2% 15.2% 36.8% 22.7% 1,262 30.4% 6.1% 32.8% 17.0% 13.6% Wide Bay Rest of Qld 2,678 50.2% -12.8% 27.9% 50.9% -16.1% 1,148 42.9% -50.8% 38.5% 79.4% -10.0% Perth - North East Perth 469 -1.9% 64.6% 101.3% -106.0% 42.0% 1,089 10.0% 13.1% 94.7% -3.4% -14.4% Latrobe - Gippsland Rest of Vic 2,658 30.9% -12.4% 37.4% 38.8% 5.3% 1,054 21.2% -40.4% 23.7% 79.7% 15.8% Sydney - Baulkham Hills and Hawkesbury Sydney 409 146.9% -111.0% 138.9% -85.6% 10.8% 1,039 92.6% -53.4% 117.2% -62.7% 6.3% 2008-09 2014-15 CoreLogic RP Data Property Pulse Monday 18th April, 2016 Is family led sea and tree change back in vogue? The Australian Bureau of Statistics (ABS) recent released annual migration figures and they show that some of the regions seeing the greatest increase in migration are coastal towns and lifestyle markets. Estimated net internal migration by regions, 2008-09 vs 2014-15, % of total migration ‘Sea change’ and ‘tree change’ w ere the long forgotten buzzw ord for the migration of people to coastal and lifestyle markets. In a lot of instances, this trend had been led by retirees. This trend w as particularly strong before the financial crisis how ever, since the end of the financial crisis, interstate migration has slow ed and most lifestyle markets have underperformed capital city housing mar kets due to both declining housing demand and a w eaker tourism sector. The recently released latest Migration Statistics from the ABS suggest that migration to coastal and lifestyle markets is increasing and being led by families rather that retirees. The table included in this report show s the top 25 SA4 regions nationally for internal migration (excludes overseas migration) over the 2008-09 and the 2014-15 financial years. Of the regions included in the table, 14 of the 25 are the outer fringe regions of the capital cities w here population grow th is being driven by new housing. The Melbourne-West region has seen the greatest level of internal migration over 2014-15 w ith 5,038 internal migrants. This region is seeing substantial levels of new housing development, much of w hich is at affordable price points w hich is clearly attracting people to the region. Looking at coastal and lifestyle regions, 15 of the regions in the table above could w holly or partly be described as lifestyle regions. These regions are: Sunshine Coast, Gold Coast, Geelong, Richmond-Tw eed, Mornington Peninsula, Mid North Coast, Central Coast, Hunter Valley exc New castle, Southern Highlands and Shoalhaven, Bunbury, Mandurah, Sydney-Outer West and Blue Mountains, Illaw arra, Wide Bay and Latrobe-Gippsland. If w e look at migration in each of these regions, it is being fuelled by those aged 0-14 years and those betw een 25 and 64 years. Meanw hile migration of 15-24 year olds is low and often falling and migration of those over 65 years of age is not as strong as younger children and those of w orking age. This w ould seemingly indicate that migration w ithin these coastal and lifestyle markets is being driven by young families. Coastal and lifestyle markets have generally dramatically underperformed in terms of value grow th relative to capital cities over recent years w hile more recently w e are starting to see value rise in many of these regions. This w ould seemingly support this data given increased demand for housing (w ith migration as a source) often leads to increases in home values. Another contributing factor to this migration is likely to be the fact that the recent increases in home values in capital cities w hich has resulted in deteriorating affordability has forced many younger families to look for alternatives to living in the capital cities. Subsequently some appear to making the choice to move to lifestyle markets. Note that many of the coastal and lifestyle markets highlighted are still w ithin relatively close proximity to major capital cities meaning that residents can commute back to the city for w orkif required. Many Australian w orkplaces ar e also becoming more flexible meaning that people can w orkfrom home or commute to the office only a few times a w eek. Undoubtedly this is also making moving to a lifestyle market more appealing. Based on the data, it is still too early to say that ‘sea change’ and ‘tree change’ has returned how ever, the data is already nearly a year old and it’s likely the trend has progressed further over the current financial year as more Australians make the move to lif estyle markets. Given that is the case you can be sure that there are plenty more people that are contemplating a similar move and may make one over the coming years. Source: CoreLogic RP Data, ABS