SlideShare une entreprise Scribd logo
1  sur  26
1
TQM System Model
Customer Focus
Planning
Process
Total
Involvement
Process
Improvement
Process
Management
Continuous
Improvement
2
Affinity Diagram
 An affinity diagram is a tool to
organize brainstorming ideas and
large amount of data in a group Affinit
y
Affinit
y
Customer
Complaints
Customer
Returns (%)
3
Breaking Set (Adding new ideas)
A technique used to generate additional ideas related to those already defined
1 Adapt?
How can this idea used as is?
What are other uses or other ideas like this?
2 Modify?
Change of meaning, material, smell, color, form,
shape, etc.?
3 Magnify
Add any ingredients?
Duplicate, multiply or exaggerate?
4 Minimize?
Split up?
Take something out?
5 Substitute?
Who else, where else or what else?
Other material, process, place or approach?
6 Rearrange?
Interchange parts?
Other layouts, sequence or patterns?
7 Reverse?
Transpose positive and negative?
Turn opposite or backward?
8 Combine?
Combine parts and ideas?
How about blend?
4
Paired Comparisons
Paired comparison is a method to prioritize a number of alternatives and to achieve group consensus at the end of a brainstorming
meeting
Option Avs.B
Avs.C
Avs.D
Avs.E
Bvs.C
Bvs.D
Bvs.E
Cvs.D
Cvs.E
Dvs.E
Total
Option A
Option B
Option C
Option D
Option E
5
Swimming Lanes
PlaceholderPlaceholderPlaceholderPlaceholder
Text
Text
Text
• Bulleted Text placeholder
6
Fishbone Diagram (Cause and Effect/Ishikawa)
Ishikawas illustrate multiple levels of potential causes (inputs) and ultimate effects (outputs), of problems or issues that may arise
in the course of business
Description 1
Description 1
Placeholder
Placeholder
Placeholder
Placeholder
Description 1
Description 1
Placeholder
Placeholder
Placeholder
Placeholder
Description 1
Description 1
Placeholder
Placeholder
Placeholder
Placeholder
Cause Effect
Problem /
Quality Characteristic
Effect that needs
improvement
7
Priorities Matrix
The Prioritization Matrix helps to rank problems or issues by a particular criterion that is important to the organization
Frequency Importance Feasibility Total Points
Description 1
How frequently does the
problem occur?
Sum up all the votes
Description 2
What are the problems
that you want to resolve
first?
Description 3
Is it realistic that we can
resolve this problem?
…
…
…
Rank/Vote:
Each participant now votes three times for
each criteria and nine times in total
8
GanttSep Oct No
v
De
c
Jan Feb Mar Apr Ma
y
Jun Jul Aug Sep
Description 1
Description 2
Description 3
Description 4
…
…
Communicatio
n
… Pilot Rollout – Ends in July
Approval
s
Multiplier Plan
Implementation
…
…
…
Milestones
PRTM
Complete
Assessment
Recommend Appr.
Governance Structure
…
…
…
Median
Correctio
n
9
Gantt
Q4
FY11
Q1 FY12 Q2 FY12 Q3 FY12 Q4 FY12
Sep Oct Nov Dec Jan Feb Mar Apr May Jun Jul Aug Sep
Description 1
Description 2
Description 3
Description 4
…
…
Communicatio
n
… Pilot Rollout – Ends in July
Approval
s
Multiplier Plan
Implementation
…
…
…
Milestones
PRTM
Complete
Assessment
Recommend Appr.
Governance Structure
…
…
…
Median
Correctio
n
10
Root cause Analysis (RCA)
Root cause analysis is a class of problem solving methods aimed at identifying the root causes of problems or events
No. Possible Cause Weight
1 Cause 1 50%
2 Cause 2 35%
3 Cause 3 25%
No. What? How? Who? When? Status
1 … … … …
2
3
Text
Cause 1
50%
Cause 2
35%
Cause 3
25%
Cause xx
xx%
11
Opportunity Analysis
This offers the opportunity to evaluate a list of options against goals and resources and to decide what to do first
Goal/Attribute
Importance Ability to complete
Low Medium High Low Medium High
Goal 1
Goal 2
Goal 3
Goal 4
Goal 5
12
Failure Mode Effect Analysis (FMEA)
Process Name Process Number
Date:
Revision:
Failure Mode
A) Severity
Rate 1-10
10 – Most Severe
B) Probability of
Occurrence
Rate 1-10
10 – Highest Probability
C) Probability of
Detection
Rate 1-10
10 – Lowest Probability
Risk Preference
Number (RPN)
A x B x C
1) Xxxxx 5 4 3 60
2) Yyyyyy
3) …..
13
Project Management – Phase Model
General Overview of all activities during project execution
Project
Definition
Project
Planning
Project
Management
Project
Conclusion
• Click here to add text • Click here to add text • Click here to add text • Click here to add text
14
Roadmapping
Placeholder
Q1 FY11
Placeholder
• Bullet Point
Picture Placeholder
Q1 FY11 Q1 FY11 Q1 FY11
Placeholder
Placeholder
Placeholder
Placeholder
• Bullet Point
Picture Placeholder
Placeholder
• Bullet Point
Picture Placeholder
Placeholder
• Bullet Point
Picture Placeholder
15
Roadmapping
Q1 FY11 Q2 FY11 Q3 FY11 Q4 FY11
Placeholder
This is a
placeholder text
Placeholder
This is a
placeholder text
Placeholder
This is a
placeholder text
Placeholder
This is a
placeholder text
Placeholder
This is a
placeholder text
Placeholder
This is a
placeholder text
Placeholder
This is a
placeholder text
Placeholder
This is a
placeholder text
Placeholder
16
Stakeholder Analysis
Company/
Project
Owner
Management
EmployeeSupplier
Shareholder
Supporter
Neutral
Critic
17
Waterfall Model
This is an example text. Go ahead and replace it with your own text
Thisisanexampletext
This is an example text.
18
Cycle Diagrams
Example
Text
1
2
34
5
6
1
Example text
Go ahead and
replace it with
your own text
2
Example text
Go ahead and
replace it with your
own text
3
Example text
Go ahead and
replace it with
your own text
4
Example text
Go ahead and
replace it with
your own text
5
Example text
Go ahead and
replace it with
your own text
6
Example text
Go ahead and
replace it with
your own text
19
Technical
Capability
Organization Roadmap
Organization
Capability
Service
Delivery
Process &
Quality
‘PlaceholderText
• Placeholder
•Placeholder
•Placeholder
• Placeholder
• Placeholder
Placeholder
• Placeholder
• Placeholder
 Placeholder
 Placeholder
 Placeholder
 Placeholder
Current State Planned State
• Placeholder
• Placeholder
• Placeholder
• Placeholder
Actions PlannedData Points
20
20
•This is an example text. Go ahead and
replace it with your own text. This is an
example text. Go ahead and replace it
with your own text.
•This is an example text. Go ahead and
replace it with your own text.
•This is an example text. Go ahead and replace it with
your own text. This is an example text. Go ahead and
replace it with your own text.
•This is an example text. Go ahead and replace it with
your own text. This is an example text. Go ahead and
replace it with your own text.
•This is an example text. Go ahead and replace it with
your own text.
•This is an example text. Go ahead and replace it with
your own text. This is an example text. Go ahead and
replace it with your own text.
Placeholder
•This is an example text. Go ahead and replace it with your own text. This is an example text. Go ahead and replace it with your
own text.
•This is an example text. Go ahead and replace it with your own text.
Placeholder
•This is an example text. Go ahead and replace it with your own text. This is an example text. Go ahead and replace it with your
own text.
•This is an example text. Go ahead and replace it with your own text.
21
21
•This is an example text. Go ahead and replace it
with your own text. This is an example text. Go
ahead and replace it with your own text.
•This is an example text. Go ahead and replace it
with your own text.
•This is an example text. Go ahead and replace it with your
own text. This is an example text. Go ahead and replace it
with your own text.
•This is an example text. Go ahead and replace it with your
own text. This is an example text. Go ahead and replace it
with your own text.
•This is an example text. Go ahead and replace it with your
own text.
•This is an example text. Go ahead and replace it with your
own text. This is an example text. Go ahead and replace it
with your own text.
Title
•This is an example text. Go ahead and replace it with your own text. This is an example text. Go ahead and replace it with your own text.
•This is an example text. Go ahead and replace it with your own text.
Title
•This is an example text. Go ahead and replace it with your own text. This is an example text. Go ahead and replace it with your own text.
•This is an example text. Go ahead and replace it with your own text.
22
22
•This is an example text. Go ahead and replace it with
your own text. This is an example text. Go ahead and
replace it with your own text.
•This is an example text. Go ahead and replace it with
your own text.
•This is an example text. Go ahead and replace it with your
own text. This is an example text. Go ahead and replace it
with your own text.
•This is an example text. Go ahead and replace it with your
own text. This is an example text. Go ahead and replace it
with your own text.
•This is an example text. Go ahead and replace it with your
own text.
•This is an example text. Go ahead and replace it with your
own text. This is an example text. Go ahead and replace it
with your own text.
Title
•This is an example text. Go ahead and replace it with your own text. This is an example text. Go ahead and replace it with your own text.
•This is an example text. Go ahead and replace it with your own text.
Title
•This is an example text. Go ahead and replace it with your own text. This is an example text. Go ahead and replace it with your own text.
•This is an example text. Go ahead and replace it with your own text.
Document the Services
Offshore Landscape –
Work Complexity,
Topography and Measures
Center
Framework
Assessment – Key
components of
managing a center
Assessment and
Identification of
Issues
Execute Initiatives
•Obtain resources and
executive support
•Select Core Team
leaders, core team;
develop workplans
and milestones;
execute
Problem Statement and Objective
 Improve Offshore Productivity
 zzzzza
 xxx
 Improve Productivity measures by x%
 Staff Turnover leading to Productivity and Tenure loss
 Increased market activity in LCG locations
 High Career Aspirations – Larger mix of young talent base
Opportunity to Secure Talent, Increase Tenure and Enhance Center Maturity
Problem Statement
Objective
Preliminary Assessment of Benefit vs. Time to
Implement
High
Low
Med
.
12+
months
0 -6
months
6 – 12 months
Time to Implement
LevelofBenefit
2
3
6
7
4 5
1
Note - Assessment is largely direction based on preliminary SWOT analysis conclusions
1. Trainee Program
2. Retention Model
3. Career Growth Framework
4. Methods & Procedures
5. Governance & Leadership
6. Employment Value Proposition
7. Specialize Centers
Details provided in
the following
section
xxxxxx
xxxxxx
Background Consideration Recommendation
• xxxx • xxxxx • xxxxx
Framework
text text
Title
Title
Title
Title
PlanandImplement
Point
Point
Title
Title Title
3c
3c
3b
3a
- text
- text
- text
- text
1 2

Contenu connexe

Similaire à Presentation Toolkit for Business Work

Marketing Powerpoint
Marketing PowerpointMarketing Powerpoint
Marketing PowerpointLucasHorvath
 
International swot analysis
International swot analysisInternational swot analysis
International swot analysisDigital SCRM
 
Social media marketing connecting the world iii
Social media marketing connecting the world iiiSocial media marketing connecting the world iii
Social media marketing connecting the world iiiUsha Ramkumar
 
PPT TEMPLATE MZ SAMPLE 2.pptx
PPT TEMPLATE MZ SAMPLE 2.pptxPPT TEMPLATE MZ SAMPLE 2.pptx
PPT TEMPLATE MZ SAMPLE 2.pptxJ Krishna Teja
 
Human Resources Management Diagrams
Human Resources Management DiagramsHuman Resources Management Diagrams
Human Resources Management DiagramsPoweredTemplate.com
 
Process Teamwork (for PowerPoint and Google Slides)
Process Teamwork (for PowerPoint and Google Slides)Process Teamwork (for PowerPoint and Google Slides)
Process Teamwork (for PowerPoint and Google Slides)PoweredTemplate.com
 
template presentasi kapal.pptx
template presentasi kapal.pptxtemplate presentasi kapal.pptx
template presentasi kapal.pptxinayatkusuma
 
Recruitment Process Diagrams (for PowerPoint and Google Slides)
Recruitment Process Diagrams (for PowerPoint and Google Slides)Recruitment Process Diagrams (for PowerPoint and Google Slides)
Recruitment Process Diagrams (for PowerPoint and Google Slides)PoweredTemplate.com
 
Salinan Business Plan.potx
Salinan Business Plan.potxSalinan Business Plan.potx
Salinan Business Plan.potxAlesyaRamadhani
 
Business Process Re-engineering Diagram (for PowerPoint and Google Slides)
Business Process Re-engineering Diagram (for PowerPoint and Google Slides)Business Process Re-engineering Diagram (for PowerPoint and Google Slides)
Business Process Re-engineering Diagram (for PowerPoint and Google Slides)PoweredTemplate.com
 
Innovation Process Diagrams (for PowerPoint and Google Slides)
Innovation Process Diagrams (for PowerPoint and Google Slides)Innovation Process Diagrams (for PowerPoint and Google Slides)
Innovation Process Diagrams (for PowerPoint and Google Slides)PoweredTemplate.com
 
4 transportation modes
4 transportation modes4 transportation modes
4 transportation modesSlideShop.com
 

Similaire à Presentation Toolkit for Business Work (20)

Template Project
Template ProjectTemplate Project
Template Project
 
1000 Consulting Diagrams, Templates, Graphics & Icons
1000 Consulting Diagrams, Templates, Graphics & Icons1000 Consulting Diagrams, Templates, Graphics & Icons
1000 Consulting Diagrams, Templates, Graphics & Icons
 
Marketing Powerpoint
Marketing PowerpointMarketing Powerpoint
Marketing Powerpoint
 
International swot analysis
International swot analysisInternational swot analysis
International swot analysis
 
Social media marketing connecting the world iii
Social media marketing connecting the world iiiSocial media marketing connecting the world iii
Social media marketing connecting the world iii
 
PPT TEMPLATE MZ SAMPLE 2.pptx
PPT TEMPLATE MZ SAMPLE 2.pptxPPT TEMPLATE MZ SAMPLE 2.pptx
PPT TEMPLATE MZ SAMPLE 2.pptx
 
Sample presentation
Sample presentationSample presentation
Sample presentation
 
Human Resources Management Diagrams
Human Resources Management DiagramsHuman Resources Management Diagrams
Human Resources Management Diagrams
 
Process Teamwork (for PowerPoint and Google Slides)
Process Teamwork (for PowerPoint and Google Slides)Process Teamwork (for PowerPoint and Google Slides)
Process Teamwork (for PowerPoint and Google Slides)
 
template presentasi kapal.pptx
template presentasi kapal.pptxtemplate presentasi kapal.pptx
template presentasi kapal.pptx
 
SWOT template
SWOT templateSWOT template
SWOT template
 
Recruitment Process Diagrams (for PowerPoint and Google Slides)
Recruitment Process Diagrams (for PowerPoint and Google Slides)Recruitment Process Diagrams (for PowerPoint and Google Slides)
Recruitment Process Diagrams (for PowerPoint and Google Slides)
 
Business Group Diagrams
Business Group DiagramsBusiness Group Diagrams
Business Group Diagrams
 
Salinan Business Plan.potx
Salinan Business Plan.potxSalinan Business Plan.potx
Salinan Business Plan.potx
 
Business Process Re-engineering Diagram (for PowerPoint and Google Slides)
Business Process Re-engineering Diagram (for PowerPoint and Google Slides)Business Process Re-engineering Diagram (for PowerPoint and Google Slides)
Business Process Re-engineering Diagram (for PowerPoint and Google Slides)
 
SeniorERP
SeniorERPSeniorERP
SeniorERP
 
Leaf charts
Leaf chartsLeaf charts
Leaf charts
 
Innovation Process Diagrams (for PowerPoint and Google Slides)
Innovation Process Diagrams (for PowerPoint and Google Slides)Innovation Process Diagrams (for PowerPoint and Google Slides)
Innovation Process Diagrams (for PowerPoint and Google Slides)
 
4 transportation modes
4 transportation modes4 transportation modes
4 transportation modes
 
Business Communication Diagrams
Business Communication DiagramsBusiness Communication Diagrams
Business Communication Diagrams
 

Dernier

Agile Coaching Change Management Framework.pptx
Agile Coaching Change Management Framework.pptxAgile Coaching Change Management Framework.pptx
Agile Coaching Change Management Framework.pptxalinstan901
 
VIP 7001035870 Find & Meet Hyderabad Call Girls Ameerpet high-profile Call Girl
VIP 7001035870 Find & Meet Hyderabad Call Girls Ameerpet high-profile Call GirlVIP 7001035870 Find & Meet Hyderabad Call Girls Ameerpet high-profile Call Girl
VIP 7001035870 Find & Meet Hyderabad Call Girls Ameerpet high-profile Call Girladitipandeya
 
Continuous Improvement Infographics for Learning
Continuous Improvement Infographics for LearningContinuous Improvement Infographics for Learning
Continuous Improvement Infographics for LearningCIToolkit
 
Call Now Pooja Mehta : 7738631006 Door Step Call Girls Rate 100% Satisfactio...
Call Now Pooja Mehta :  7738631006 Door Step Call Girls Rate 100% Satisfactio...Call Now Pooja Mehta :  7738631006 Door Step Call Girls Rate 100% Satisfactio...
Call Now Pooja Mehta : 7738631006 Door Step Call Girls Rate 100% Satisfactio...Pooja Nehwal
 
Day 0- Bootcamp Roadmap for PLC Bootcamp
Day 0- Bootcamp Roadmap for PLC BootcampDay 0- Bootcamp Roadmap for PLC Bootcamp
Day 0- Bootcamp Roadmap for PLC BootcampPLCLeadershipDevelop
 
Reviewing and summarization of university ranking system to.pptx
Reviewing and summarization of university ranking system  to.pptxReviewing and summarization of university ranking system  to.pptx
Reviewing and summarization of university ranking system to.pptxAss.Prof. Dr. Mogeeb Mosleh
 
situational leadership theory by Misba Fathima S
situational leadership theory by Misba Fathima Ssituational leadership theory by Misba Fathima S
situational leadership theory by Misba Fathima Smisbafathima9940
 
internal analysis on strategic management
internal analysis on strategic managementinternal analysis on strategic management
internal analysis on strategic managementharfimakarim
 
operational plan ppt.pptx nursing management
operational plan ppt.pptx nursing managementoperational plan ppt.pptx nursing management
operational plan ppt.pptx nursing managementTulsiDhidhi1
 
CALL ON ➥8923113531 🔝Call Girls Charbagh Lucknow best sexual service
CALL ON ➥8923113531 🔝Call Girls Charbagh Lucknow best sexual serviceCALL ON ➥8923113531 🔝Call Girls Charbagh Lucknow best sexual service
CALL ON ➥8923113531 🔝Call Girls Charbagh Lucknow best sexual serviceanilsa9823
 

Dernier (20)

Agile Coaching Change Management Framework.pptx
Agile Coaching Change Management Framework.pptxAgile Coaching Change Management Framework.pptx
Agile Coaching Change Management Framework.pptx
 
LoveLocalGov - Chris Twigg, Inner Circle
LoveLocalGov - Chris Twigg, Inner CircleLoveLocalGov - Chris Twigg, Inner Circle
LoveLocalGov - Chris Twigg, Inner Circle
 
VIP 7001035870 Find & Meet Hyderabad Call Girls Ameerpet high-profile Call Girl
VIP 7001035870 Find & Meet Hyderabad Call Girls Ameerpet high-profile Call GirlVIP 7001035870 Find & Meet Hyderabad Call Girls Ameerpet high-profile Call Girl
VIP 7001035870 Find & Meet Hyderabad Call Girls Ameerpet high-profile Call Girl
 
Peak Performance & Resilience - Dr Dorian Dugmore
Peak Performance & Resilience - Dr Dorian DugmorePeak Performance & Resilience - Dr Dorian Dugmore
Peak Performance & Resilience - Dr Dorian Dugmore
 
Becoming an Inclusive Leader - Bernadette Thompson
Becoming an Inclusive Leader - Bernadette ThompsonBecoming an Inclusive Leader - Bernadette Thompson
Becoming an Inclusive Leader - Bernadette Thompson
 
Continuous Improvement Infographics for Learning
Continuous Improvement Infographics for LearningContinuous Improvement Infographics for Learning
Continuous Improvement Infographics for Learning
 
Call Now Pooja Mehta : 7738631006 Door Step Call Girls Rate 100% Satisfactio...
Call Now Pooja Mehta :  7738631006 Door Step Call Girls Rate 100% Satisfactio...Call Now Pooja Mehta :  7738631006 Door Step Call Girls Rate 100% Satisfactio...
Call Now Pooja Mehta : 7738631006 Door Step Call Girls Rate 100% Satisfactio...
 
Imagine - Creating Healthy Workplaces - Anthony Montgomery.pdf
Imagine - Creating Healthy Workplaces - Anthony Montgomery.pdfImagine - Creating Healthy Workplaces - Anthony Montgomery.pdf
Imagine - Creating Healthy Workplaces - Anthony Montgomery.pdf
 
Day 0- Bootcamp Roadmap for PLC Bootcamp
Day 0- Bootcamp Roadmap for PLC BootcampDay 0- Bootcamp Roadmap for PLC Bootcamp
Day 0- Bootcamp Roadmap for PLC Bootcamp
 
Reviewing and summarization of university ranking system to.pptx
Reviewing and summarization of university ranking system  to.pptxReviewing and summarization of university ranking system  to.pptx
Reviewing and summarization of university ranking system to.pptx
 
situational leadership theory by Misba Fathima S
situational leadership theory by Misba Fathima Ssituational leadership theory by Misba Fathima S
situational leadership theory by Misba Fathima S
 
internal analysis on strategic management
internal analysis on strategic managementinternal analysis on strategic management
internal analysis on strategic management
 
Rohini Sector 16 Call Girls Delhi 9999965857 @Sabina Saikh No Advance
Rohini Sector 16 Call Girls Delhi 9999965857 @Sabina Saikh No AdvanceRohini Sector 16 Call Girls Delhi 9999965857 @Sabina Saikh No Advance
Rohini Sector 16 Call Girls Delhi 9999965857 @Sabina Saikh No Advance
 
Disrupt or be Disrupted - Kirk Vallis.pdf
Disrupt or be Disrupted - Kirk Vallis.pdfDisrupt or be Disrupted - Kirk Vallis.pdf
Disrupt or be Disrupted - Kirk Vallis.pdf
 
Leadership in Crisis - Helio Vogas, Risk & Leadership Keynote Speaker
Leadership in Crisis - Helio Vogas, Risk & Leadership Keynote SpeakerLeadership in Crisis - Helio Vogas, Risk & Leadership Keynote Speaker
Leadership in Crisis - Helio Vogas, Risk & Leadership Keynote Speaker
 
Call Girls Service Tilak Nagar @9999965857 Delhi 🫦 No Advance VVIP 🍎 SERVICE
Call Girls Service Tilak Nagar @9999965857 Delhi 🫦 No Advance  VVIP 🍎 SERVICECall Girls Service Tilak Nagar @9999965857 Delhi 🫦 No Advance  VVIP 🍎 SERVICE
Call Girls Service Tilak Nagar @9999965857 Delhi 🫦 No Advance VVIP 🍎 SERVICE
 
Intro_University_Ranking_Introduction.pptx
Intro_University_Ranking_Introduction.pptxIntro_University_Ranking_Introduction.pptx
Intro_University_Ranking_Introduction.pptx
 
operational plan ppt.pptx nursing management
operational plan ppt.pptx nursing managementoperational plan ppt.pptx nursing management
operational plan ppt.pptx nursing management
 
CALL ON ➥8923113531 🔝Call Girls Charbagh Lucknow best sexual service
CALL ON ➥8923113531 🔝Call Girls Charbagh Lucknow best sexual serviceCALL ON ➥8923113531 🔝Call Girls Charbagh Lucknow best sexual service
CALL ON ➥8923113531 🔝Call Girls Charbagh Lucknow best sexual service
 
Empowering Local Government Frontline Services - Mo Baines.pdf
Empowering Local Government Frontline Services - Mo Baines.pdfEmpowering Local Government Frontline Services - Mo Baines.pdf
Empowering Local Government Frontline Services - Mo Baines.pdf
 

Presentation Toolkit for Business Work

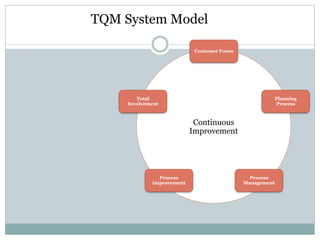
  • 1. 1 TQM System Model Customer Focus Planning Process Total Involvement Process Improvement Process Management Continuous Improvement
  • 2. 2 Affinity Diagram  An affinity diagram is a tool to organize brainstorming ideas and large amount of data in a group Affinit y Affinit y Customer Complaints Customer Returns (%)
  • 3. 3 Breaking Set (Adding new ideas) A technique used to generate additional ideas related to those already defined 1 Adapt? How can this idea used as is? What are other uses or other ideas like this? 2 Modify? Change of meaning, material, smell, color, form, shape, etc.? 3 Magnify Add any ingredients? Duplicate, multiply or exaggerate? 4 Minimize? Split up? Take something out? 5 Substitute? Who else, where else or what else? Other material, process, place or approach? 6 Rearrange? Interchange parts? Other layouts, sequence or patterns? 7 Reverse? Transpose positive and negative? Turn opposite or backward? 8 Combine? Combine parts and ideas? How about blend?
  • 4. 4 Paired Comparisons Paired comparison is a method to prioritize a number of alternatives and to achieve group consensus at the end of a brainstorming meeting Option Avs.B Avs.C Avs.D Avs.E Bvs.C Bvs.D Bvs.E Cvs.D Cvs.E Dvs.E Total Option A Option B Option C Option D Option E
  • 6. 6 Fishbone Diagram (Cause and Effect/Ishikawa) Ishikawas illustrate multiple levels of potential causes (inputs) and ultimate effects (outputs), of problems or issues that may arise in the course of business Description 1 Description 1 Placeholder Placeholder Placeholder Placeholder Description 1 Description 1 Placeholder Placeholder Placeholder Placeholder Description 1 Description 1 Placeholder Placeholder Placeholder Placeholder Cause Effect Problem / Quality Characteristic Effect that needs improvement
  • 7. 7 Priorities Matrix The Prioritization Matrix helps to rank problems or issues by a particular criterion that is important to the organization Frequency Importance Feasibility Total Points Description 1 How frequently does the problem occur? Sum up all the votes Description 2 What are the problems that you want to resolve first? Description 3 Is it realistic that we can resolve this problem? … … … Rank/Vote: Each participant now votes three times for each criteria and nine times in total
  • 8. 8 GanttSep Oct No v De c Jan Feb Mar Apr Ma y Jun Jul Aug Sep Description 1 Description 2 Description 3 Description 4 … … Communicatio n … Pilot Rollout – Ends in July Approval s Multiplier Plan Implementation … … … Milestones PRTM Complete Assessment Recommend Appr. Governance Structure … … … Median Correctio n
  • 9. 9 Gantt Q4 FY11 Q1 FY12 Q2 FY12 Q3 FY12 Q4 FY12 Sep Oct Nov Dec Jan Feb Mar Apr May Jun Jul Aug Sep Description 1 Description 2 Description 3 Description 4 … … Communicatio n … Pilot Rollout – Ends in July Approval s Multiplier Plan Implementation … … … Milestones PRTM Complete Assessment Recommend Appr. Governance Structure … … … Median Correctio n
  • 10. 10 Root cause Analysis (RCA) Root cause analysis is a class of problem solving methods aimed at identifying the root causes of problems or events No. Possible Cause Weight 1 Cause 1 50% 2 Cause 2 35% 3 Cause 3 25% No. What? How? Who? When? Status 1 … … … … 2 3 Text Cause 1 50% Cause 2 35% Cause 3 25% Cause xx xx%
  • 11. 11 Opportunity Analysis This offers the opportunity to evaluate a list of options against goals and resources and to decide what to do first Goal/Attribute Importance Ability to complete Low Medium High Low Medium High Goal 1 Goal 2 Goal 3 Goal 4 Goal 5
  • 12. 12 Failure Mode Effect Analysis (FMEA) Process Name Process Number Date: Revision: Failure Mode A) Severity Rate 1-10 10 – Most Severe B) Probability of Occurrence Rate 1-10 10 – Highest Probability C) Probability of Detection Rate 1-10 10 – Lowest Probability Risk Preference Number (RPN) A x B x C 1) Xxxxx 5 4 3 60 2) Yyyyyy 3) …..
  • 13. 13 Project Management – Phase Model General Overview of all activities during project execution Project Definition Project Planning Project Management Project Conclusion • Click here to add text • Click here to add text • Click here to add text • Click here to add text
  • 14. 14 Roadmapping Placeholder Q1 FY11 Placeholder • Bullet Point Picture Placeholder Q1 FY11 Q1 FY11 Q1 FY11 Placeholder Placeholder Placeholder Placeholder • Bullet Point Picture Placeholder Placeholder • Bullet Point Picture Placeholder Placeholder • Bullet Point Picture Placeholder
  • 15. 15 Roadmapping Q1 FY11 Q2 FY11 Q3 FY11 Q4 FY11 Placeholder This is a placeholder text Placeholder This is a placeholder text Placeholder This is a placeholder text Placeholder This is a placeholder text Placeholder This is a placeholder text Placeholder This is a placeholder text Placeholder This is a placeholder text Placeholder This is a placeholder text Placeholder
  • 17. 17 Waterfall Model This is an example text. Go ahead and replace it with your own text Thisisanexampletext This is an example text. This is an example text. This is an example text.
  • 18. 18 Cycle Diagrams Example Text 1 2 34 5 6 1 Example text Go ahead and replace it with your own text 2 Example text Go ahead and replace it with your own text 3 Example text Go ahead and replace it with your own text 4 Example text Go ahead and replace it with your own text 5 Example text Go ahead and replace it with your own text 6 Example text Go ahead and replace it with your own text
  • 19. 19 Technical Capability Organization Roadmap Organization Capability Service Delivery Process & Quality ‘PlaceholderText • Placeholder •Placeholder •Placeholder • Placeholder • Placeholder Placeholder • Placeholder • Placeholder  Placeholder  Placeholder  Placeholder  Placeholder Current State Planned State • Placeholder • Placeholder • Placeholder • Placeholder Actions PlannedData Points
  • 20. 20 20 •This is an example text. Go ahead and replace it with your own text. This is an example text. Go ahead and replace it with your own text. •This is an example text. Go ahead and replace it with your own text. •This is an example text. Go ahead and replace it with your own text. This is an example text. Go ahead and replace it with your own text. •This is an example text. Go ahead and replace it with your own text. This is an example text. Go ahead and replace it with your own text. •This is an example text. Go ahead and replace it with your own text. •This is an example text. Go ahead and replace it with your own text. This is an example text. Go ahead and replace it with your own text. Placeholder •This is an example text. Go ahead and replace it with your own text. This is an example text. Go ahead and replace it with your own text. •This is an example text. Go ahead and replace it with your own text. Placeholder •This is an example text. Go ahead and replace it with your own text. This is an example text. Go ahead and replace it with your own text. •This is an example text. Go ahead and replace it with your own text.
  • 21. 21 21 •This is an example text. Go ahead and replace it with your own text. This is an example text. Go ahead and replace it with your own text. •This is an example text. Go ahead and replace it with your own text. •This is an example text. Go ahead and replace it with your own text. This is an example text. Go ahead and replace it with your own text. •This is an example text. Go ahead and replace it with your own text. This is an example text. Go ahead and replace it with your own text. •This is an example text. Go ahead and replace it with your own text. •This is an example text. Go ahead and replace it with your own text. This is an example text. Go ahead and replace it with your own text. Title •This is an example text. Go ahead and replace it with your own text. This is an example text. Go ahead and replace it with your own text. •This is an example text. Go ahead and replace it with your own text. Title •This is an example text. Go ahead and replace it with your own text. This is an example text. Go ahead and replace it with your own text. •This is an example text. Go ahead and replace it with your own text.
  • 22. 22 22 •This is an example text. Go ahead and replace it with your own text. This is an example text. Go ahead and replace it with your own text. •This is an example text. Go ahead and replace it with your own text. •This is an example text. Go ahead and replace it with your own text. This is an example text. Go ahead and replace it with your own text. •This is an example text. Go ahead and replace it with your own text. This is an example text. Go ahead and replace it with your own text. •This is an example text. Go ahead and replace it with your own text. •This is an example text. Go ahead and replace it with your own text. This is an example text. Go ahead and replace it with your own text. Title •This is an example text. Go ahead and replace it with your own text. This is an example text. Go ahead and replace it with your own text. •This is an example text. Go ahead and replace it with your own text. Title •This is an example text. Go ahead and replace it with your own text. This is an example text. Go ahead and replace it with your own text. •This is an example text. Go ahead and replace it with your own text.
  • 23. Document the Services Offshore Landscape – Work Complexity, Topography and Measures Center Framework Assessment – Key components of managing a center Assessment and Identification of Issues Execute Initiatives •Obtain resources and executive support •Select Core Team leaders, core team; develop workplans and milestones; execute Problem Statement and Objective  Improve Offshore Productivity  zzzzza  xxx  Improve Productivity measures by x%  Staff Turnover leading to Productivity and Tenure loss  Increased market activity in LCG locations  High Career Aspirations – Larger mix of young talent base Opportunity to Secure Talent, Increase Tenure and Enhance Center Maturity Problem Statement Objective
  • 24. Preliminary Assessment of Benefit vs. Time to Implement High Low Med . 12+ months 0 -6 months 6 – 12 months Time to Implement LevelofBenefit 2 3 6 7 4 5 1 Note - Assessment is largely direction based on preliminary SWOT analysis conclusions 1. Trainee Program 2. Retention Model 3. Career Growth Framework 4. Methods & Procedures 5. Governance & Leadership 6. Employment Value Proposition 7. Specialize Centers Details provided in the following section

Notes de l'éditeur

  1. India : Current - 2.2 yrs/ Target – 3.5 years Attrition Target – India Current : 19  12 / Arg: 23  16 Average Tenure data Understand you are in the process of updating this slide. Based on some of the data we discussed today a problem statement that says something like the following might be applicable: Offshore centers solve fewer cases per FTE and take longer to solve minor cases than the global average. Centers also receive lower CSAT scores than their peers. Employee retention in Argentina and India in particular are in the 20% range contributing to lower productivity but also to higher costs for training, onboarding and recruiting The objectives(based on the problems identified) is to increase center productivity as defined by the following performance indicators: TTR, backlog, CSAT, Cases closed / FTE, etc…
  2. Slide Objective: There are both long term and near term initiatives/activities currently underway. Attention needs to be prioritized. This slide highlights one near term initiative to be worked