1. Private Equity:
Insights into 2008 Fourth-Quarter Valuations
From J.P. Morgan Asset Management
Insights
For private equity investors, a key implication of
2008’s market turbulence—especially the dramatic
declines in the fourth quarter—is that the timely
delivery of 2008 fourth-quarter valuation estimates
has become more important than usual.
Falling public equity prices and rapidly weakening
economic conditions suggest that private equity val-
uations may have meaningfully dropped both in the
fourth quarter and the year as a whole. This, in turn,
has fostered in investors a greater sense of urgency
not only to reflect lower private equity valuations in
their overall portfolios, but also to receive prelimi-
nary valuation estimates more quickly.
Quarterly valuation of private equity assets typically
takes four weeks or longer. This time lag stretches to
months for fourth-quarter valuations, which are
determined in the course of year-end auditing. The
audit process likely will extend even further in 2009
due to the implementation of FAS 157. As a result,
final year-end valuations of private equity assets
probably will not be available until well into the sec-
ond quarter.
The valuation process itself may need to change.
Current industry practice is to calculate preliminary
fourth-quarter valuations by simply adjusting third-
quarter valuations to add cash contributions and
then subtract distributions. But given public equities’
losses of more than 20% during the fourth quarter,
the use of a method that holds quarterly valuations
flat and adjusts them only for cash flows is unlikely
to generate a reasonable approximation of private
equity’s fair value.
In addition, deteriorating fundamentals and sudden
shifts in market-based variables used to determine
fair value under FAS 157’s valuation methodology
likely will make private equity valuations more vola-
tile, beginning with those for fourth-quarter 2008.
With these concerns in mind, we sought to use our
knowledge and relationships in the private equity
marketplace to gain insights into 2008 fourth-quar-
ter valuations.
Our Methodology
General partners or their rep-•
resentatives provided an esti-
mate of the percentage
change in value for the assets
in specific partnerships
between September 30, 2008
and December 31, 2008.
The percentage change in•
value for each partnership
was calculated on a capital-
weighted basis based on
investment exposure.
Partnerships for which gener-•
al partners provided no valu-
ation estimate were excluded
from the data set.
For partnerships denominat-•
ed in non-U.S. currencies, the
September 30, 2008 valua-
tion was converted to USD
applying September 30, 2008
closing exchange rates, and
the local-currency estimated
December 31, 2008 valuation
was converted to USD apply-
ing December 31, 2008 clos-
ing exchange rates.
In search of better estimates
Shortly before year-end, we informally spoke with a
broad cross-section of private equity general partners
about overall movement in value during the quarter.
The partners also shared with us examples of specific
portfolio-company values and the approaches they
took to determine those values.
In all, we gathered thoughts and data from 190 general
partners covering 446 partnerships valued at approxi-
mately $5.5 billion. Their detailed feedback enabled us
to generate estimates that we believe will prove much
closer to actual valuations than those generated by the
cash-adjustment formula.
Once we obtained the general partners’ valuation esti-
mates, we aggregated the information by categories
such as sector, financing stage and transaction type in
order to better understand changes in private equity
values during the fourth quarter. Our methodology
included weighting results by actual investment expo-
sure; excluding unavailable data from the calculation;
and converting non-USD values (i.e., for holdings
denominated in euros, pounds and yen) into USD using
December 31 closing exchange rates.
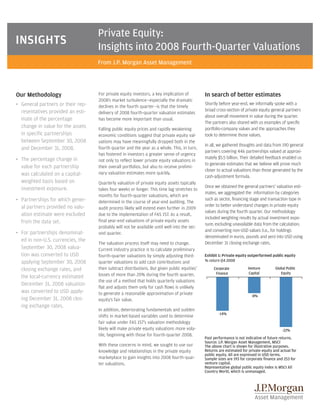
Exhibit 1: Private equity outperformed public equity
% return Q4 2008
Past performance is not indicative of future returns.
Source: J.P. Morgan Asset Management, MSCI
The above chart is shown for illustrative purposes.
Returns are estimated for private equity and actual for
public equity. All are expressed in USD terms.
Sample sizes are 193 for corporate finance and 253 for
venture capital.
Representative global public equity index is MSCI All
Country World, which is unmanaged.
-14%
-8%
-22%
Corporate
Finance
Venture
Capital
Global Public
Equity
2. Insights into 2008 Fourth-Quarter Valuations
2
prices of public companies that remain in the private equity partner-
ships. Examples of these companies include MetroPCS Communications
and Riverbed Technologies.
We had expected the returns for the 2005, 2006 and 2007 vintages to be
lower relative to other vintages, given the significant amounts of capital
invested in highly leveraged public-to-private transactions during those
years. Our expected outcome may occur as more data become available
going forward.
Conclusion: Better valuations can benefit investors
The difficult market environment belies the adequacy of the traditional
cash-adjustment method of estimating quarterly private equity valua-
tions.
Credible estimates of fourth-quarter valuations are vital for investors as
they plan for 2009. Having greater confidence in these valuations can
improve investors’ ability to assess their asset allocations, analyze risk
exposure levels and compare the proportions of liquidity and illiquidity in
their overall portfolios.
We hope the additional perspective and datapoints provided by our sur-
vey can help investors as they evaluate their private equity holdings and
complete their valuation processes.
Results
Our survey data yielded sample sizes that enabled us to generate esti-
mated valuation results by subcategories including corporate finance (i.e.,
existing businesses) and venture capital (i.e., start-up businesses); vin-
tage years; and geography. In aggregate, estimated fourth-quarter per-
formance was uniformly negative but held up better than public equity
markets, as displayed in Exhibit 1 (see preceding page).
Among corporate finance partnerships, valuations in the “mega” size cat-
egory (which includes partnerships primarily from vintages beginning
with 2002 that targeted larger private and public companies for pur-
chase in leveraged buyouts) declined more than those of partnerships
that invest in smaller companies (Exhibit 2). We note that the sample size
of the mega category, 13, was much smaller than in the other categories.
However, given the overall number of mega partnerships, this still repre-
sents a meaningful sample size.
Within venture capital, results were similar for the two main industries
favored by partnerships, technology and life sciences. By contrast, “dual
practice” partnerships—which invest in both industries—experienced
aggregate declines that were somewhat less negative.
Exhibit 3 shows the results by vintage year (i.e., the year in which the
given partnership started its investment period). A meaningful contribu-
tor to the declining values in 1998 and 1999 was the 2008 drop in share
Exhibit 2: Mega corporate finance partnerships performed worst
% return Q4 2008
Past performance is not indicative of future returns.
Source: J.P. Morgan Asset Management
The above chart is shown for illustrative purposes.
Sample sizes are 62 for Small partnerships, 88 for Medium, 36 for Large and
13 for Mega.
Exhibit 3: Surprisingly high results for 2006 and 2007 vintages
% return Q4 2008
-11%
-15%
-14%
-18%
Small
Medium
Large
Mega
Past performance is not indicative of future returns.
Source: J.P. Morgan Asset Management.
The above chart is shown for illustrative purposes
Sample sizes are 30 for 1998, 50 for 1999, 59 for 2000, 24 for 2001, 18 for
2002, 30 for 2003, 27 for 2004, 41 for 2005, 34 for 2006 and 28 for 2007.
-17%
-15%
-12%
-9%
-18%
-12%
-12%
-10%
-9%
-10%
1998 1999 2000 2001 2002 2003 2004 2005 2006 2007
FOR QUALIFIED INVESTORS ONLY. This information has been prepared for investors who are “Qualified Purchasers” as defined in the Investment Company Act of 1940, and
“Accredited Investors” as defined in the Securities Act of 1933.
This document is intended solely to report on various investment views held by J.P. Morgan Asset Management. Opinions, estimates, forecasts, and statements of financial
market trends that are based on current market conditions constitute our judgment and are subject to change without notice. We believe the information provided here is
reliable but should not be assumed to be accurate or complete. The views and strategies described may not be suitable for all investors. References to specific securities, asset
classes and financial markets are for illustrative purposes only and are not intended to be, and should not be interpreted as, recommendations. All case studies are shown for
illustrative purposes only and should not be relied upon as advice or interpreted as a recommendation. They are based on current market conditions that constitute our
judgment and are subject to change. Results shown are not meant to be representative of actual investment results. Past performance is not necessarily indicative of the likely
future performance of an investment.
Investments in private equity funds are illiquid, present significant risks, and may be sold or redeemed at more or less than the original amount invested.
J.P. Morgan Asset Management is the marketing name for the asset management businesses of JPMorgan Chase & Co., and its affiliates worldwide.
IM_2008 Fourth Quarter Evals