SlideShare une entreprise Scribd logo
1  sur  7
April 2015 Existing Home Sales
Conclusion
At a highlevel, April2015 existinghome salesdeclinedto5.04m unitsversusthe 5.19m unitsreportedinMarch
2015, a numberwe believedwasunsustainable giventhatitreflected“badweatherbounceback”inthe Midwest.
The April 2015 results,annualizedandseasonallyadjusted,were the 8th
time inthe last12 monthsthatthe
annualizedandseasonallyadjustedtotal wasgreaterthan5.0m units.
Actual trailing12 monthsales total,whichwere 5.02m unitsinApril 2015, was the 1st
time we climbedabove the
5.0m unitlevel since March2014, whichwere also5.02m units. Saidanotherway,trailing12 monthsaleshave been
flat,pointtopoint,since March 2014.
That said,trailing12 monthsaleshave increased2.6% since the August2014 bottomof 4.9m units. Ona y/ybasis,
actual trailing12 monthssaleshave increased0.6%.
In addition, fromalevel perspective, these trailingtwelvemonthtotalsremaininlinewithresultsseenin1999 when
householdunitswere11%fewerthantoday.
Salescontinue tobe drivenbyhomespricedabove the meanandmedian.
Supplyof homesonthe marketisconsistentwithlevelsseen during“normal”times.
Analysis
1. Volume of Sales
 SeasonallyAdjustedResults and Comparison to Actual Trailing 12 Month Sales
April 2015 existinghome saleswere 5.04m,annualizedandseasonallyadjusted,adecline fromthe previousmonth,
March 2015, whichwas5.21m units.
Actual trailing12 monthsales increasedto 5.02m units, the firsttime theyhave beenabove 5.0munitssince March
2014 whentheywere also5.02m units. While salesona trailing12 monthbasisare flatsince March 2013, theyhave
increased2.6%from theirbottomhitinAugust2014 (4.89m units)andhave increased0.6% y/y:
Belowyoucan see thatthe seasonallyadjustedandannualizedresultsare now equal tothe trailing12 monthactual
sale levels,somethingthatrarelyhappensbutisnotsurprisinggiventhattrailing12 monthactual salesare
essentiallyflat(+0.6%) All that said, we remain at levelsseeninthe late 1990s when householdswere 11% less
than the current level:
 Actual April Sales
Actual March 2015 saleswere 44.5k, 5.5% greaterthan April 2014 totalsbut down2% fromApril 2013:
Date TTM, in MM y/y Relative to August 2014
12/31/2013 5.087
1/31/2014 5.077
2/28/2014 5.055
3/31/2014 5.023
4/30/2014 4.991
5/31/2014 4.950
6/30/2014 4.956
7/31/2014 4.931
8/31/2014 4.892
9/30/2014 4.901 0.2%
10/31/2014 4.920 0.4%
11/30/2014 4.909 -0.2%
12/31/2014 4.935 -3.0% 0.5%
1/31/2015 4.935 -2.8% 0.0%
2/28/2015 4.948 -2.1% 0.3%
3/31/2015 4.998 -0.5% 2.2%
4/30/2015 5.021 0.6% 2.6%
TTM Actual Existing Home Sales
3
3.5
4
4.5
5
5.5
6
6.5
7
7.5
12/1/1999
4/1/2000
8/1/2000
12/1/2000
4/1/2001
8/1/2001
12/1/2001
4/1/2002
8/1/2002
12/1/2002
4/1/2003
8/1/2003
12/1/2003
4/1/2004
8/1/2004
12/1/2004
4/1/2005
8/1/2005
12/1/2005
4/1/2006
8/1/2006
12/1/2006
4/1/2007
8/1/2007
12/1/2007
4/1/2008
8/1/2008
12/1/2008
4/1/2009
8/1/2009
12/1/2009
4/1/2010
8/1/2010
12/1/2010
4/1/2011
8/1/2011
12/1/2011
4/1/2012
8/1/2012
12/1/2012
4/1/2013
8/1/2013
12/1/2013
4/1/2014
8/1/2014
12/1/2014
4/1/2015
Existing Home Sales, Seasonally Adjusted, As Reported Existing Home Sales, Actual, Trailing 12 Months
2. Quality of the Buyer
April salessaw nochange in the relative participationof firsttime,cash,andinvestorbuyers:
The firsttime buyerpercentage remainsatlowlevels buthave improvedoff the bottom:
0.3
0.35
0.4
0.45
0.5
0.55
0.6
0.65
1999 2000 2001 2002 2003 2004 2005 2006 2007 2008 2009 2010 2011 2012 2013 2014 2015
April Existing Home Sales, Non-Seasonally
Adjusted (1999-Present)
April Existing Home Sales, Non-Seasonally Adjusted (1999-Present)
10%
15%
20%
25%
30%
35%
40%
May-11
Jul-11
Sep-11
Nov-11
Jan-12
Mar-12
May-12
Jul-12
Sep-12
Nov-12
Jan-13
Mar-13
May-13
Jul-13
Sep-13
Nov-13
Jan-14
Mar-14
May-14
Jul-14
Sep-14
Nov-14
Jan-15
Mar-15
Existing Home Sales, By Type of Buyer
Investors 1st Time Buyer All Cash
3. Identityof the Buyer
Existinghome saleswere drivenbysurgesinthe salesof home pricesabove boththe median($219k) andaverage
($265k) andare increasingly movingtothe higherendsof the market:
Shownanotherway,youcan see that the accelerationinthe existinghome sale markethascome fromthe price
levelsabove the meanandmedian:
April 2015 Regional Sales Change Less April 2014 Regional Sales Change, by Price
0-100K 100-250K 250-500K 500-750K 750k-1.0m
Northeast -4.6% 10.5% 13.5% 9.3% 15.3%
Midwest 9.0% 23.3% 35.7% 19.2% 15.4%
25%
30%
35%
40%
45%
50%
55% 1q09
2q09
3q09
4q09
1q10
2q10
3q10
4q10
1q11
2q11
3q11
4q11
1q12
2q12
3q12
4q12
1q13
Apr-13
May-13
Jun-13
Jul-13
Aug-13
Sep-13
Oct-13
Nov-13
Dec-13
Jan-14
Feb-14
Mar-14
Apr-14
May-14
Jun-14
Jul-14
Aug-14
Sep-14
Oct-14
Nov-14
Dec-14
Jan-15
Feb-15
Mar-15
Apr-15
Existing Home Sales, 1st Time Buyer
1st Time Buyer
Y/Y Change in Distribution of Sales, by Price Range - US Overall
0-100K 100-250K 250-500K 500-750K 750k-1.0m 1m+
Apr-15 -10.1% 9.0% 21.2% 19.1% 18.0% 13.0%
Mar-15 -4.4% 15.6% 26.9% 24.9% 25.8% 24.0%
Feb-15 -9.0% 8.1% 18.1% 16.2% 12.6% 14.3%
Jan-15 -10.0% 2.0% 10.1% 4.1% 13.0% 2.4%
Dec-14 -4.4% 8.9% 16.0% 15.7% 10.4% 5.2%
Nov-14 -16.0% -1.0% 6.8% 7.1% 3.1% 4.5%
Oct-14 -6.0% 9.7% 10.7% 10.0% 12.4% 16.2%
Sep-14 -7.4% 4.1% 10.0% 6.3% 5.7% 8.1%
Aug-14 -15.9% -3.5% -0.8% -1.5% -1.7% 2.7%
Jul-14 -12.9% -3.4% 1.1% -1.5% 0.5% 5.0%
Jun-14 -8.6% 2.3% 7.2% 4.0% 6.8% 8.5%
May-14 -14.5% -6.6% -2.5% -1.7% -0.1% 4.0%
Apr-14 -12.0% -5.1% 0.2.% 0.3% 2.4% 5.2%
South -4.6% 9.7% 17.7% 27.1% -5.4%
West 12.2% 13.6% 25.9% 26.8% 26.1%
Total 1.9% 14.1% 21.0% 18.8% 15.6%
4. Supplyof Homes on the Market
Overall supplyonthe market increasedto5.3 monthsfrom4.6 monthsreportedinthe previousmonthbutbelow
the 5.7 monthsreportedinApril 2014. While the currentlevel isbelowthe longtermaverage,itisabove the supply
level seenduring1999-2005. Nonetheless,at5.3 months,we view the marketasbalanced:
The same can be saidof monthsof supplyfor existing1-4familyhomes,whichisnow above the level seenfrom
1998-2006:
3
4
5
6
7
8
9
10
11
12
13
1/1/1999
10/1/1999
7/1/2000
4/1/2001
1/1/2002
10/1/2002
7/1/2003
4/1/2004
1/1/2005
10/1/2005
7/1/2006
4/1/2007
1/1/2008
10/1/2008
7/1/2009
4/1/2010
1/1/2011
10/1/2011
7/1/2012
4/1/2013
1/1/2014
10/1/2014
Months Supply, Total Existing Homes
Months Supply, Total US Existing Homes Average
5. Size of Housing to Overall US GDP
Housingactivityisnowback inline with GDP:
3
5
7
9
11
13
15
6/1/1982
12/1/1983
6/1/1985
12/1/1986
6/1/1988
12/1/1989
6/1/1991
12/1/1992
6/1/1994
12/1/1995
6/1/1997
12/1/1998
6/1/2000
12/1/2001
6/1/2003
12/1/2004
6/1/2006
12/1/2007
6/1/2009
12/1/2010
6/1/2012
12/1/2013
Months Supply, Existing Homes, 1-4
Family
Months Supply, Existing Homes, 1-4 Family Average
2.00%
3.00%
4.00%
5.00%
6.00%
7.00%
8.00%
9.00%
10.00%
11.00%
12.00%
3/1/1968
6/1/1969
9/1/1970
12/1/1971
3/1/1973
6/1/1974
9/1/1975
12/1/1976
3/1/1978
6/1/1979
9/1/1980
12/1/1981
3/1/1983
6/1/1984
9/1/1985
12/1/1986
3/1/1988
6/1/1989
9/1/1990
12/1/1991
3/1/1993
6/1/1994
9/1/1995
12/1/1996
3/1/1998
6/1/1999
9/1/2000
12/1/2001
3/1/2003
6/1/2004
9/1/2005
12/1/2006
3/1/2008
6/1/2009
9/1/2010
12/1/2011
3/1/2013
6/1/2014
Existing Home Sales Median Price * Volume/GDP, Nominal
Existing Home Sales Median Price * Volume/GDP Average (1968-Present) Average (1968-6/30/1997)

Contenu connexe

Tendances

Tendances (18)

Market Indicators - General Overview - March 2015
Market Indicators - General Overview - March 2015Market Indicators - General Overview - March 2015
Market Indicators - General Overview - March 2015
 
May 2015 - Market Snapshot - General Overview
May 2015 - Market Snapshot - General OverviewMay 2015 - Market Snapshot - General Overview
May 2015 - Market Snapshot - General Overview
 
Market Indicators - General Overview - October 2014
Market Indicators - General Overview - October 2014Market Indicators - General Overview - October 2014
Market Indicators - General Overview - October 2014
 
November 2015 - Market Snapshot - General Overview
November 2015 - Market Snapshot - General OverviewNovember 2015 - Market Snapshot - General Overview
November 2015 - Market Snapshot - General Overview
 
October 2015 - Market Snapshot - General Overvew
October 2015 - Market Snapshot - General OvervewOctober 2015 - Market Snapshot - General Overvew
October 2015 - Market Snapshot - General Overvew
 
June 2015 - General Overview
June 2015 - General Overview June 2015 - General Overview
June 2015 - General Overview
 
September 2015 - Market Snapshot - General Overvew
September 2015 - Market Snapshot - General OvervewSeptember 2015 - Market Snapshot - General Overvew
September 2015 - Market Snapshot - General Overvew
 
July 2015 - Market Snapshot - General Overview
July 2015  - Market Snapshot - General OverviewJuly 2015  - Market Snapshot - General Overview
July 2015 - Market Snapshot - General Overview
 
Market Indicators - General Overview - February 2015
Market Indicators - General Overview - February 2015Market Indicators - General Overview - February 2015
Market Indicators - General Overview - February 2015
 
August 2015 - Market snapshot - General Overview
August 2015 - Market snapshot - General OverviewAugust 2015 - Market snapshot - General Overview
August 2015 - Market snapshot - General Overview
 
Employee Engagement Calendar Team Management Gantt Chart Marking Weekly Organ...
Employee Engagement Calendar Team Management Gantt Chart Marking Weekly Organ...Employee Engagement Calendar Team Management Gantt Chart Marking Weekly Organ...
Employee Engagement Calendar Team Management Gantt Chart Marking Weekly Organ...
 
Market Indicators - General Overview - January 2015
Market Indicators - General Overview - January 2015Market Indicators - General Overview - January 2015
Market Indicators - General Overview - January 2015
 
December 2015 - Market Snapshot - General Overview
December 2015 - Market Snapshot - General OverviewDecember 2015 - Market Snapshot - General Overview
December 2015 - Market Snapshot - General Overview
 
FHC BUDGET MADRID SHG 2017
FHC BUDGET MADRID SHG 2017FHC BUDGET MADRID SHG 2017
FHC BUDGET MADRID SHG 2017
 
Market Indicators - General Overview - December 2014
Market Indicators - General Overview - December 2014Market Indicators - General Overview - December 2014
Market Indicators - General Overview - December 2014
 
San Francisco Market Focus May 2016
San Francisco Market Focus May 2016San Francisco Market Focus May 2016
San Francisco Market Focus May 2016
 
4 PROJECTED BUDGETING FHC BERLIN SHG 2017
4 PROJECTED BUDGETING FHC BERLIN SHG 20174 PROJECTED BUDGETING FHC BERLIN SHG 2017
4 PROJECTED BUDGETING FHC BERLIN SHG 2017
 
San Francisco Market Focus September 2016
San Francisco Market Focus September 2016San Francisco Market Focus September 2016
San Francisco Market Focus September 2016
 

En vedette (13)

May 2015 Jobs Report Observations (Grant Toch)
May 2015 Jobs Report Observations (Grant Toch)May 2015 Jobs Report Observations (Grant Toch)
May 2015 Jobs Report Observations (Grant Toch)
 
March 2015 New Home Sales (Grant Toch)
March 2015 New Home Sales (Grant Toch)March 2015 New Home Sales (Grant Toch)
March 2015 New Home Sales (Grant Toch)
 
certificates002
certificates002certificates002
certificates002
 
April 2015 Single Family Permits and Starts
April 2015 Single Family Permits and StartsApril 2015 Single Family Permits and Starts
April 2015 Single Family Permits and Starts
 
March 2015 US Trade Balance Data (Grant Toch)
March 2015 US Trade Balance Data (Grant Toch)March 2015 US Trade Balance Data (Grant Toch)
March 2015 US Trade Balance Data (Grant Toch)
 
April 2015 Personal Income Data
April 2015 Personal Income DataApril 2015 Personal Income Data
April 2015 Personal Income Data
 
Alt tab mobile company overview - feb 2015
Alt tab mobile   company overview - feb 2015Alt tab mobile   company overview - feb 2015
Alt tab mobile company overview - feb 2015
 
March 2015 Consumer Credit (Grant Toch)
March 2015 Consumer Credit (Grant Toch)March 2015 Consumer Credit (Grant Toch)
March 2015 Consumer Credit (Grant Toch)
 
Social Media_Berthot
Social Media_BerthotSocial Media_Berthot
Social Media_Berthot
 
April 2015 US Trade Balance Data (GT)
April 2015 US Trade Balance Data (GT)April 2015 US Trade Balance Data (GT)
April 2015 US Trade Balance Data (GT)
 
April 2015 Consumer Confidence
April 2015 Consumer ConfidenceApril 2015 Consumer Confidence
April 2015 Consumer Confidence
 
Sharda Kumar Resume M
Sharda Kumar Resume MSharda Kumar Resume M
Sharda Kumar Resume M
 
Resume-Bihag
Resume-BihagResume-Bihag
Resume-Bihag
 

Similaire à April 2015 Existing Home Sales (Grant Toch)

March2015 market indicators-general-overview
March2015 market indicators-general-overviewMarch2015 market indicators-general-overview
March2015 market indicators-general-overview
MLSListings Inc
 
Comparativo estudios de_opinion
Comparativo estudios de_opinionComparativo estudios de_opinion
Comparativo estudios de_opinion
Martin Triana
 
San Francisco Market Focus May 2014
San Francisco Market Focus May 2014San Francisco Market Focus May 2014
San Francisco Market Focus May 2014
Ronny Budiutama
 

Similaire à April 2015 Existing Home Sales (Grant Toch) (20)

San Francisco Market Focus September 2014
San Francisco Market Focus September 2014San Francisco Market Focus September 2014
San Francisco Market Focus September 2014
 
The Georgia Association Of Realtors Monthly Indicators For April 2014
The Georgia Association Of Realtors Monthly Indicators For April 2014The Georgia Association Of Realtors Monthly Indicators For April 2014
The Georgia Association Of Realtors Monthly Indicators For April 2014
 
March2015 market indicators-general-overview
March2015 market indicators-general-overviewMarch2015 market indicators-general-overview
March2015 market indicators-general-overview
 
San Francisco Market Focus April 2015
San Francisco Market Focus April 2015San Francisco Market Focus April 2015
San Francisco Market Focus April 2015
 
Austin Industrial Overview | 4Q 2015
Austin Industrial Overview | 4Q 2015Austin Industrial Overview | 4Q 2015
Austin Industrial Overview | 4Q 2015
 
San Francisco Market Focus May 2015
San Francisco Market Focus May 2015San Francisco Market Focus May 2015
San Francisco Market Focus May 2015
 
Comparativo estudios de_opinion
Comparativo estudios de_opinionComparativo estudios de_opinion
Comparativo estudios de_opinion
 
Cox Automotive Market Insight Overview February 2019
Cox Automotive Market Insight Overview   February 2019Cox Automotive Market Insight Overview   February 2019
Cox Automotive Market Insight Overview February 2019
 
FNB Residential Property Barometer_February 2019
FNB Residential Property Barometer_February 2019FNB Residential Property Barometer_February 2019
FNB Residential Property Barometer_February 2019
 
Developing the Australian mango market in Korea - Presentation from the 10th ...
Developing the Australian mango market in Korea - Presentation from the 10th ...Developing the Australian mango market in Korea - Presentation from the 10th ...
Developing the Australian mango market in Korea - Presentation from the 10th ...
 
November 2014 Greater Boston Real Estate Market Trends Report
November 2014 Greater Boston Real Estate Market Trends ReportNovember 2014 Greater Boston Real Estate Market Trends Report
November 2014 Greater Boston Real Estate Market Trends Report
 
San Francisco Market Focus February 2015
San Francisco Market Focus February 2015San Francisco Market Focus February 2015
San Francisco Market Focus February 2015
 
Christmas Subscriptions Benchmarking Report
Christmas Subscriptions Benchmarking ReportChristmas Subscriptions Benchmarking Report
Christmas Subscriptions Benchmarking Report
 
Greater Boston Association of Realtors Monthly Housing Data: October 2016
Greater Boston Association of Realtors Monthly Housing Data: October 2016Greater Boston Association of Realtors Monthly Housing Data: October 2016
Greater Boston Association of Realtors Monthly Housing Data: October 2016
 
150430 2015.1분기 온라인쇼핑동향
150430 2015.1분기 온라인쇼핑동향150430 2015.1분기 온라인쇼핑동향
150430 2015.1분기 온라인쇼핑동향
 
San Francisco Market Focus May 2014
San Francisco Market Focus May 2014San Francisco Market Focus May 2014
San Francisco Market Focus May 2014
 
Presentation for Sales Performance
Presentation for Sales Performance Presentation for Sales Performance
Presentation for Sales Performance
 
Consumer Price Index (CPI), September 2015 (Oct 2015)
Consumer Price Index (CPI), September 2015 (Oct 2015)Consumer Price Index (CPI), September 2015 (Oct 2015)
Consumer Price Index (CPI), September 2015 (Oct 2015)
 
San Francisco Market Data December 2014
San Francisco Market Data December 2014San Francisco Market Data December 2014
San Francisco Market Data December 2014
 
Naea 07-14
Naea 07-14Naea 07-14
Naea 07-14
 

April 2015 Existing Home Sales (Grant Toch)

  • 1. April 2015 Existing Home Sales Conclusion At a highlevel, April2015 existinghome salesdeclinedto5.04m unitsversusthe 5.19m unitsreportedinMarch 2015, a numberwe believedwasunsustainable giventhatitreflected“badweatherbounceback”inthe Midwest. The April 2015 results,annualizedandseasonallyadjusted,were the 8th time inthe last12 monthsthatthe annualizedandseasonallyadjustedtotal wasgreaterthan5.0m units. Actual trailing12 monthsales total,whichwere 5.02m unitsinApril 2015, was the 1st time we climbedabove the 5.0m unitlevel since March2014, whichwere also5.02m units. Saidanotherway,trailing12 monthsaleshave been flat,pointtopoint,since March 2014. That said,trailing12 monthsaleshave increased2.6% since the August2014 bottomof 4.9m units. Ona y/ybasis, actual trailing12 monthssaleshave increased0.6%. In addition, fromalevel perspective, these trailingtwelvemonthtotalsremaininlinewithresultsseenin1999 when householdunitswere11%fewerthantoday. Salescontinue tobe drivenbyhomespricedabove the meanandmedian. Supplyof homesonthe marketisconsistentwithlevelsseen during“normal”times. Analysis 1. Volume of Sales  SeasonallyAdjustedResults and Comparison to Actual Trailing 12 Month Sales April 2015 existinghome saleswere 5.04m,annualizedandseasonallyadjusted,adecline fromthe previousmonth, March 2015, whichwas5.21m units. Actual trailing12 monthsales increasedto 5.02m units, the firsttime theyhave beenabove 5.0munitssince March 2014 whentheywere also5.02m units. While salesona trailing12 monthbasisare flatsince March 2013, theyhave increased2.6%from theirbottomhitinAugust2014 (4.89m units)andhave increased0.6% y/y:
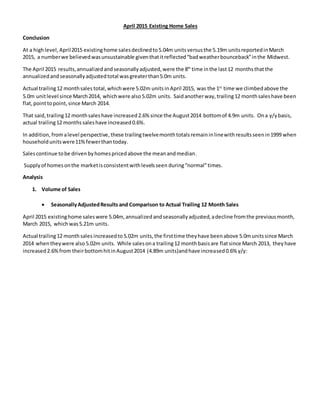
  • 2. Belowyoucan see thatthe seasonallyadjustedandannualizedresultsare now equal tothe trailing12 monthactual sale levels,somethingthatrarelyhappensbutisnotsurprisinggiventhattrailing12 monthactual salesare essentiallyflat(+0.6%) All that said, we remain at levelsseeninthe late 1990s when householdswere 11% less than the current level:  Actual April Sales Actual March 2015 saleswere 44.5k, 5.5% greaterthan April 2014 totalsbut down2% fromApril 2013: Date TTM, in MM y/y Relative to August 2014 12/31/2013 5.087 1/31/2014 5.077 2/28/2014 5.055 3/31/2014 5.023 4/30/2014 4.991 5/31/2014 4.950 6/30/2014 4.956 7/31/2014 4.931 8/31/2014 4.892 9/30/2014 4.901 0.2% 10/31/2014 4.920 0.4% 11/30/2014 4.909 -0.2% 12/31/2014 4.935 -3.0% 0.5% 1/31/2015 4.935 -2.8% 0.0% 2/28/2015 4.948 -2.1% 0.3% 3/31/2015 4.998 -0.5% 2.2% 4/30/2015 5.021 0.6% 2.6% TTM Actual Existing Home Sales 3 3.5 4 4.5 5 5.5 6 6.5 7 7.5 12/1/1999 4/1/2000 8/1/2000 12/1/2000 4/1/2001 8/1/2001 12/1/2001 4/1/2002 8/1/2002 12/1/2002 4/1/2003 8/1/2003 12/1/2003 4/1/2004 8/1/2004 12/1/2004 4/1/2005 8/1/2005 12/1/2005 4/1/2006 8/1/2006 12/1/2006 4/1/2007 8/1/2007 12/1/2007 4/1/2008 8/1/2008 12/1/2008 4/1/2009 8/1/2009 12/1/2009 4/1/2010 8/1/2010 12/1/2010 4/1/2011 8/1/2011 12/1/2011 4/1/2012 8/1/2012 12/1/2012 4/1/2013 8/1/2013 12/1/2013 4/1/2014 8/1/2014 12/1/2014 4/1/2015 Existing Home Sales, Seasonally Adjusted, As Reported Existing Home Sales, Actual, Trailing 12 Months
  • 3. 2. Quality of the Buyer April salessaw nochange in the relative participationof firsttime,cash,andinvestorbuyers: The firsttime buyerpercentage remainsatlowlevels buthave improvedoff the bottom: 0.3 0.35 0.4 0.45 0.5 0.55 0.6 0.65 1999 2000 2001 2002 2003 2004 2005 2006 2007 2008 2009 2010 2011 2012 2013 2014 2015 April Existing Home Sales, Non-Seasonally Adjusted (1999-Present) April Existing Home Sales, Non-Seasonally Adjusted (1999-Present) 10% 15% 20% 25% 30% 35% 40% May-11 Jul-11 Sep-11 Nov-11 Jan-12 Mar-12 May-12 Jul-12 Sep-12 Nov-12 Jan-13 Mar-13 May-13 Jul-13 Sep-13 Nov-13 Jan-14 Mar-14 May-14 Jul-14 Sep-14 Nov-14 Jan-15 Mar-15 Existing Home Sales, By Type of Buyer Investors 1st Time Buyer All Cash
  • 4. 3. Identityof the Buyer Existinghome saleswere drivenbysurgesinthe salesof home pricesabove boththe median($219k) andaverage ($265k) andare increasingly movingtothe higherendsof the market: Shownanotherway,youcan see that the accelerationinthe existinghome sale markethascome fromthe price levelsabove the meanandmedian: April 2015 Regional Sales Change Less April 2014 Regional Sales Change, by Price 0-100K 100-250K 250-500K 500-750K 750k-1.0m Northeast -4.6% 10.5% 13.5% 9.3% 15.3% Midwest 9.0% 23.3% 35.7% 19.2% 15.4% 25% 30% 35% 40% 45% 50% 55% 1q09 2q09 3q09 4q09 1q10 2q10 3q10 4q10 1q11 2q11 3q11 4q11 1q12 2q12 3q12 4q12 1q13 Apr-13 May-13 Jun-13 Jul-13 Aug-13 Sep-13 Oct-13 Nov-13 Dec-13 Jan-14 Feb-14 Mar-14 Apr-14 May-14 Jun-14 Jul-14 Aug-14 Sep-14 Oct-14 Nov-14 Dec-14 Jan-15 Feb-15 Mar-15 Apr-15 Existing Home Sales, 1st Time Buyer 1st Time Buyer Y/Y Change in Distribution of Sales, by Price Range - US Overall 0-100K 100-250K 250-500K 500-750K 750k-1.0m 1m+ Apr-15 -10.1% 9.0% 21.2% 19.1% 18.0% 13.0% Mar-15 -4.4% 15.6% 26.9% 24.9% 25.8% 24.0% Feb-15 -9.0% 8.1% 18.1% 16.2% 12.6% 14.3% Jan-15 -10.0% 2.0% 10.1% 4.1% 13.0% 2.4% Dec-14 -4.4% 8.9% 16.0% 15.7% 10.4% 5.2% Nov-14 -16.0% -1.0% 6.8% 7.1% 3.1% 4.5% Oct-14 -6.0% 9.7% 10.7% 10.0% 12.4% 16.2% Sep-14 -7.4% 4.1% 10.0% 6.3% 5.7% 8.1% Aug-14 -15.9% -3.5% -0.8% -1.5% -1.7% 2.7% Jul-14 -12.9% -3.4% 1.1% -1.5% 0.5% 5.0% Jun-14 -8.6% 2.3% 7.2% 4.0% 6.8% 8.5% May-14 -14.5% -6.6% -2.5% -1.7% -0.1% 4.0% Apr-14 -12.0% -5.1% 0.2.% 0.3% 2.4% 5.2%
  • 5. South -4.6% 9.7% 17.7% 27.1% -5.4% West 12.2% 13.6% 25.9% 26.8% 26.1% Total 1.9% 14.1% 21.0% 18.8% 15.6% 4. Supplyof Homes on the Market Overall supplyonthe market increasedto5.3 monthsfrom4.6 monthsreportedinthe previousmonthbutbelow the 5.7 monthsreportedinApril 2014. While the currentlevel isbelowthe longtermaverage,itisabove the supply level seenduring1999-2005. Nonetheless,at5.3 months,we view the marketasbalanced: The same can be saidof monthsof supplyfor existing1-4familyhomes,whichisnow above the level seenfrom 1998-2006: 3 4 5 6 7 8 9 10 11 12 13 1/1/1999 10/1/1999 7/1/2000 4/1/2001 1/1/2002 10/1/2002 7/1/2003 4/1/2004 1/1/2005 10/1/2005 7/1/2006 4/1/2007 1/1/2008 10/1/2008 7/1/2009 4/1/2010 1/1/2011 10/1/2011 7/1/2012 4/1/2013 1/1/2014 10/1/2014 Months Supply, Total Existing Homes Months Supply, Total US Existing Homes Average
  • 6. 5. Size of Housing to Overall US GDP Housingactivityisnowback inline with GDP: 3 5 7 9 11 13 15 6/1/1982 12/1/1983 6/1/1985 12/1/1986 6/1/1988 12/1/1989 6/1/1991 12/1/1992 6/1/1994 12/1/1995 6/1/1997 12/1/1998 6/1/2000 12/1/2001 6/1/2003 12/1/2004 6/1/2006 12/1/2007 6/1/2009 12/1/2010 6/1/2012 12/1/2013 Months Supply, Existing Homes, 1-4 Family Months Supply, Existing Homes, 1-4 Family Average