the bmj | BMJ 2021;373:n1343 | doi: 10.1136/bmj.n1343 1
R E S E A R C H
Effect of the covid-19 pandemic in 2020 on life expectancy
across populations in the USA and other high income countries:
simulations of provisional mortality data
Steven H Woolf,1 Ryan K Masters,2 Laudan Y Aron3
ABSTRACT
OBJECTIVE
To estimate changes in life expectancy in 2010-18
and during the covid-19 pandemic in 2020 across
population groups in the United States and to
compare outcomes with peer nations.
DESIGN
Simulations of provisional mortality data.
SETTING
US and 16 other high income countries in 2010-
18 and 2020, by sex, including an analysis of US
outcomes by race and ethnicity.
POPULATION
Data for the US and for 16 other high income countries
from the National Center for Health Statistics and the
Human Mortality Database, respectively.
MAIN OUTCOME MEASURES
Life expectancy at birth, and at ages 25 and 65,
by sex, and, in the US only, by race and ethnicity.
Analysis excluded 2019 because life table data were
not available for many peer countries. Life expectancy
in 2020 was estimated by simulating life tables from
estimated age specific mortality rates in 2020 and
allowing for 10% random error. Estimates for 2020 are
reported as medians with fifth and 95th centiles.
RESULTS
Between 2010 and 2018, the gap in life expectancy
between the US and the peer country average
increased from 1.88 years (78.66 v 80.54 years,
respectively) to 3.05 years (78.74 v 81.78 years).
Between 2018 and 2020, life expectancy in the US
decreased by 1.87 years (to 76.87 years), 8.5 times
the average decrease in peer countries (0.22 years),
widening the gap to 4.69 years. Life expectancy in
the US decreased disproportionately among racial
and ethnic minority groups between 2018 and
2020, declining by 3.88, 3.25, and 1.36 years in
Hispanic, non-Hispanic Black, and non-Hispanic
White populations, respectively. In Hispanic and
non-Hispanic Black populations, reductions in life
expectancy were 15 and 18 times the average in
peer countries, respectively. Progress since 2010 in
reducing the gap in life expectancy in the US between
Black and White people was erased in 2018-20; life
expectancy in Black men reached its lowest level since
1998 (67.73 years), and the longstanding Hispanic
life expectancy advantage almost disappeared.
CONCLUSIONS
The US had a much larger decrease in life expectancy
between 2018 and 2020 than other high income
nations, with pronounced losses among the Hispanic
and non-Hispanic Black populations. A longstanding
and widening US health disadvantage, high death
rates in 2020, and continued inequitable effects
on racial and ethnic minority groups are likely the
products of longstanding policy choices and systemic
racism.
Introduction
In 2020, covid-19 became the third leading cause of
death in the United States1 and was thus expected to
substantially lower life expectancy for that year (box
1). The US had more deaths fr ...
This PowerPoint helps students to consider the concept of infinity.
the bmj BMJ 2021;373n1343 doi 10.1136bmj.n1343 1R E
1. the bmj | BMJ 2021;373:n1343 | doi: 10.1136/bmj.n1343 1
R E S E A R C H
Effect of the covid-19 pandemic in 2020 on life expectancy
across populations in the USA and other high income countries:
simulations of provisional mortality data
Steven H Woolf,1 Ryan K Masters,2 Laudan Y Aron3
ABSTRACT
OBJECTIVE
To estimate changes in life expectancy in 2010-18
and during the covid-19 pandemic in 2020 across
population groups in the United States and to
compare outcomes with peer nations.
DESIGN
Simulations of provisional mortality data.
SETTING
US and 16 other high income countries in 2010-
18 and 2020, by sex, including an analysis of US
outcomes by race and ethnicity.
POPULATION
Data for the US and for 16 other high income countries
from the National Center for Health Statistics and the
Human Mortality Database, respectively.
MAIN OUTCOME MEASURES
Life expectancy at birth, and at ages 25 and 65,
by sex, and, in the US only, by race and ethnicity.
Analysis excluded 2019 because life table data were
not available for many peer countries. Life expectancy
in 2020 was estimated by simulating life tables from
estimated age specific mortality rates in 2020 and
2. allowing for 10% random error. Estimates for 2020 are
reported as medians with fifth and 95th centiles.
RESULTS
Between 2010 and 2018, the gap in life expectancy
between the US and the peer country average
increased from 1.88 years (78.66 v 80.54 years,
respectively) to 3.05 years (78.74 v 81.78 years).
Between 2018 and 2020, life expectanc y in the US
decreased by 1.87 years (to 76.87 years), 8.5 times
the average decrease in peer countries (0.22 years),
widening the gap to 4.69 years. Life expectancy in
the US decreased disproportionately among racial
and ethnic minority groups between 2018 and
2020, declining by 3.88, 3.25, and 1.36 years in
Hispanic, non-Hispanic Black, and non-Hispanic
White populations, respectively. In Hispanic and
non-Hispanic Black populations, reductions in life
expectancy were 15 and 18 times the average in
peer countries, respectively. Progress since 2010 in
reducing the gap in life expectancy in the US between
Black and White people was erased in 2018-20; life
expectancy in Black men reached its lowest level since
1998 (67.73 years), and the longsta nding Hispanic
life expectancy advantage almost disappeared.
CONCLUSIONS
The US had a much larger decrease in life expectancy
between 2018 and 2020 than other high income
nations, with pronounced losses among the Hispanic
and non-Hispanic Black populations. A longstanding
and widening US health disadvantage, high death
rates in 2020, and continued inequitable effects
on racial and ethnic minority groups are likely the
products of longstanding policy choices and systemic
racism.
3. Introduction
In 2020, covid-19 became the third leading cause of
death in the United States1 and was thus expected to
substantially lower life expectancy for that year (box
1). The US had more deaths from covid-19 than any
other country in the world and among the highest per
capita mortality rates.5 This surge in deaths prompted
speculation that the US would have a larger decrease
in life expectancy in 2020 than peer nations, but
empirical evidence has not been published. Americans
entered the pandemic at a distinct disadvantage relative
to other high income peer nations: improvements in
overall life expectancy have not kept pace with those
in peer countries since the 1980s,6 and in 2011, life
expectancy in the US plateaued and then decreased for
three consecutive years, further widening the gap in
mortality with peer nations.7
The effect of the pandemic on life expectancy
extends beyond deaths attributed to covid-19.8 Studies
have found an even larger number of excess deaths
during the pandemic, inflated by undocumented
deaths from covid-19 and by deaths from non-
covid-19 causes resulting from disruptions by the
pandemic (eg, reduced access to healthcare, economic
pressures, and mental health crises).9-12 Some racial
1Center on Society and Health,
Virginia Commonwealth
University School of Medicine,
Richmond, VA, USA
2Department of Sociology,
Health and Society Program and
Population Program, Institute of
Behavioral Science, University
of Colorado Population Center,
4. University of Colorado Boulder,
CO, USA
3Urban Institute, Washington,
DC, USA
Correspondence to: S H Woolf
[email protected]
(or @shwoolf on Twitter
ORCID 0000-0001-9384-033X)
Additional material is published
online only. To view please visit
the journal online.
Cite this as: BMJ 2021;373:n1343
http://dx.doi.org/10.1136/bmj.n1343
Accepted: 24 May 2021
WHAT IS ALREADY KNOWN ON THIS TOPIC
Because of systemic factors in the United States, the gap
between life
expectancy in the US and other high income countries has been
widening for
decades
In 2020, the US had more deaths from the covid-19 pandemic
than any other
country, but no study has quantified how the year’s large
number of deaths
affected life expectancy in the US or the gap with peer countries
WHAT THIS STUDY ADDS
Between 2018 and 2020, largely because of the covid-19
pandemic, life
expectancy in the US decreased by 1.87 years, 8.5 times the
average decrease in
peer countries, widening the gap in life expectancy with peer
countries to 4.69
years
5. In the US, decreases in life expectancy in Hispanic and non-
Hispanic Black
people were about two to three times greater than in the non-
Hispanic White
population, reversing years of progress in reducing racial and
ethnic disparities,
and lowering the life expectancy of Black men to 67.73 years, a
level not seen
since 1998
mailto:[email protected]
https://twitter.com/shwoolf?lang=en
https://orcid.org/0000-0001-9384-033X
https://crossmark.crossref.org/dialog/?doi=10.1136/bmj.n1343&
domain=pdf&date_stamp=2021-06-16
R E S E A R C H
2 doi: 10.1136/bmj.n1343 | BMJ 2021;373:n1343 | the bmj
and ethnic populations and age groups have been
disproportionately affected.13-15 Research on how the
pandemic has affected life expectancy is only just
emerging.16 17 Few studies have examined reductions
in 2020 life expectancy across racial and ethnic
groups, and none has compared the decline in the US
with other countries.
Methods
We estimated life expectancy at birth and at ages 25
and 65, examining the US population (in aggregate
and by sex, and by race and ethnicity) and the
populations of 16 high income countries (in aggregate
and by sex). Estimates of life expectancy for 2010-
6. 18 were calculated from official life tables and were
modeled for 2020. Estimates for 2019 would have
been preferable to determine the effect of the covid-19
pandemic but life table data were unavailable for many
peer countries. Life expectancy in the US is estimated
to have increased by only 0.1 years between 2018 and
2019,18 however, and therefore the changes seen in
life expectancy between 2018 and 2020 are largely
attributable to the events of 2020.
Data for peer countries did not include information
on race or ethnicity. US data were examined for
three racial and ethnic groups that constitute more
than 90% of the total population: Hispanic, non-
Hispanic Black, and non-Hispanic White populations.
Although many US individuals self-identify as Latino
or Latina, we used Hispanic to maintain consistency
with data sources. White and Black populations in
this study refer to people in these racial groups who
do not identify as Hispanic or Latinx.19 Estimates for
other important racial groups, such as Asian, Pacific
Islander, and Native American (American Indians and
Alaskan Natives) could not be calculated because the
National Center for Health Statistics does not provide
official life tables for these populations.
US life tables for 2010-18 were obtained from the
National Center for Health Statistics.20-28 Weekly
age specific death counts for all men and women in
the US and for Black, White, and Hispanic men and
women in the US for the years 2018 and 2020 were
obtained from the National Center for Health Statistics’
AH (ad hoc) Excess Deaths by Sex, Age, and Race
file.29 Mid-year population estimates by age, sex, and
race and ethnicity for men and women in the US for
2015-19 were obtained from the US Census Bureau.30
7. Population counts for 2020 were estimated from age
specific trends in US population estimates for 2015-19.
The National Center for Health Statistics and US Census
data were merged at ages 0-14, 15-19, . . . 80-84, ≥85
to calculate age specific death rates (mx) for 2018 and
2020 for men and women in the US in aggregate and by
race and ethnicity.
Peer countries included 16 high income democracies
with adequate data for analysis: Austria, Belgium,
Denmark, Finland, France, Israel, Netherlands, New
Zealand, Norway, South Korea, Portugal, Spain, Sweden,
Switzerland, Taiwan, and the United Kingdom. Taiwan
was treated as a country for our analysis although many
countries do not recognize it as an independent country.
Australia, Canada, Germany, Italy, and Japan were not
included because of incomplete mortality data. To
estimate life expectancy in these countries, five year
abridged life tables for male and female populations of
the peer countries were obtained for 2010-18 from the
Human Mortality Database31 (direct sources32 33 were
used for Israel and New Zealand because current data
were lacking in the Human Mortality Database). Weekly
death counts in 2018 and 2020 by country for ages
0-14, 15-64, 65-74, 75-84, and ≥85 were obtained from
the Human Mortality Database Short Term Mortality
Fluctuations files.
Box 1: Meaning of life expectancy during a pandemic
Life expectancy is a widely used statistic for summarizing a
population’s mortality
rates at a given time.2 It reflects how long a group of people
can expect to live were
they to experience at each age the prevailing age specific
mortality rates of that year.3
8. Estimates of life expectancy are sometimes misunderstood. We
cannot know the
future age specific mortality rates for people born or living
today, but we do know the
current rates. Computing life expectancy (at birth, or at ages 25
or 65) based on these
rates is valuable for understanding and comparing a country’s
mortality profile over
time or across places at a given point in time. Estimates of life
expectancy during the
covid-19 pandemic, such as those reported here, can help clar ify
which people or
places were most affected, but they do not predict how long a
group of people will
live. This study estimated life expectancy for 2020. Life
expectancy for 2021 and
subsequent years, and how quickly life expectancy will rebound,
cannot be calculated
until data for these years become available. Although life
expectancy is expected
to recover in time to levels before the pandemic, past pandemics
have shown that
survivors can be left with lifelong consequences, depending on
their age and other
socioeconomic circumstances.4
Visual Abstract Life expectancy in the wake of covid-19
The US has been hit harder than its peers
Study design
2010-20
mortality data
Data
analysis
11. -1.87
US
PC
HI BL
BL
US
PC
HI
R E S E A R C H
the bmj | BMJ 2021;373:n1343 | doi: 10.1136/bmj.n1343 3
To calculate life expectancy estimates for 2020, we
used data from the National Center for Health Statistics
and US Census Bureau to estimate rate ratios between
the age specific mortality rates of 2018 (2018 mx) and
2020 (2020 mx) for US populations. For populations in
peer countries, values for 2018 mx and 2020 mx, taken
from data in the Human Mortality Database Short
Term Mortality Fluctuations files, were estimated for
ages 0-14, 15-64, 65-74, 75-84, and ≥85. Age specific
mortality rate ratios between 2020 mx and 2018 mx data
in the Human Mortality Database Short Term Mortality
Fluctuations were estimated for each peer country in
aggregate and by sex. Age specific probabilities of death
in 2020 (qx), for ages 0-1, 1-4, 5-9, . . . 90-94, 95-99,
≥100, were estimated separately for men and women
in the US and for men and women in specific race and
12. ethnic group populations by multiplying 2018 mx
28
by the 2020-18 rate ratio estimates derived from data
from the National Center for Health Statistics and US
Census Bureau, and calculating qx=(mx×n)/(1+mx×ax),
where qx is the age specific probability of death, mx is
the age specific mortality rate, n is the width of the age
interval, and ax is the age specific person years lived
by the deceased.34 Probabilities of death for each peer
country in 2020 were estimated by multiplying qx in
the Human Mortality Database life tables by the 2020-
18 rate ratios in the Human Mortality Database Short
Term Mortality Fluctuations data.
We used Python (version 3.9.1) to simulate 50 000
five year abridged 2020 life tables for each US
subpopulation, with the estimated qx for 2020, ax
derived from 2018 official life tables,28 and random
10% error in the qx estimate. For each peer country
population, 50 000 five year abridged 2020 life tables
were simulated with the estimated 2020 qx and 2018
ax values in the Human Mortality Database 2018 life
tables, and random 10% error in the qx estimate. We
present median estimates of 2020 life expectancy at
birth and at ages 25 and 65; fifth and 95th centiles are
presented in the tables. The supplementary material
provides further details on methods.
Patient and public involvement
Involving patients or the public in the design, conduct,
reporting, or dissemination plans of our research was
not possible because of the urgency of the analysis and
its focus on decedents.
Results
13. United States
After a small increase of 0.08 years between 2010 and
2018, life expectancy in the US at birth decreased by
an estimated 1.87 years (or 2.4%) between 2018 and
2020 (fig 1 and supplementary fig 1). The proportional
decrease in life expectancy at ages 25 and 65 was even
greater (3.4% and 5.7%, respectively) (table 1). US
men had a larger decrease in overall life expectancy
than women, in both absolute (2.16 years v 1.50 years)
and relative (2.8% v 1.8%) terms.
Between 2018 and 2020, life expectancy in the
US decreased disproportionately among Black
and Hispanic populations (table 2). In the Black
population, life expectancy decreased by 3.25 years
(4.4%), 2.4 times the decrease in the White population
(1.36 years, 1.7%), with larger reductions in men
(3.56 years, 5.0%) than women (2.65 years, 3.4%).
In 2020, life expectancy in Black men was only 67.73
years. The decrease in life expectancy among Hispanic
individuals was even larger (3.88 years, 4.7%),
2.9 times the decrease in White people, with larger
reductions in men (4.58 years, 5.8%) than women
(2.94 years, 3.5%).
The disproportionate decrease in life expectancy
in the US Black population during 2018-20 reversed
years of progress in reducing the gap in mortality
between Black and White populations. Although
the gap in life expectancy between Black and White
populations decreased from 4.02 years in 2010 to 3.54
years in 2014, the gap increased to 3.92 years in 2018,
and to 5.81 years in 2020. Historically, the US Hispanic
population has had a longer life expectancy than
the White population.35 36 Although that advantage
14. widened between 2010 and 2017, from 2.91 years to
3.30 years, the gap decreased to 3.20 years in 2018
and then decreased sharply to 0.68 years in 2020
(table 2); the advantage reversed entirely in Hispanic
men (from 2.88 years in 2018 to −0.20 years in 2020).
United States versus peer countries
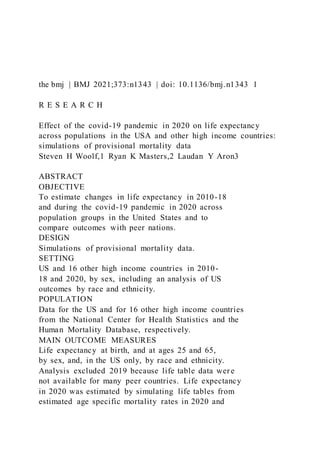
Figure 1 presents estimates of life expectancy for
2010-18 and 2020 for the US and the average for
16 high income countries. The US began the decade
with a 1.88 year deficit in life expectancy relative to
peer countries. This gap increased over the decade,
reaching 3.05 years in 2018. Between 2018 and 2020,
the gap widened substantially to 4.69 years: the 1.87
year decrease in life expectancy in the US was 8.5 times
the average decrease in peer countries (0.22 years).
Table 3 presents the estimates of life expectancy for
peer countries at birth, and at ages 25 and 65 in 2010,
2018, and 2020.
Changes in life expectancy varied substantially
across peer countries. Six countries (Denmark, Finland,
New Zealand, Norway, South Korea, and Taiwan) had
increases in life expectancy between 2018 and 2020.
Among the other 10 peer countries, decreases in life
expectancy ranged from 0.12 years in Sweden to 1.09
years in Spain, but none approached the 1.87 year loss
seen in the US.
Figure 2 (and supplementary fig 2) contrasts changes
in life expectancy in the US in 2010-18 and 2018-20
with those of peer countries, based on sex, and on
race and ethnicity. Figure 3 (and supplementary fig
3) shows how these changes contributed to the gap
between the US and peer countries. For example, figure
2 shows that life expectancy for US women increased
15. by 0.21 years in 2010-18, but because life expectancy
in women in the peer countries increased even more
(0.98 years), the gap increased by 0.77 years (fig 3).
The gap increased by another 1.36 years during 2018-
20, largely because of the pandemic. Overall, the
gap between the US and peer countries for women
R E S E A R C H
4 doi: 10.1136/bmj.n1343 | BMJ 2021;373:n1343 | the bmj
increased by 2.14 years (fig 3), from 1.97 years in 2010
(81.04 v 83.01 years) to 4.11 years (79.75 v 83.86
years) in 2020 (table 1 and table 3). The gap between
the US and peer countries for men increased even more
(3.37 years) (fig 3). In 2020, life expectancy for US men
was 5.27 years (74.06 v 79.33 years) shorter than the
peer country average for men.
The demographic composition and ethnic inequities
of peer countries varied considerably, making it
difficult to identify analogous reference populations
to compare with the US racial and ethnic groups. But
the peer country average provides a useful benchmark
for showing the disproportionately large decreases
in life expectancy in Black and Hispanic populations
in the US (fig 1, fig 2, and fig 3). For example, among
Black men and women in the US, the decrease in life
expectancy between 2018 and 2020 was 12.3 times
and 20.3 times greater, respectively, than the average
decrease for men and women in peer countries. The
corresponding values were even larger for the Hispanic
population in the US, with estimated declines in life
16. expectancy 15.9 times and 22.5 times higher among
men and women, respectively, compared with their
counterparts in peer countries.
Discussion
Long before covid-19, the US was at a disadvantage
relative to other high income nations in terms of health
and survival.6 37-41 In 2013, a report by the National
Research Council and Institute of Medicine showed that
from the 1980s, the US had higher rates of morbidity
and mortality for multiple conditions relative to other
high income countries.6 A recent report by the National
Academies of Sciences, Engineering, and Medicine
found that this gap widened further through 2017
and that the greatest relative increase in mortality
in the US occurred in young and middle aged adults
(aged 25-64). Increased mortality in this age group
was largely because of deaths from drug use, suicide,
cardiometabolic diseases, and other chronic illnesses
and injuries.42 Between 2014 and 2017, whereas life
expectancy continued to increase in other countries,
life expectancy in the US decreased by 0.3 years,7 a
three year decline that generated considerable public
concern43 but is now overshadowed by the large 2020
declines reported here. Even countries with much lower
per capita incomes outperform the US.44-47 According
to data for 36 member countries of the Organization for
Economic Cooperation and Development (OECD), the
gap in life expectancy between the US and the OECD
average increased from 0.9 to 2.2 years between 2010
and 2017.48 49
This study shows that the gap in life expectancy in
the US increased markedly between 2018 and 2020.
The decrease in life expectancy in the US was 8.5 times
the average loss seen in 16 high income peer nations
17. and the largest decrease since 1943 during the second
world war.50 The conditions that produced a US health
disadvantage before the arrival of covid-19 are still
in place, but the predominant cause for this large
decline was the covid-19 pandemic: in 2020, all cause
mortality in the US increased by 23%.12
We found large differences in the reductions in life
expectancy during the covid-19 pandemic based on
race and ethnicity. Decreases in life expectancy among
Black and Hispanic men and women were about two
to three times greater than in White people, and far
larger than those in peer countries. Decreases in life
expectancy of US Black and Hispanic men were 12-
16 times greater than those in men from other high
income countries. Corresponding decreases in life
Year
Year
L
if
e
e
xp
e
ct
an
cy
a
19. cy
(y
e
ar
s)
0
2
3
5
4
1
2010 2011 2012 2013 2014 2015 2016 2017 2018 2020
1.88
2.11 2.08
2.36 2.57
2.69
2.95 3.11 3.05
4.69
Peer countries ±1 standard deviation
Observed
20. *Gap in life expectany between US and peer countries (years)
US total
US Hispanic
US non-Hispanic White
US non-Hispanic Black
Estimated
Decrease
between
2018 and
2020
1.88 year gap*
-3.88
-1.36
-3.25
Fig 1 | Life expectancy at birth in the United States, by race and
ethnicity, and in
peer countries, for years 2010-18 and 2020. Data obtained from
the National Center
for Health Statistics, US Census Bureau, and Human Mortality
Database. Data for
2019 could not be calculated because life table data were
unavailable for many peer
countries
Table 1 | Life expectancy in the United States at birth, and at
ages 25 and 65, by sex, for
years 2010, 2018, and 2020
21. Life expectancy (years) Change in life expectancy (years, P5,
P95)
2010 2018 2020 (years, P5, P95) 2018 v 2010 2020 v 2018
Life expectancy at birth
Total 78.66 78.74 76.87 (76.70 to 77.04) 0.08 −1.87 (−2.04 to
−1.70)
Women 81.04 81.25 79.75 (79.59 to 79.92) 0.21 −1.50 (−1.66 to
−1.33)
Men 76.20 76.22 74.06 (73.88 to 74.24) 0.02 −2.16 (−2.34 to
−1.98)
Life expectancy at age 25
Total 54.71 54.76 52.91 (52.74 to 53.09) 0.05 −1.84 (−2.02 to
−1.67)
Women 56.87 57.04 55.54 (55.37 to 55.71) 0.17 −1.51 (−1.67 to
−1.34)
Men 52.44 52.43 50.32 (50.14 to 50.50) −0.01 −2.12 (−2.29 to
−1.93)
Life expectancy at age 65
Total 19.13 19.47 18.37 (18.19 to 18.55) 0.34 −1.11 (−1.28 to
−0.93)
Women 20.33 20.69 19.67 (19.50 to 19.84) 0.36 −1.02 (−1.19 to
−0.85)
Men 17.70 18.10 16.93 (16.75 to 17.12) 0.40 −1.16 (−1.34 to
−0.98)
P5, P95=5th and 95th centiles of 50 000 simulated life
expectancies with 10% random uncertainty around the
estimated probability of death for 2020.
Data derived from the National Center for Health Statistics, US
Census Bureau, and Human Mortality Database.
Sums might differ from text because of rounding.
R E S E A R C H
22. the bmj | BMJ 2021;373:n1343 | doi: 10.1136/bmj.n1343 5
expectancy among US Black and Hispanic women
were 20-23 times greater than those for women in peer
countries. Progress made between 2010 and 2018 in
reducing the gap in life expectancy between Black and
White populations in the US was erased between 2018
and 2020. Life expectancy in Black men fell to 67.73
years, a level not seen since 1998.51 The US Hispanic
life expectancy advantage was erased in men and
nearly disappeared in women.
Strengths and limitations of this study
Our study estimated the effect of the covid-19
pandemic on life expectancy in the US for 2020, and
compared life expectancy in the US with other high
income countries. The study used a new method for
these calculations, detailed in the supplementary
appendix. The study also had several limitations.
First, life expectancies for 2020 were simulated with
preliminary mortality data, which are subject to errors
(eg, undercounting, and mismatching between death
and population counts) and often vary across racial and
ethnic populations and countries. Second, the 2020 qx
values used to generate life tables for peer populations
could have been biased by the wide age ranges used
in the Human Mortality Database Short Term Mortality
Fluctuations files. Third, definitions for peer countries
vary; our list differs from the 16 high income countries
used in several cross national comparisons.6 37 38 Five
large high income democracies (Australia, Canada,
Germany, Italy, and Japan) were excluded because of
incomplete data. Fourth, we compared life expectancy
in 2020 with 2018 values; the effect of the pandemic
23. would be better determined by comparisons with life
expectancy in 2019, but data for many peer countries
were unavailable for this calculation Fifth, for reasons
explained in the supplementary material, data on
race and ethnicity for the US population and for 2020
deaths were incomplete,52 likely underestimating
racial inequalities. Reports suggest that covid-19 and
all cause mortality in 2020 were very high in American
Table 2 | Life expectancy in the United States at birth, and at
ages 25 and 65, by sex, race, and ethnicity, for years 2010,
2018, and 2020
Life expectancy (years) Change in life expectancy (years, P5,
P95)
2010 2018 2020 (P5, P95) 2018 v 2010 2020 v 2018
Life expectancy at birth
Total
Hispanic 81.68 81.83 77.95 (77.78 to 78.12) 0.15 −3.88 (−4.05
to −3.71)
Non-Hispanic Black 74.75 74.71 71.46 (71.27 to 71.65) −0.04
−3.25 (−3.44 to −3.06)
Non-Hispanic White 78.76 78.63 77.27 (77.10 to 77.44) −0.13
−1.36 (−1.53 to −1.19)
Women
Hispanic 84.26 84.32 81.38 (81.22 to 81.54) 0.06 −2.94 (−3.10
to −2.78)
Non-Hispanic Black 77.70 77.99 75.34 (75.16 to 75.52) 0.29
−2.65 (−2.83 to −2.47)
Non-Hispanic White 81.12 81.10 79.99 (79.83 to 80.16) −0.02
−1.11 (−1.27 to −0.94)
Men
Hispanic 78.84 79.08 74.50 (74.33 to 74.68) 0.24 −4.58 (−4.75
to −4.40)
Non-Hispanic Black 71.51 71.29 67.73 (67.54 to 67.93) −0.22
24. −3.56 (−3.75 to −3.36)
Non-Hispanic White 76.35 76.20 74.70 (74.52 to 74.87) −0.15
−1.50 (−1.68 to −1.33)
Life expectancy at age 25
Total
Hispanic 57.57 57.71 53.85 (53.68 to 54.03) 0.14 −3.86 (−4.03
to −3.68)
Non-Hispanic Black 51.42 51.43 48.34 (48.15 to 48.53) 0.01
−3.09 (−3.28 to −2.90)
Non-Hispanic White 54.72 54.54 53.16 (52,99 to 53.33) −0.18
−1.38 (−1.55 to −1.21)
Women
Hispanic 59.97 60.06 57.12 (56.96 to 57.29) 0.09 −2.94 (−3.10
to −2.77)
Non-Hispanic Black 54.00 54.28 51.69 (51.51 to 51.87) 0.28
−2.59 (−2.77 to −2.41)
Non-Hispanic White 56.86 56.80 55.66 (55.49 to 55.82) −0.06
−1.14 (−1.31 to −0.98)
Men
Hispanic 54.88 55.11 50.62 (50.44 to 50.80) 0.23 −4.49 (−4.67
to −4.31)
Non-Hispanic Black 48.47 48.33 44.99 (44.79 to 45.19) −0.14
−3.34 (−3.54 to −3.14)
Non-Hispanic White 52.50 52.29 50.77 (50.59 to 50.95) −0.21
−1.52 (−1.70 to −1.34)
Life expectancy at age 65
Total
Hispanic 21.15 21.44 18.85 (18.67 to 19.03) 0.29 −2.59 (−2.77
to −2.41)
Non-Hispanic Black 17.71 18.02 16.13 (15.93 to 16.32) 0.31
−1.89 (−2.09 to −1.70)
Non-Hispanic White 19.11 19.38 18.50 (18.33 to 18.68) 0.27
−0.88 (−1.05 to −0.70)
Women
Hispanic 22.62 22.70 20.54 (20.38 to 20.72) 0.08 −2.16 (−2.32
to −1.98)
25. Non-Hispanic Black 19.15 19.52 17.76 (17.57 to 17.94) 0.37
−1.76 (−1.95 to −1.58)
Non-Hispanic White 20.28 20.58 19.77 (19.60 to 19.94) 0.30
−0.81 (−0.98 to −0.64)
Men
Hispanic 19.23 19.73 16.86 (16.68 to 17.05) 0.50 −2.87 (−3.05
to −2.68)
Non-Hispanic Black 15.79 16.11 14.24 (14.04 to 14.44) 0.32
−1.87 (−2.07 to −1.67)
Non-Hispanic White 17.72 18.06 17.16 (16.98 to 17.34) 0.34
−0.90 (−1.08 to −0.72)
P5, P95=5
th and 95th centiles of 50 000 simulated life expectancies with
10% random uncertainty around the estimated probability of
death for 2020.
Data derived from the National Center for Health Statistics, US
Census Bureau, and Human Mortality Database. Sums might
differ from text because of
rounding.
R E S E A R C H
6 doi: 10.1136/bmj.n1343 | BMJ 2021;373:n1343 | the bmj
Indian and Alaskan Native populations.53 Finally,
we used the average for peer countries; values for
individual countries varied.
Comparisons with other studies
This study aligns closely with previous research. An
analysis of deaths between January and June 2020
found that US life expectancy decreased by 1.0 years
between 2019 and 2020, including reductions of 0.8
26. years in White people and reductions of 2.7 years
and 1.9 years in Black and Hispanic individuals,
respectively.17 Andrasfay and Goldman estimated that
life expectancy from January to mid-October 2020 was
1.1 years below expected values, including a reduction
of 0.7 years in White populations and reductions of
2.1 and 3.1 years in Black and Hispanic populations,
respectively.16 Neither study examined changes in
life expectancy in other countries or estimated life
expectancy in the US for the whole of 2020.
Policy implications
The decreases in life expectancy that we found and
the excess deaths reported in several studies of 2020
death counts9-12 could reflect the combined effects of
deaths attributed to covid-19, deaths where SARS Co-
V-2 infection was unrecognized or undocumented,
and deaths from non-covid-19 health conditions,
exacerbated by limited access to healthcare and
by widespread social and economic disruptions
produced by the pandemic (eg, unemployment, food
insecurity, and homelessness).8 54 These adverse
outcomes are products of national, state, and local
policy decisions, and actions and inactions that
influenced viral transmission and management of
the pandemic.55-60 These policies span healthcare,
public health, employment, education, and social
protection systems. Many organizations are tracking
these decisions internationally for ongoing research
and development.61-64
The large number of covid-19 deaths in the US
reflects not only the country’s policy choices and
mishandling of the pandemic55-60 but also deeply
rooted factors that have put the country at a health
27. disadvantage for decades.6 7 65 66 For much of the
public, it was the pandemic itself that drew attention
to these longstanding conditions, including major
deficiencies in the US healthcare and public health
systems, widening social and economic inequality,
and stark inequities and injustices experienced by
Black, Hispanic, Asian, and Indigenous populations
and other systematically marginalized and excluded
groups. Many studies have reported that rates of
covid-19 infections, admissions to hospital, and
deaths are substantially higher in Black and Hispanic
populations compared with White people, because of
greater exposure to the virus, a higher prevalence of
comorbid conditions (eg, diabetes), and reduced access
to healthcare and other protective resources.67 68
Evidence of disproportionate reductions in life
expectancy among racial and ethnic groups in the US,
such as the disparities reported here, draws attention
to the root causes of racial inequities in health, wealth,
and wellbeing. Foremost among these root causes is
systemic racism; extensive research has shown that
systems of power in the US structure opportunity
and assign value in ways that unfairly disadvantage
Black, Hispanic, Asian, and Indigenous populations,
and unfairly advantage White people.69-75 Many of
the same factors placed these populations at greater
risk from covid-19.13-15 76-80 The higher prevalence of
comorbid conditions in many racial or marginalized
Table 3 | Average life expectancy in peer countries at birth, and
at ages 25 and 65, by
sex, for years 2010, 2018, and 2020
Life expectancy (years) Change in life expectancy (years, P5,
P95)
28. 2010 2018 2020 (P5, P95) 2018 v 2010 2020 v 2018
Life expectancy at birth
Total 80.54 81.78 81.56 (81.40 to 81.71) 1.24 −0.22 (−0.38 to
−0.07)
Women 83.01 83.99 83.86 (83.71 to 84.01) 0.98 −0.13 (−0.28 to
0.02)
Men 78.10 79.62 79.33 (79.17 to 79.49) 1.52 −0.29 (−0.45 to
−0.13)
Life expectancy at age 25
Total 56.21 57.35 57.08 (56.93 to 57.24) 1.14 −0.27 (−0.42 to
−0.11)
Women 58.56 59.47 59.29 (59.14 to 59.44) 0.91 −0.18 (−0.33 to
−0.03)
Men 53.86 55.26 54.94 (54.78 to 55.10) 1.40 −0.32 (−0.48 to
−0.16)
Life expectancy at age 65
Total 19.53 20.31 20.05 (19.89 to 20.21) 0.78 −0.26 (−0.42 to
−0.10)
Women 21.00 21.69 21.50 (21.35 to 21.66) 0.69 −0.19 (−0.34 to
0.03)
Men 17.88 18.82 18.53 (18.36 to 18.69) 0.94 −0.29 (−0.46 to
−0.13)
P5, P95=5th and 95th percentiles of 50 000 simulated life
expectancies with 10% random uncertainty around the
estimated probability of death for 2020.
Data derived from the National Center for Health Statistics, US
Census Bureau, and Human Mortality Database.
Sums might differ from text because of rounding.
2010-18 2018-20Women
Change in life expectancy
C
h
32. US non-
Hispanic
Black
US non-
Hispanic
White
1.52
0.02 0.24
-0.22
-0.15-0.29
-2.16
-4.58
-3.56
-1.50
Fig 2 | Changes in life expectancy at birth in US populations
and peer country average,
for years 2010-18 and 2018-20. For example, life expectancy in
the US for women
increased by 0.21 years in 2010-18 and then decreased by 1.50
years in 2018-20. Data
derived from the National Center for Health Statistics, US
Census Bureau, and Human
Mortality Database
33. R E S E A R C H
the bmj | BMJ 2021;373:n1343 | doi: 10.1136/bmj.n1343 7
groups is a reflection of unequal access to the social
determinants of health (eg, education, income, and
justice) and not their race, ethnicity, or other socially
determined constructs. Low income communities and
women have also been disproportionately affected by
the social, familial, and economic disruptions of the
pandemic.81 82 Reduced access to covid-19 vaccines,
and vaccine hesitancy rooted in a community’s
distrust of systems that have mistreated them, might
exacerbate these disparities. Structural factors affect
not only Black and Hispanic populations but other
marginalized people and places. American Indians
and Alaskan Natives, for example, have some of the
worst health outcomes of any group in the US, but data
limitations precluded separate calculations for these
important populations.
Conclusions
The mortality outcomes examined in this study, in the
research literature, and in the daily news represent
only part of the burden of covid-19; for every death,
a larger number of infected individuals experience
acute illness, and many face long term health and life
complications.83 Whether some of these long term
complications will affect how quickly life expectancy
in the US will rebound in the coming years is unclear.
Morbidity and mortality during the pandemic have
wider effects on families, neighborhoods, and
communities. One study estimated that each death
leaves behind an average of nine bereaved family
34. members.84 The pandemic will have short and long
term effects on the social determinants of health,
changing living conditions in many communities,
and altering life course trajectories across age groups.
Fully understanding the health consequences of these
changes poses a daunting but important challenge for
future research.
We thank Steven Martin, Urban Institute, for reviewing our
methodology; Cassandra Ellison, art director for the Virginia
Commonwealth University Center on Society and Health, for
her
assistance with graphic design; and Catherine Talbot,
University of
Colorado Boulder, for her advice with Python simulations.
These
individuals received no compensation beyond their salaries.
Contributors: SHW led the production of this manuscript and
had primary responsibility for the composition. He is guarantor.
RKM contributed revisions and had primary responsibility for
data
acquisition and analysis, the modeling results that form the
basis
for this study, and production of the supplementary material.
LYA
contributed revisions and had primary responsibility for dealing
with the study’s policy implications in the discussion section.
The
corresponding author attests that all listed authors meet
authorship
criteria and that no others meeting the criteria have been
omitted.
Funding: SHW received partial funding from grant
UL1TR002649
from the National Center for Advancing Translational Sciences.
RKM
received support from the University of Colorado Population
35. Center
grant from the Eunice Kennedy Shriver Institute of Child Health
and
Human Development (CUPC project 2P2CHD066613-06). There
was
no specific funding for this study.
Competing interests: All authors have completed the ICMJE
uniform
disclosure form at www.icmje.org/coi_disclosure.pdf and
declare: no
support from any organization for the submitted work; no
financial
relationships with any organizations that might have an interest
in the
submitted work in the previous three years; and no other
relationships
or activities that could appear to have influenced the submitted
work.
The lead author (SHW) affirms that the manuscript is an honest,
accurate, and transparent account of the study being reported;
that
no important aspects of the study have been omitted; and that
any
discrepancies from the study as planned have been explained.
Dissemination to participants and related patient and public
communities: Print, broadcast, and social medial will be used to
disseminate the results of this study to journalists and the
public,
and summaries will be shared with policy makers, social justice
organizations, and other relevant stakeholders.
Provenance and peer review: Not commissioned; externally peer
reviewed.
Ethical approval: Not required.
Data sharing: Requests for additional data and analytic scripts
used
in this study should be emailed to RKM ([email protected]).
36. This is an Open Access article distributed in accordance with
the
Creative Commons Attribution Non Commercial (CC BY-NC
4.0) license,
which permits others to distribute, remix, adapt, build upon this
work
non-commercially, and license their derivative works on
different
terms, provided the original work is properly cited and the use
is non-
commercial. See: http://creativecommons.org/licenses/by-
nc/4.0/.
1 Woolf SH, Chapman DA, Lee JH. COVID-19 as the leading
cause of
death in the United States. JAMA 2021;325:123-4.
2 Riley JC. Rising Life Expectancy: A Global History .
Cambridge
University Press, 2001. doi:10.1017/CBO9781316036495.
3 Preston S, Heuveline P, Guillot M. Demography: Measuring
and
Modeling Population Processes. Blackwell Publishers, 2001.
4 Almond D. Is the 1918 influenza pandemic over? Long-term
effects
of in utero influenza exposure in the post-1940 US population. J
Polit
Econ 2006;114:672-712. doi:10.1086/507154.
5 Dong E, Du H, Gardner L. An interactive web-based
dashboard
to track COVID-19 in real time. Lancet Infect Dis 2020;20:533-
4.
doi:10.1016/S1473-3099(20)30120-1.
37. 6 Woolf SH, Aron L, eds. U.S. Health in International
Perspective: Shorter
Lives, Poorer Health. Panel on Understanding Cross-National
Health
Differences Among High-Income Countries. National Research
Council,
Committee on Population, Division of Behavioral and Social
Sciences
and Education, and Board on Population Health and Public
Health
Practice, Institute of Medicine. National Academies Press,
2013.
2010-18 2018-20Women
In
cr
e
as
e
in
g
ap
in
li
fe
e
xp
e
43. 1.00
3.27
5.01
1.74
1.22
2.89
1.671.28
4.29
Fig 3 | Increasing gap in life expectancy between the United
States and peer country
average, for years 2010-18 and 2018-20. For example, the gap
between life expectancy
for men in the US men and the average life expectancy for men
in peer countries
increased by 1.50 years in 2010-18 and by a further 1.87 years
in 2018-20. Data
derived from the National Center for Health Statistics, US
Census Bureau, and Human
Mortality Database. Sums might differ because of rounding
http://www.icmje.org/coi_disclosure.pdf
http://creativecommons.org/licenses/by-nc/4.0/
R E S E A R C H
8 doi: 10.1136/bmj.n1343 | BMJ 2021;373:n1343 | the bmj
44. 7 Woolf SH, Schoomaker H. Life expectancy and mortality
rates in
the United States, 1959-2017. JAMA 2019;322:1996-2016.
doi:10.1001/jama.2019.16932
8 Matthay EC, Duchowny KA, Riley AR, Galea S. Projected
all-cause
deaths attributable to COVID-19-related unemployment in the
United States. Am J Public Health 2021;111:696-9. doi:10.2105/
AJPH.2020.306095
9 Woolf SH, Chapman DA, Sabo RT, Weinberger DM, Hill L.
Excess
deaths from COVID-19 and other causes, March-April 2020.
JAMA 2020;324:510-3. doi:10.1001/jama.2020.11787
10 Weinberger DM, Chen J, Cohen T, et al. Estimation of
excess deaths
associated with the COVID-19 pandemic in the United States,
March
to May 2020. JAMA Intern Med 2020;180:1336-44.
doi:10.1001/
jamainternmed.2020.3391
11 Woolf SH, Chapman DA, Sabo RT, Weinberger DM, Hill L,
Taylor DDH.
Excess deaths from COVID-19 and other causes, March-July
2020.
JAMA 2020;324:1562-4. doi:10.1001/jama.2020.19545
12 Woolf SH, Chapman DA, Sabo RT, Zimmerman EB. Excess
deaths from
COVID-19 and other causes in the US, March 1, 2020, to
January 2,
2021. JAMA 2021. doi:10.1001/jama.2021.5199
45. 13 Rossen LM, Branum AM, Ahmad FB, Sutton P, Anderson
RN. Excess
deaths associated with COVID-19, by age and race and
ethnicity.
United States, January 26-October 3, 2020. MMWR Morb
Mortal Wkly
Rep 2020;69:1522-27.
14 Jacobson SH, Jokela JA. Non-COVID-19 excess deaths by
age and
gender in the United States during the first three months of the
COVID-19 pandemic. Public Health 2020;189:101-3.
doi:10.1016/j.
puhe.2020.10.004
15 Centers for Disease Control and Prevention. Risk for
COVID-19
Infection, Hospitalization, and Death By Race/Ethnicity. 2021.
https://www.cdc.gov/coronavirus/2019-ncov/covid-data/
investigations-discovery/hospitalization-death-by-race-
ethnicity.html
16 Andrasfay T, Goldman N. Reductions in 2020 US life
expectancy due to COVID-19 and the disproportionate impact
on the Black and Latino populations. Proc Natl Acad Sci U S
A 2021;118:e2014746118. doi:10.1073/pnas.2014746118
17 Arias E, Tejada-Vera B, Ahmad F. Provisional life
expectancy estimates
for January through June, 2020. Vital Statistics Rapid Release;
no
10. Hyattsville, MD: National Center for Health Statistics.
2021.
doi:10.15620/cdc:100392.
46. 18 Kochanek KD, Xu JQ, Arias E. Mortality in the United
States, 2019.
NCHS Data Brief, no 395. National Center for Health Statistics,
2020.
19 Flanagin A, Frey T, Christiansen SL, Bauchner H. The
Reporting of Race
and Ethnicity in Medical and Science Journals: Comments
Invited.
JAMA 2021;325:1049-52. doi:10.1001/jama.2021.2104
20 Arias E. United States life tables, 2010. Natl Vital Stat
Rep 2014;63:1-63.
21 Arias E. United States life tables, 2011. Natl Vital Stat
Rep 2015;64:1-63.
22 Arias E, Heron M, Xu J. United States life tables, 2012.
Natl Vital Stat
Rep 2016;65:1-65.
23 Arias E, Heron M, Xu J. United States life tables, 2013.
Natl Vital Stat
Rep 2017;66:1-64.
24 Arias E, Heron M, Xu J. United States life tables, 2014.
Natl Vital Stat
Rep 2017;66:1-64.
25 Arias E, Xu J. United States life tables, 2015. Natl Vital
Stat
Rep 2018;67:1-64.
26 Arias E, Xu J, Kochanek KD. United States life tables,
2016. Natl Vital
Stat Rep 2019;68:1-66.
47. 27 Arias E. United States Life Tables, 2017. Natl Vital Stat
Rep 2019;68:1-66.
28 Arias E, Xu J. United States life tables, 2018. Natl Vital
Stat
Rep 2020;69:1-45.
29 HealthData.gov. AH Excess Deaths by Sex, Age, and Race.
2021.
https://data.cdc.gov/NCHS/AH-Excess-Deaths-by-Sex-Age-and-
Race/
m74n-4hbs
30 US Census Bureau. 2019 Population Estimates by Age, Sex,
Race and
Hispanic Origin. 2020.
https://www.census.gov/newsroom/press-
kits/2020/population-estimates-detailed.html
31 University of California, Berkeley and Max Planck Institute
for
Demographic Research. Human Mortality Database.
https://www.
mortality.org/
32 State of Israel. Complete Life Tables of Israel, 2014-2018.
2020.
https://www.cbs.gov.il/en/publications/Pages/2020/Complete-
Life-
Tables-Of%20Israel-2014-2018.aspx
33 New Zealand Government. National and subnational period
life
tables: 2017-2019. 2021. https://www.stats.govt.nz/information-
releases/national-and-subnational-period-life-tables-2017-2019.
48. 34 Preston S, Heuveline P, Guillot M. Demography: Measuring
and
Modeling Population Processes. Blackwell Publishers, 2001.
35 Ruiz JM, Steffen P, Smith TB. Hispanic mortality paradox:
a systematic
review and meta-analysis of the longitudinal literature. Am J
Public
Health 2013;103:e52-60. doi:10.2105/AJPH.2012.301103
36 Chen Y, Freedman ND, Rodriquez EJ, et al. Trends in
premature
deaths among adults in the United States and Latin America.
JAMA Netw Open 2020;3:e1921085. doi:10.1001/
jamanetworkopen.2019.21085
37 Crimmins EM, Preston SH, Cohen B. Explaining Divergent
Levels of
Longevity in High-Income Countries . National Academies
Press,
2011.
38 Ho JY. Mortality under age 50 accounts for much of the fact
that US
life expectancy lags that of other high-income countries. Health
Aff
(Millwood) 2013;32:459-67. doi:10.1377/hlthaff.2012.0574
39 Ho JY, Hendi AS. Recent trends in life expectancy across
high income
countries: retrospective observational study.
BMJ 2018;362:k2562.
doi:10.1136/bmj.k2562
49. 40 Emanuel EJ, Gudbranson E, Van Parys J, Gørtz M,
Helgeland J, Skinner
J. Comparing Health Outcomes of Privileged US Citizens With
Those
of Average Residents of Other Developed Countries. JAMA
Intern
Med 2021;181:339-44. doi:10.1001/jamainternmed.2020.7484.
41 Preston SH, Vierboom YC. Excess mortality in the United
States in the
21st century. Proc Natl Acad Sci U S A 2021;118:e2024850118.
doi:10.1073/pnas.2024850118
42 National Academies of Sciences, Engineering, and
Medicine. High
and Rising Mortality Rates Among Working-Age
Adults. National
Academies Press, 2021. doi:10.17226/25976.
43 Bernstein L. Life expectancy declines again, a dismal trend
not seen since World War I. Washington Post 2018. https://
www.washingtonpost.com/national/healthscience/us-life-
expectancy-declines-again-adismal-trend-not-seen-since-
world-war-i/2018/11/28/ae58bc8c-f28c-11e8-bc79-
68604ed88993story.html.
44 Avendano M, Kawachi I. Why do Americans have shorter
life
expectancy and worse health than do people in other high-
income
countries?Annu Rev Public Health 2014;35:307-25.
doi:10.1146/
annurev-publhealth-032013-182411
45 GBD 2017 Mortality Collaborators. Global, regional, and
national
50. age-sex-specific mortality and life expectancy, 1950-2017:
a systematic analysis for the Global Burden of Disease Study
2017. Lancet 2018;392:1684-735. doi:10.1016/S0140-
6736(18)31891-9
46 GBD 2017 DALYs and HALE Collaborators. Global,
regional, and
national disability-adjusted life-years (DALYs) for 359 diseases
and
injuries and healthy life expectancy (HALE) for 195 countries
and
territories, 1990-2017: a systematic analysis for the Global
Burden
of Disease Study 2017. Lancet 2018;392:1859-922. doi:10.1016/
S0140-6736(18)32335-3
47 Foreman KJ, Marquez N, Dolgert A, et al. Forecasting life
expectancy,
years of life lost, and all-cause and cause-specific mortality for
250
causes of death: reference and alternative scenarios for 2016-40
for 195 countries and territories. Lancet 2018;392:2052-90.
doi:10.1016/S0140-6736(18)31694-5
48 OECD Family Database. CO1.2: Life expectancy at birth.
https://www.
oecd.org/els/family/CO_1_2_Life_expectancy_at_birth.pdf
49 OECD.Stat. Health status. 2021.
https://stats.oecd.org/Index.
aspx?DataSetCode=HEALTH_STAT
50 National Center for Health Statistics. Life Tables. Vital
Statistics of the
United States, 1970; volume 11; section 5. https://www.cdc.gov/
nchs/data/lifetables/life70.pdf.
51. 51 Arias E. United States life tables, 2002. National Vital
Statistics
Reports; vol 53 no 6. National Center for Health Statistics,
2004;
volume 53, No 6.
52 Krieger N, Testa C, Hanage WP, Chen JT. US racial and
ethnic data
for COVID-19 cases: still missing in action.
Lancet 2020;396:e81.
doi:10.1016/S0140-6736(20)32220-0
53 APM Research Lab. The Color of Coronavirus: COVID-19
Deaths by
Race and Ethnicity in the US. 2021.
https://www.apmresearchlab.
org/covid/deaths-by-race
54 Kiang MV, Irizarry RA, Buckee CO, Balsari S. Every body
counts:
measuring mortality from the COVID-19 pandemic. Ann Intern
Med 2020;173:1004-7. doi:10.7326/M20-3100
55 Council on Foreign Relations. Improving Pandemic
Preparedness:
Lessons From COVID-19. Independent Task Force Report No
78.
Council on Foreign Relations, 2020.
56 Hanage WP, Testa C, Chen JT, et al. COVID-19: US federal
accountability for entry, spread, and inequities-lessons for the
future.
Eur J Epidemiol 2020;35:995-1006. doi:10.1007/s10654-020-
00689-2
52. 57 Altman D. Understanding the US failure on coronavirus-an
essay by
Drew Altman. BMJ 2020;370:m3417. doi:10.1136/bmj.m3417
58 Shokoohi M, Osooli M, Stranges S. COVID-19 pandemic:
what can the
West learn from the East?Int J Health Policy
Manag 2020;9:436-8.
doi:10.34172/ijhpm.2020.85
59 Yong E. How the pandemic defeated America.
Atlantic 2020;4.
60 Parker R. Why America’s response to the COVID-19
pandemic failed:
lessons from New Zealand’s success. Adm Law
Rev 2021;73:77-103.
61 WHO Regional Office for Europe, European Commission,
European
Observatory on Health Systems and Policies. COVID-19 Health
System Response Monitor.
https://www.covid19healthsystem.org/
mainpage.aspx
https://www.cdc.gov/coronavirus/2019-ncov/covid-
data/investigations-discovery/hospitalization-death-by-race-
ethnicity.html
https://www.cdc.gov/coronavirus/2019-ncov/covid-
data/investigations-discovery/hospitalization-death-by-race-
ethnicity.html
https://data.cdc.gov/NCHS/AH-Excess-Deaths-by-Sex-Age-and-
Race/m74n-4hbs
https://data.cdc.gov/NCHS/AH-Excess-Deaths-by-Sex-Age-and-
Race/m74n-4hbs
https://www.census.gov/newsroom/press-kits/2020/population-
55. 66 Preston S, Vierboom Y. Why do Americans die earlier than
Europeans?
The Guardian, May 4 2021.
67 Bassett MT, Chen JT, Krieger N. Variation in racial/ethnic
disparities
in COVID-19 mortality by age in the United States: A cross-
sectional
study. PLoS Med 2020;17:e1003402. doi:10.1371/journal.
pmed.1003402
68 Lopez L3rd, Hart LH3rd, Katz MH. Racial and Ethnic
Health Disparities
Related to COVID-19. JAMA 2021;325:719-20. doi:10.1001/
jama.2020.26443
69 Delgado R, Stefancic J. Critical Race Theory: The Cutting
Edge. Temple
University Press, 2013.
70 Jones CP. Systems of power, axes of inequity: parallels,
intersections,
braiding the strands. Med Care 2014;52(Suppl 3):S71-5.
doi:10.1097/MLR.0000000000000216
71 Bailey ZD, Krieger N, Agénor M, Graves J, Linos N,
Bassett MT.
Structural racism and health inequities in the USA: evidence
and
interventions. Lancet 2017;389:1453-63. doi:10.1016/S0140-
6736(17)30569-X
72 Malat J, Mayorga-Gallo S, Williams DR. The effects of
whiteness on
the health of whites in the USA. Soc Sci Med 2018;199:148-56.
doi:10.1016/j.socscimed.2017.06.034
56. 73 Williams DR, Lawrence JA, Davis BA. Racism and health:
evidence
and needed research. Annu Rev Public Health 2019;40:105-25.
doi:10.1146/annurev-publhealth-040218-043750
74 Benjamins MR, Silva A, Saiyed NS, De Maio FG.
Comparison
of All-Cause Mortality Rates and Inequities Between Black
and White Populations Across the 30 Most Populous US
Cities. JAMA Netw Open 2021;4:e2032086. doi:10.1001/
jamanetworkopen.2020.32086
75 Bailey ZD, Feldman JM, Bassett MT. How Structural
Racism Works -
Racist Policies as a Root Cause of U.S. Racial Health Inequitie.
N Engl
J Med 2021;384:768-73. doi:10.1056/NEJMms2025396
76 Yancy CW. COVID-19 and African Americans.
JAMA 2020;323:1891-
2. doi:10.1001/jama.2020.6548
77 Egede LE, Walker RJ. Structural racism, social risk factors,
and
Covid-19 - a dangerous convergence for Black Americans. N
Engl J
Med 2020;383:e77. doi:10.1056/NEJMp2023616
78 Tan SB, deSouza P, Raifman M. Structural racism and
COVID-19
in the USA: a county-level empirical analysis. J Racial Ethn
Health
Disparities 2021;1-11.
79 Tipirneni R. A data-informed approach to targeting social
57. determinants of health as the root causes of COVID-19
disparities. Am J Public Health 2021;111:620-2. doi:10.2105/
AJPH.2020.306085
80 Lavizzo-Mourey RJ, Besser RE, Williams DR.
Understanding and
mitigating health inequities — past, current, and future
directions. N
Engl J Med 2021;384:1681-4. doi:10.1056/NEJMp2008628
81 Krieger N, Waterman PD, Chen JT. COVID-19 and overall
mortality
inequities in the surge in death rates by Zip code
characteristics:
Massachusetts, January 1 to May 19, 2020. Am J Public
Health 2020;110:1850-2. doi:10.2105/AJPH.2020.305913
82 Allen S, Julian Z, Coyne-Beasley T, Erwin PC, Fletcher FE.
COVID-19’s
impact on women: a stakeholder-engagement approach to
increase
public awareness through virtual town halls. J Public Health
Manag
Pract 2020;26:534-8. doi:10.1097/PHH.0000000000001249
83 Rubin R. As their numbers grow, COVID-19 “long haulers”
stump
experts. JAMA 2020;324:1381-3. doi:10.1001/jama.2020.17709
84 Verdery AM, Smith-Greenaway E, Margolis R, Daw J.
Tracking the
reach of COVID-19 kin loss with a bereavement multiplier
applied to
the United States. Proc Natl Acad Sci U S A 2020;117:17695-
701.
doi:10.1073/pnas.2007476117
58. Web appendix: Supplementary material
Web figure: Supplementary figure 1
Web figure: Supplementary figure 2
Web figure: Supplementary figure 3
https://ihpme.utoronto.ca/research/research-centres-
initiatives/nao/covid19/
https://ihpme.utoronto.ca/research/research-centres-
initiatives/nao/covid19/
https://www.multistate.us/issues/covid-19-policy-tracker
https://www.multistate.us/issues/covid-19-policy-tracker
https://www.oecd.org/coronavirus/en/