Hourly Lean Introduction
•Télécharger en tant que PPT, PDF•
26 j'aime•5,969 vues

This is a little presentation we used for our hourly employees when we rolled out lean. Not attached are the real life examples we discussed as part of the training.
![Purpose ,[object Object],[object Object],[object Object],[object Object],[object Object]](data:image/gif;base64,R0lGODlhAQABAIAAAAAAAP///yH5BAEAAAAALAAAAAABAAEAAAIBRAA7)
Recommandé
Contenu connexe
Tendances
Tendances (20)
En vedette
En vedette (20)
Similaire à Hourly Lean Introduction
Similaire à Hourly Lean Introduction (20)
Dernier
Dernier (20)
Hourly Lean Introduction
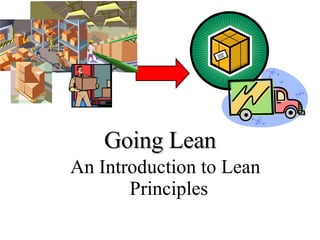
- 1. Going Lean An Introduction to Lean Principles
- 10. Inventory Hides Waste Sea of Inventory Long Transportation Communication Problems Machine Downtime Employee Availability Poor Scheduling Quality Problems Line Imbalance Long Setups Supplier issues House Keeping Employee Availability Finished Goods Raw Materials
- 11. Reducing Inventory Uncovers Opportunities to Improve Opportunities Converted into Cash!
- 12. Walking without working; searching for tools, materials or information; reaching, bending or unnecessary motion due to poor housekeeping or workplace layout Motion Double or triple handling, moving in and out of storage areas and warehouses, poor layouts, poor housekeeping Transportation Watching machines run or cycle, waiting for parts, instructions, approval, information, maintenance or decisions Waiting
- 13. A source of labor only, not seen as true process experts; do not involve in finding solutions People’s Skills Defective or scrap materials, OOS control processes, low yield, incorrect schedules, engineering documents or information Defects Repair or rework steps, extra setup steps, over-specification of the process, extra processing steps Process
- 16. A value stream is all of the value-adding activity AND all of the non-value adding activity (pure waste and incidental waste) required to provide a product/service to a customer 2. Map the Flow of Value in Our Cell Process A Process B Process C Raw Material Customer Finished Product Value Stream
- 18. 3. Make Value Flow in Our Cell Continuous Flow - Make One - Move One Batch Processing How long to make a pack of 10 units? How long to make a pack of 10 units?
- 19. 4. Establish Pull from Our Cell’s Customer(s) Okay! One more please! Customer Supplier
- 20. 5. Seek Perfection in Our Cell PDCA
- 21. Lean Tools
- 32. Recap
- 34. Lean Emphasis Resource distribution Opportunity for improvement by reducing waste and creating additional value Value Waste Initial Process Value Waste General Process Reduction Waste and Value Both Decrease Waste Only Reduction Value Waste Target & Reduce Waste Maintain Value Value Maintained Resources Decrease Value Creation Value Waste Apply Resources to Create More Value Value Increased Resources Focused
- 36. Expected Lean Results Costs Defects (99%) Inventory (10 fold) Lead Time (90%) Machine Downtime Space (50%) Capacity Customer Responsiveness Efficiency Employee Satisfaction Flexibility – Demand Flux