LOTTE Chemical-011170-Algorithm Investment Report
•
0 j'aime•76 vues

This document provides a performance analysis of an algorithm company over several time periods. It includes key financial metrics such as sales, operating profit, net income, operating rate, net rate, and more across annual and quarterly periods. It also provides the company's stock price history, comparison to industry averages, and a proposed stock purchasing algorithm and strategy. The analysis evaluates the company's performance, industry, and provides an investment opinion and proposed purchasing amounts.
![[Price for scheduled purchasing]
Arbitrarily made
Algorithm stocks Trading Strategies (consolidated) 011170 Date
Period
Gap
(Indication /
stock)
Color
2018-12-13
3 months
Current stock price Evaluation
Stock price rise
probability score
Investment opinion Prospective purchase amount
268,500 W Low price 61.0 Buy 10,000,000 W
Suggested Purchase
Amount 6,356,619 W
Number of stocks
purchased 24
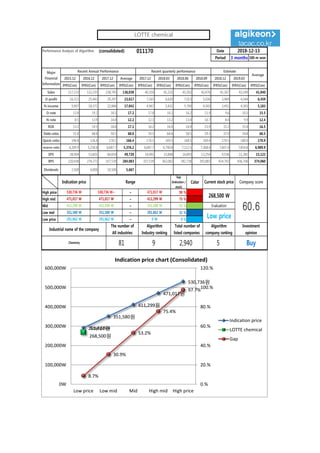
Indication price Range Buying / Selling Buying / Selling [Stocks]
High price 530,736 W 530,736 W~ ~ 471,017 W 98 % -6,208,320 W -12
High mid 471,017 W 471,017 W ~ 411,299 W 75 % -4,794,511 W -10
Mid 411,299 W 411,299 W ~ 351,580 W 53 % -3,380,702 W -8
Low mid 351,580 W 351,580 W ~ 291,862 W 31 % -1,966,893 W -6
low price 291,862 W 291,862 W ~ 0 W 9 % -553,084 W -2
Stock price rise
probability score
A Sector 46.8 48.9 46.8 46.9 50.3 41.3
61.0B Sector 27.1 45.0 21.7 46.9 30.8 29.2
Total average
2018.07.17 2018.08.14 2018.09.12 2018.10.17 2018.11.14 2018.12.12
36.9 47.0 34.2 34.6 40.5 35.2
15 % -15 %
2018.08.14 2018.09.12 2018.10.17 2018.11.14 2018.12.12
Total of
increase rate
Total score
A Sector 4 % -5 % 0 % 7 % -22 %
-3 % 44.3B Sector 40 % -108 % 54 % -52 % -6 %
Total average 21 % -37 % 1 %
47 49 47 47
50
41
27
45
22
47
31 29
37
47
34 35
41
35
0
10
20
30
40
50
60
2018.07.17 2018.08.14 2018.09.12 2018.10.17 2018.11.14 2018.12.12
Stock price rise probability score
A sector
B sector
Total average
4% -5% 0% 7%
-22%
40%
-108%
54%
-52%
-6%
21%
-37%
1%
15%
-15%
-150%
-100%
-50%
0%
50%
100%
2018.08.14 2018.09.12 2018.10.17 2018.11.14 2018.12.12
Increase rate of stock price rise
A sector
B sector
Total average
LOTTE chemical](data:image/gif;base64,R0lGODlhAQABAIAAAAAAAP///yH5BAEAAAAALAAAAAABAAEAAAIBRAA7)
Recommandé
Recommandé
Contenu connexe
Tendances
Tendances (20)
Similaire à LOTTE Chemical-011170-Algorithm Investment Report
Similaire à LOTTE Chemical-011170-Algorithm Investment Report (20)
Plus de 알고리즘 기업분석 컨설팅-알기컨,algikeon
Plus de 알고리즘 기업분석 컨설팅-알기컨,algikeon (20)
Dernier
Dernier (20)
LOTTE Chemical-011170-Algorithm Investment Report
- 1. Performance Analysis of Algorithm (consolidated) 011170 Date Period 3 months 100-m won 2015.12 2016.12 2017.12 Average 2017.12 2018.03 2018.06 2018.09 2018.12 2019.03 IFRS(Con) IFRS(Con) IFRS(Con) IFRS(Con) IFRS(Con) IFRS(Con) IFRS(Con) IFRS(Con) IFRS(Con) IFRS(Con) IFRS(Con) Sales 117,133 132,235 158,745 136,038 40,350 41,232 43,302 42,476 41,167 43,149 41,840 O-profit 16,111 25,443 29,297 23,617 7,165 6,620 7,013 5,036 3,969 4,544 6,459 N-income 9,907 18,372 22,846 17,042 4,967 5,432 5,790 4,543 3,451 4,265 5,183 O-rate 13.8 19.2 18.5 17.2 17.8 16.1 16.2 11.9 9.6 10.5 15.5 N-rate 8.5 13.9 14.4 12.2 12.3 13.2 13.4 10.7 8.4 9.9 12.4 ROE 13.1 19.5 18.6 17.1 16.2 16.9 16.9 15.9 15.1 15.4 16.5 Debt-ratio 51.8 68.8 59.5 60.0 59.5 64.6 58.5 59.3 57.0 54.8 60.5 Quick-ratio 196.8 126.4 176.1 166.4 176.1 169.5 168.5 169.4 174.5 180.0 170.9 reserve-ratio 4,209.9 5,230.8 6,687.7 5,376.2 6,687.7 6,790.8 7,112.5 7,368.4 7,607.4 7,854.8 6,989.9 EPS 28,904 53,601 66,654 49,720 14,491 15,848 16,893 13,254 9,536 11,281 15,122 BPS 220,438 274,272 357,539 284,083 357,539 362,082 382,738 393,883 414,742 436,706 374,060 Dividends 2,500 4,000 10,500 5,667 2018-12-13 Major Financial Information Recent Annual Performance Recent quarterly performance Estimate Average Gap (Indication / stock) Color High price ~ 98 % High mid ~ 75 % Mid ~ 53 % Low mid ~ 31 % Low price ~ 9 % Indication price Range Current stock price Company score 471,017 W 471,017 W 411,299 W 411,299 W 411,299 W 351,580 W Evaluation 530,736 W 530,736 W~ 471,017 W 268,500 W 60.6351,580 W 351,580 W 291,862 W Low price Buy 291,862 W 291,862 W 0 W Industrial name of the company The number of All industries Algorithm Industry ranking Total number of listed companies Algorithm company ranking Investment opinion Chemistry 81 9 2,940 5 291,862원 351,580원 411,299원 471,017원 530,736원 Low price 268,500원 8.7% 30.9% 53.2% 75.4% 97.7% 0.% 20.% 40.% 60.% 80.% 100.% 120.% 0W 100,000W 200,000W 300,000W 400,000W 500,000W 600,000W Low price Low mid Mid High mid High price Indication price chart (Consolidated) Indication price LOTTE chemical Gap LOTTE chemical
- 2. [Price for scheduled purchasing] Arbitrarily made Algorithm stocks Trading Strategies (consolidated) 011170 Date Period Gap (Indication / stock) Color 2018-12-13 3 months Current stock price Evaluation Stock price rise probability score Investment opinion Prospective purchase amount 268,500 W Low price 61.0 Buy 10,000,000 W Suggested Purchase Amount 6,356,619 W Number of stocks purchased 24 Indication price Range Buying / Selling Buying / Selling [Stocks] High price 530,736 W 530,736 W~ ~ 471,017 W 98 % -6,208,320 W -12 High mid 471,017 W 471,017 W ~ 411,299 W 75 % -4,794,511 W -10 Mid 411,299 W 411,299 W ~ 351,580 W 53 % -3,380,702 W -8 Low mid 351,580 W 351,580 W ~ 291,862 W 31 % -1,966,893 W -6 low price 291,862 W 291,862 W ~ 0 W 9 % -553,084 W -2 Stock price rise probability score A Sector 46.8 48.9 46.8 46.9 50.3 41.3 61.0B Sector 27.1 45.0 21.7 46.9 30.8 29.2 Total average 2018.07.17 2018.08.14 2018.09.12 2018.10.17 2018.11.14 2018.12.12 36.9 47.0 34.2 34.6 40.5 35.2 15 % -15 % 2018.08.14 2018.09.12 2018.10.17 2018.11.14 2018.12.12 Total of increase rate Total score A Sector 4 % -5 % 0 % 7 % -22 % -3 % 44.3B Sector 40 % -108 % 54 % -52 % -6 % Total average 21 % -37 % 1 % 47 49 47 47 50 41 27 45 22 47 31 29 37 47 34 35 41 35 0 10 20 30 40 50 60 2018.07.17 2018.08.14 2018.09.12 2018.10.17 2018.11.14 2018.12.12 Stock price rise probability score A sector B sector Total average 4% -5% 0% 7% -22% 40% -108% 54% -52% -6% 21% -37% 1% 15% -15% -150% -100% -50% 0% 50% 100% 2018.08.14 2018.09.12 2018.10.17 2018.11.14 2018.12.12 Increase rate of stock price rise A sector B sector Total average LOTTE chemical
- 3. 정보와 완전 정보 결 투자판단 있습니 위배 무단으 숙지하 Compliance notice ① The information provided by The Algorithm Company Analysis Consulting is obtained through reliable data and information and The Algorithm Company Analysis Program (TACAP), but its accuracy or completeness are not guaranteed. Furthermore, it may change over time.Therefore, we are not legally responsible for the results of the data provided by The Algorithm Company Analysis Consulting because of information errors or omissions. ② The Algorithm Company Analysis Consulting and all the information provided on it site are reference materials for investment decisions and the final responsibility of investment is up to users utilizing this information. ③ The Algorithm Company Analysis Consulting and its site do not do anything that violates the related laws such as discretionary transaction. ④ Users can not reallocate and recycle the information provided by The Algorithm Company Analysis Consulting firm let alone the information provided by its Site. ⑤ Be sure to know about application period of this algorithm analysis report in order to improve its accuracy. Tel : 070 - 4667 - 5009 Email : tacac@tacac.co.kr Homepage : tacac.co.kr Blog : tacac.blog.me SERVICES EDUCATION, M&A, IPO, RECOVER, CORPORATE RESTRUCTURING, MANAGEMENT OF TECHNOLOGY, BUSINESS STRATEGY, FAMILY BUSINESS Request : http://tacac.co.kr/?page_id=1374 ① Consulting The Algori accuracy o change ove results of Consulting ② informatio investmen up ③ do anythin transaction ④ The Algori informatio ⑤ analysis re