Performance Analysis and Stock Trading Strategies of Algorithm Company
•
0 j'aime•126 vues

This document provides a performance analysis of an algorithm company over several periods from 2016-2019. It includes financial metrics such as sales, operating profit, net income, debt ratios, and stock prices. It also evaluates the company's current stock price compared to an indication price range and assigns a probability score for the stock price rising. Finally, it provides strategies for purchasing the company's stocks, including suggested amounts at different price levels.
![[Price for scheduled purchasing]
Arbitrarily made
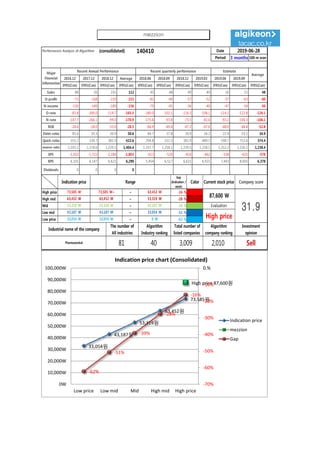
Algorithm stocks Trading Strategies (consolidated) 140410 Date
Period
Gap
(Indication /
stock)
Color
2019-06-28
3 months
Current stock price Evaluation
Stock price rise
probability score
Investment opinion Prospective purchase amount
87,600 W High price 27.0 Sell 1,500,000 W
Suggested Purchase
Amount 159,621 W
Number of stocks
purchased 2
Indication price Range Buying / Selling Buying / Selling [Stocks]
High price 73,585 W 73,585 W~ ~ 63,452 W -16 % 25,538 W 0
High mid 63,452 W 63,452 W ~ 53,319 W -28 % 44,002 W 1
Mid 53,319 W 53,319 W ~ 43,187 W -39 % 62,465 W 1
Low mid 43,187 W 43,187 W ~ 33,054 W -51 % 80,928 W 2
low price 33,054 W 33,054 W ~ 0 W -62 % 99,392 W 3
Stock price rise
probability score
A Sector 51.3 46.8 45.0 43.4 45.7 49.4
27.0B Sector 27.1 54.6 62.5 43.4 38.3 13.3
Total average
2019.01.29 2019.03.04 2019.04.01 2019.04.29 2019.05.29 2019.06.27
39.2 50.7 53.8 46.7 42.0 31.4
-11 % -34 %
2019.03.04 2019.04.01 2019.04.29 2019.05.29 2019.06.27
Total of
increase rate
Total score
A Sector -10 % -4 % -4 % 5 % 7 %
-6 % 42.3B Sector 50 % 13 % -44 % -13 % -188 %
Total average 23 % 6 % -15 %
51
47 45 43 46
49
27
55
63
43
38
13
39
51 54
47
42
31
0
10
20
30
40
50
60
70
2019.01.29 2019.03.04 2019.04.01 2019.04.29 2019.05.29 2019.06.27
Stock price rise probability score
A sector
B sector
Total average
-10% -4% -4% 5% 7%
50%
13%
-44%
-13%
-188%
23%
6%
-15% -11%
-34%
-200%
-150%
-100%
-50%
0%
50%
100%
2019.03.04 2019.04.01 2019.04.29 2019.05.29 2019.06.27
Increase rate of stock price rise
A sector
B sector
Total average
mezzion](data:image/gif;base64,R0lGODlhAQABAIAAAAAAAP///yH5BAEAAAAALAAAAAABAAEAAAIBRAA7)
Recommandé
Recommandé
Contenu connexe
Tendances
Tendances (20)
Similaire à Performance Analysis and Stock Trading Strategies of Algorithm Company
Similaire à Performance Analysis and Stock Trading Strategies of Algorithm Company (20)
Plus de 알고리즘 기업분석 컨설팅-알기컨,algikeon
Plus de 알고리즘 기업분석 컨설팅-알기컨,algikeon (20)
Dernier
Dernier (20)
Performance Analysis and Stock Trading Strategies of Algorithm Company
- 1. Performance Analysis of Algorithm (consolidated) 140410 Date Period 3 months 100-m won 2016.12 2017.12 2018.12 Average 2018.06 2018.09 2018.12 2019.03 2019.06 2019.09 IFRS(Con) IFRS(Con) IFRS(Con) IFRS(Con) IFRS(Con) IFRS(Con) IFRS(Con) IFRS(Con) IFRS(Con) IFRS(Con) IFRS(Con) Sales 88 56 191 112 45 48 49 49 50 51 48 O-profit -72 -168 -219 -153 -81 -49 -57 -52 -57 -63 -60 N-income -130 -149 -189 -156 -79 -45 -36 -40 -47 -54 -50 O-rate -81.8 -300.0 -114.7 -165.5 -180.0 -102.1 -116.3 -106.1 -114.2 -122.8 -126.1 N-rate -147.7 -266.1 -99.0 -170.9 -175.6 -93.8 -73.5 -81.6 -93.2 -106.3 -106.1 ROE -24.6 -28.0 -33.0 -28.5 -66.9 -49.4 -47.2 -47.6 -48.0 -48.4 -52.8 Debt-ratio 81.6 39.3 30.9 50.6 44.7 37.8 30.9 26.2 22.4 19.1 34.9 Quick-ratio 555.2 330.7 381.9 422.6 294.8 331.5 381.9 489.5 598.7 753.6 374.4 reserve-ratio 1,595.1 1,378.6 1,239.5 1,404.4 1,197.7 1,258.1 1,239.5 1,258.1 1,252.2 1,226.1 1,238.4 EPS -1,502 -1,722 -2,184 -1,803 -913 -520 -416 -462 -538 -625 -578 BPS 6,101 6,147 6,621 6,290 5,454 6,517 6,621 6,921 7,443 8,005 6,378 Dividends 0 0 0 0 2019-06-28 Major Financial Information Recent Annual Performance Recent quarterly performance Estimate Average Gap (Indication / stock) Color High price ~ -16 % High mid ~ -28 % Mid ~ -39 % Low mid ~ -51 % Low price ~ -62 % Indication price Range Current stock price Company score 63,452 W 63,452 W 53,319 W 53,319 W 53,319 W 43,187 W Evaluation 73,585 W 73,585 W~ 63,452 W 87,600 W 31.943,187 W 43,187 W 33,054 W High price Sell 33,054 W 33,054 W 0 W Industrial name of the company The number of All industries Algorithm Industry ranking Total number of listed companies Algorithm company ranking Investment opinion Pharmaceutical 81 40 3,009 2,010 33,054원 43,187원 53,319원 63,452원 73,585원 High price 87,600원 -62% -51% -39% -28% -16% -70% -60% -50% -40% -30% -20% -10% 0.% 0W 10,000W 20,000W 30,000W 40,000W 50,000W 60,000W 70,000W 80,000W 90,000W 100,000W Low price Low mid Mid High mid High price Indication price chart (Consolidated) Indication price mezzion Gap mezzion
- 2. [Price for scheduled purchasing] Arbitrarily made Algorithm stocks Trading Strategies (consolidated) 140410 Date Period Gap (Indication / stock) Color 2019-06-28 3 months Current stock price Evaluation Stock price rise probability score Investment opinion Prospective purchase amount 87,600 W High price 27.0 Sell 1,500,000 W Suggested Purchase Amount 159,621 W Number of stocks purchased 2 Indication price Range Buying / Selling Buying / Selling [Stocks] High price 73,585 W 73,585 W~ ~ 63,452 W -16 % 25,538 W 0 High mid 63,452 W 63,452 W ~ 53,319 W -28 % 44,002 W 1 Mid 53,319 W 53,319 W ~ 43,187 W -39 % 62,465 W 1 Low mid 43,187 W 43,187 W ~ 33,054 W -51 % 80,928 W 2 low price 33,054 W 33,054 W ~ 0 W -62 % 99,392 W 3 Stock price rise probability score A Sector 51.3 46.8 45.0 43.4 45.7 49.4 27.0B Sector 27.1 54.6 62.5 43.4 38.3 13.3 Total average 2019.01.29 2019.03.04 2019.04.01 2019.04.29 2019.05.29 2019.06.27 39.2 50.7 53.8 46.7 42.0 31.4 -11 % -34 % 2019.03.04 2019.04.01 2019.04.29 2019.05.29 2019.06.27 Total of increase rate Total score A Sector -10 % -4 % -4 % 5 % 7 % -6 % 42.3B Sector 50 % 13 % -44 % -13 % -188 % Total average 23 % 6 % -15 % 51 47 45 43 46 49 27 55 63 43 38 13 39 51 54 47 42 31 0 10 20 30 40 50 60 70 2019.01.29 2019.03.04 2019.04.01 2019.04.29 2019.05.29 2019.06.27 Stock price rise probability score A sector B sector Total average -10% -4% -4% 5% 7% 50% 13% -44% -13% -188% 23% 6% -15% -11% -34% -200% -150% -100% -50% 0% 50% 100% 2019.03.04 2019.04.01 2019.04.29 2019.05.29 2019.06.27 Increase rate of stock price rise A sector B sector Total average mezzion
- 3. 정보와 완전 정보 결 투자판단 있습니 위배 무단으 숙지하 Compliance notice ① The information provided by The Algorithm Company Analysis Consulting is obtained through reliable data and information and The Algorithm Company Analysis Program (TACAP), but its accuracy or completeness are not guaranteed. Furthermore, it may change over time.Therefore, we are not legally responsible for the results of the data provided by The Algorithm Company Analysis Consulting because of information errors or omissions. ② The Algorithm Company Analysis Consulting and all the information provided on it site are reference materials for investment decisions and the final responsibility of investment is up to users utilizing this information. ③ The Algorithm Company Analysis Consulting and its site do not do anything that violates the related laws such as discretionary transaction. ④ Users can not reallocate and recycle the information provided by The Algorithm Company Analysis Consulting firm let alone the information provided by its Site. ⑤ Be sure to know about application period of this algorithm analysis report in order to improve its accuracy. Tel : 070 - 4667 - 5009 Email : tacac@tacac.co.kr Homepage : tacac.co.kr Blog : tacac.blog.me SERVICES M&A, IPO, RECOVER, CORPORATE RESTRUCTURING, MANAGEMENT OF TECHNOLOGY, BUSINESS STRATEGY, FAMILY BUSINESS Request : http://tacac.co.kr/?page_id=1374 ① Consulting The Algori accuracy o change ove results of Consulting ② informatio investmen up ③ do anythin transaction ④ The Algori informatio ⑤ analysis re