posco itc 022100 Algorithm Investment Report
•
0 j'aime•81 vues

posco itc 022100 Algorithm Investment Report
![[Price for scheduled purchasing]
Arbitrarily made
Algorithm stocks Trading Strategies (consolidated) 022100 Date
Period
Gap
(Indication /
stock)
Color
low price 5,818 W 5,818 W ~ 0 W 18 % -670,542 W -115
Low mid 7,457 W 7,457 W ~ 5,818 W 51 % -1,901,613 W -255
Mid 9,096 W 9,096 W ~ 7,457 W 85 % -3,132,683 W -344
High mid 10,736 W 10,736 W ~ 9,096 W 118 % -4,363,754 W All selling
Suggested Purchase
Amount 3,698,657 W
Number of stocks
purchased 751
Indication price Range Buying / Selling Buying / Selling [Stocks]
High price 12,375 W 12,375 W~ ~ 10,736 W 151 % -5,594,825 W All selling
2019-11-05
3 months
Current stock price Evaluation
Stock price rise
probability score
Investment opinion Prospective purchase amount
4,925 W Low price 44.2 Normal 10,000,000 W
45.6 38.9 33.4 32.5 34.0 43.6
2019.06.10 2019.07.08 2019.08.05 2019.09.03 2019.10.04 2019.11.04
Stock price rise
probability score
A Sector 48.8 46.1 46.1 41.2 43.0 52.6
44.2B Sector 42.5 31.7 20.8 41.2 25.0 34.6
Total average
2019.08.05 2019.09.03 2019.10.04 2019.11.04
Total of
increase rate
Total score
A Sector -6 % 0 % -12 % 4 % 18 %
-2 % 43.3B Sector -34 % -52 % 49 % -65 % 28 %
Total average -17 % -16 % -3 % 4 % 22 %
2019.07.08
49
46 46
41 43
53
43
32
21
41
25
35
46
39
33 33 34
44
0
10
20
30
40
50
60
2019.06.10 2019.07.08 2019.08.05 2019.09.03 2019.10.04 2019.11.04
Stock price rise probability score
A sector
B sector
Total average
-6%
0%
-12%
4%
18%
-34%
-52%
49%
-65%
28%
-17% -16%
-3%
4%
22%
-80%
-60%
-40%
-20%
0%
20%
40%
60%
2019.07.08 2019.08.05 2019.09.03 2019.10.04 2019.11.04
Increase rate of stock price rise
A sector
B sector
Total average
posco itc](data:image/gif;base64,R0lGODlhAQABAIAAAAAAAP///yH5BAEAAAAALAAAAAABAAEAAAIBRAA7)
Recommandé
Recommandé
Contenu connexe
Tendances
Tendances (20)
Similaire à posco itc 022100 Algorithm Investment Report
Similaire à posco itc 022100 Algorithm Investment Report (20)
Plus de 알고리즘 기업분석 컨설팅-알기컨,algikeon
Plus de 알고리즘 기업분석 컨설팅-알기컨,algikeon (20)
Dernier
Dernier (20)
posco itc 022100 Algorithm Investment Report
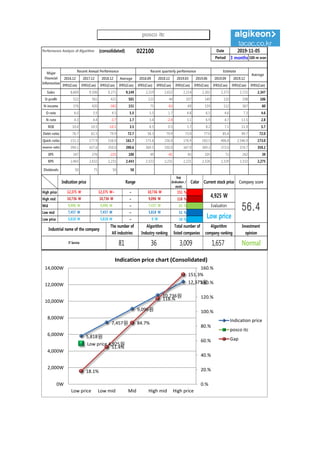
- 1. Performance Analysis of Algorithm (consolidated) 022100 Date Period 3 months 100-m won 2016.12 2017.12 2018.12 Average 2018.09 2018.12 2019.03 2019.06 2019.09 2019.12 IFRS(Con) IFRS(Con) IFRS(Con) IFRS(Con) IFRS(Con) IFRS(Con) IFRS(Con) IFRS(Con) IFRS(Con) IFRS(Con) IFRS(Con) Sales 8,669 9,506 9,271 9,149 2,219 2,652 2,214 2,302 2,373 2,721 2,347 O-profit 522 561 421 501 123 44 107 149 110 198 106 N-income 376 420 -342 151 75 -63 69 159 112 367 60 O-rate 6.0 5.9 4.5 5.5 5.5 1.7 4.8 6.5 4.6 7.3 4.6 N-rate 4.3 4.4 -3.7 1.7 3.4 -2.4 3.1 6.9 4.7 13.5 2.8 ROE 10.0 10.5 -10.1 3.5 8.5 0.5 5.7 8.2 7.1 11.9 5.7 Debt-ratio 76.7 61.5 79.9 72.7 58.3 79.9 73.0 77.0 85.4 94.7 72.0 Quick-ratio 151.2 177.9 156.0 161.7 175.6 156.0 176.9 183.5 406.8 2,546.9 173.0 reserve-ratio 394.1 427.6 350.0 390.6 369.5 350.0 347.9 369.3 372.0 374.7 359.2 EPS 247 276 -225 100 49 -41 45 105 72 242 39 BPS 2,465 2,632 2,231 2,443 2,322 2,231 2,221 2,326 2,329 2,332 2,275 Dividends 50 75 50 58 Major Financial Information Recent Annual Performance Recent quarterly performance Estimate Average 2019-11-05 Gap (Indication / stock) Color High price ~ 151 % High mid ~ 118 % Mid ~ 85 % Low mid ~ 51 % Low price ~ 18 % Normal 5,818 W 5,818 W 0 W Industrial name of the company The number of All industries Algorithm Industry ranking Total number of listed companies Algorithm company ranking Investment opinion IT Service 81 36 3,009 1,657 10,736 W 10,736 W 9,096 W 9,096 W 9,096 W 7,457 W Evaluation 12,375 W 12,375 W~ 10,736 W 4,925 W 56.47,457 W 7,457 W 5,818 W Low price Indication price Range Current stock price Company score 5,818원 7,457원 9,096원 10,736원 12,375원 Low price 4,925원 18.1% 51.4% 84.7% 118.% 151.3% 0.% 20.% 40.% 60.% 80.% 100.% 120.% 140.% 160.% 0W 2,000W 4,000W 6,000W 8,000W 10,000W 12,000W 14,000W Low price Low mid Mid High mid High price Indication price chart (Consolidated) Indication price posco itc Gap posco itc
- 2. [Price for scheduled purchasing] Arbitrarily made Algorithm stocks Trading Strategies (consolidated) 022100 Date Period Gap (Indication / stock) Color low price 5,818 W 5,818 W ~ 0 W 18 % -670,542 W -115 Low mid 7,457 W 7,457 W ~ 5,818 W 51 % -1,901,613 W -255 Mid 9,096 W 9,096 W ~ 7,457 W 85 % -3,132,683 W -344 High mid 10,736 W 10,736 W ~ 9,096 W 118 % -4,363,754 W All selling Suggested Purchase Amount 3,698,657 W Number of stocks purchased 751 Indication price Range Buying / Selling Buying / Selling [Stocks] High price 12,375 W 12,375 W~ ~ 10,736 W 151 % -5,594,825 W All selling 2019-11-05 3 months Current stock price Evaluation Stock price rise probability score Investment opinion Prospective purchase amount 4,925 W Low price 44.2 Normal 10,000,000 W 45.6 38.9 33.4 32.5 34.0 43.6 2019.06.10 2019.07.08 2019.08.05 2019.09.03 2019.10.04 2019.11.04 Stock price rise probability score A Sector 48.8 46.1 46.1 41.2 43.0 52.6 44.2B Sector 42.5 31.7 20.8 41.2 25.0 34.6 Total average 2019.08.05 2019.09.03 2019.10.04 2019.11.04 Total of increase rate Total score A Sector -6 % 0 % -12 % 4 % 18 % -2 % 43.3B Sector -34 % -52 % 49 % -65 % 28 % Total average -17 % -16 % -3 % 4 % 22 % 2019.07.08 49 46 46 41 43 53 43 32 21 41 25 35 46 39 33 33 34 44 0 10 20 30 40 50 60 2019.06.10 2019.07.08 2019.08.05 2019.09.03 2019.10.04 2019.11.04 Stock price rise probability score A sector B sector Total average -6% 0% -12% 4% 18% -34% -52% 49% -65% 28% -17% -16% -3% 4% 22% -80% -60% -40% -20% 0% 20% 40% 60% 2019.07.08 2019.08.05 2019.09.03 2019.10.04 2019.11.04 Increase rate of stock price rise A sector B sector Total average posco itc
- 3. 정보와 완전 정보 결 투자판단 있습니 위배 무단으 숙지하 Compliance notice ① The information provided by The Algorithm Company Analysis Consulting is obtained through reliable data and information and The Algorithm Company Analysis Program (TACAP), but its accuracy or completeness are not guaranteed. Furthermore, it may change over time.Therefore, we are not legally responsible for the results of the data provided by The Algorithm Company Analysis Consulting because of information errors or omissions. ② The Algorithm Company Analysis Consulting and all the information provided on it site are reference materials for investment decisions and the final responsibility of investment is up to users utilizing this information. ③ The Algorithm Company Analysis Consulting and its site do not do anything that violates the related laws such as discretionary transaction. ④ Users can not reallocate and recycle the information provided by The Algorithm Company Analysis Consulting firm let alone the information provided by its Site. ⑤ Be sure to know about application period of this algorithm analysis report in order to improve its accuracy. Tel : 070 - 4667 - 5009 Email : tacac@tacac.co.kr Homepage : tacac.co.kr Blog : tacac.blog.me SERVICES M&A, IPO, RECOVER, CORPORATE RESTRUCTURING, MANAGEMENT OF TECHNOLOGY, BUSINESS STRATEGY, FAMILY BUSINESS Request : http://tacac.co.kr/?page_id=1374 ① Consulting The Algori accuracy o change ove results of Consulting ② informatio investmen up ③ do anythin transaction ④ The Algori informatio ⑤ analysis re