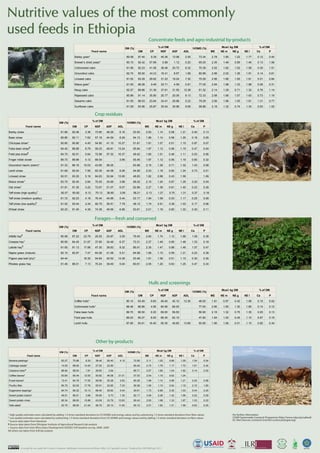
Nutritive values of the most commonly used feeds in Ethiopia
•
0 j'aime•375 vues

Poster by Alan Duncan for the CGIAR Systemwide Livestock Programme, 1 July 2011

Recommandé
Contenu connexe
En vedette
En vedette (20)
Similaire à Nutritive values of the most commonly used feeds in Ethiopia
Similaire à Nutritive values of the most commonly used feeds in Ethiopia (17)
Plus de ILRI
Plus de ILRI (20)
Dernier
Dernier (20)
Nutritive values of the most commonly used feeds in Ethiopia
- 1. Nutritive values of the most commonly used feeds in Ethiopia Concentrate feeds and agro-industrial by-products DM (%) % of DM IVDMD (%) Mcal/ kg DM % of DM Feed name OM CP NDF ADF ADL ME NE m NE g NE l Ca P Barley grain* 89.58 97.40 9.39 40.36 13.96 2.55 73.34 2.78 1.85 1.22 1.77 0.12 0.40 Brewer’s dried yeast* 90.10 92.42 57.69 0.88 1.12 0.20 65.00 2.35 1.48 0.89 1.46 0.13 1.56 Cottonseed cake 91.96 92.23 41.06 38.46 20.72 6.32 70.39 2.52 1.62 1.02 1.58 0.30 1.51 Groundnut cake 92.74 95.00 49.02 16.41 8.67 1.68 80.88 2.99 2.02 1.36 1.91 0.14 0.61 Linseed cake 91.52 93.29 29.62 31.23 19.24 7.30 70.29 2.56 1.66 1.05 1.61 0.51 0.84 Maize grain+ 91.50 98.26 9.48 32.71 4.59 0.81 77.05 2.94 1.98 1.33 1.88 0.06 0.31 Noug cake 92.27 89.86 31.36 37.61 31.55 12.38 61.32 2.14 1.29 0.71 1.32 0.76 1.14 Rapeseed cake 90.86 91.14 35.80 25.77 20.05 8.13 72.33 2.58 1.68 1.07 1.63 0.73 1.19 Sesame cake 91.50 88.53 23.64 34.41 29.86 5.23 79.29 2.56 1.66 1.05 1.61 1.31 0.77 Sunflower cake 91.59 93.96 25.87 35.54 30.96 9.69 58.86 2.18 1.32 0.74 1.34 0.63 1.02 Crop residues % of DM Mcal/ kg DM % of DM DM (%) IVDMD (%) Feed name OM CP NDF ADF ADL ME NE m NE g NE l Ca P Barley straw 91.86 92.46 3.36 73.90 48.28 6.16 53.50 2.00 1.14 0.58 1.21 0.40 0.13 Bean straw 95.86 92.11 7.62 57.18 44.59 8.29 54.13 1.99 1.14 0.58 1.20 0.18 0.05 Chickpea straw* 92.80 90.80 4.40 54.90 41.10 10.27 51.81 1.91 1.07 0.51 1.15 0.87 0.07 Faba bean straw¶ 94.40 89.69 8.79 59.23 46.81 13.24 55.64 1.97 1.12 0.56 1.19 0.47 0.04 Field pea straw¶ 94.70 92.51 5.64 72.98 57.32 16.37 49.42 1.85 1.01 0.46 1.11 0.53 0.06 Finger millet stover 89.73 89.89 4.12 69.54 3.99 55.46 1.97 1.12 0.56 1.19 0.60 0.32 Groundnut haulm (stem)* 91.33 86.16 10.03 43.85 58.25 63.96 2.15 1.29 0.71 1.32 1.43 0.08 Lentil straw 91.69 92.04 7.95 62.35 44.08 9.28 54.99 2.03 1.18 0.62 1.24 0.73 0.21 Linseed straw 92.51 93.25 5.16 64.63 52.64 13.95 48.83 1.82 0.98 0.43 1.09 1.09 Maize stover+ 93.70 92.40 2.84 70.05 34.69 3.98 58.02 2.10 1.24 0.67 1.29 0.20 0.04 Oat straw+ 91.81 91.35 3.22 72.67 51.07 6.07 62.86 2.27 1.39 0.81 1.40 0.23 0.28 Teff straw (high quality)1 92.07 90.92 6.12 70.13 38.85 3.09 58.21 2.13 1.27 0.70 1.31 0.37 0.18 Teff straw (medium quality) 91.72 92.23 4.18 76.44 44.68 5.44 53.17 1.94 1.09 0.53 1.17 0.25 0.09 Teff straw (low quality)2 91.02 93.44 2.24 82.75 50.51 7.78 48.12 1.74 0.91 0.36 1.03 0.17 0.06 Wheat straw 92.23 91.40 4.39 74.39 49.56 6.96 53.61 2.01 1.16 0.60 1.22 0.30 0.11 Forages—fresh and conserved % of DM Mcal/ kg DM % of DM DM (%) IVDMD (%) Feed name OM CP NDF ADF ADL ME NE m NE g NE l Ca P Alfalfa hay ¶ 90.58 87.23 23.79 25.55 20.87 3.55 79.40 2.65 1.74 1.12 1.68 1.09 0.39 Cowpea hay* 90.90 84.45 21.67 37.65 34.48 6.37 73.31 2.37 1.49 0.90 1.48 1.33 0.18 Lablab hay ¶ 91.65 91.13 17.88 47.30 38.83 8.32 66.01 2.35 1.47 0.88 1.46 1.57 0.47 Napier grass (mature) 92.10 82.67 7.47 64.28 41.06 5.51 64.98 1.99 1.15 0.59 1.21 0.23 0.39 Pigeon pea leaf (dry)* 94.44 16.30 54.64 40.52 14.39 53.46 1.91 1.06 0.51 1.15 0.30 0.30 Rhodes grass hay 91.46 88.01 7.13 70.24 39.49 5.04 60.61 2.05 1.20 0.63 1.25 0.47 0.34 Hulls and screenings % of DM Mcal/ kg DM % of DM DM (%) IVDMD (%) Feed name OM CP NDF ADF ADL ME NE m NE g NE l Ca P Coffee hulls* 90.10 93.49 9.60 46.40 40.10 12.30 48.00 1.81 0.97 0.42 1.08 0.15 0.02 Cottonseed hulls* 88.48 96.88 4.56 84.06 66.00 77.00 2.90 1.95 1.30 1.85 0.14 0.12 Faba bean hulls 89.70 96.50 9.20 69.00 59.50 56.90 2.18 1.32 0.75 1.35 0.93 0.13 Field pea hulls 89.02 95.27 8.00 66.30 62.10 47.80 1.84 1.00 0.45 1.10 0.87 0.18 Lentil hulls 87.85 93.41 16.40 55.35 45.65 13.60 50.90 1.90 1.06 0.51 1.15 0.82 0.34 Other by-products % of DM Mcal/ kg DM % of DM DM (%) IVDMD (%) Feed name OM CP NDF ADF ADL ME NE m NE g NE l Ca P Banana peelings + 93.27 75.96 8.30 38.40 26.40 4.12 72.90 2.11 1.25 0.68 1.29 1.54 0.54 Cabbage waste* 14.00 88.00 14.40 27.20 22.90 80.40 2.72 1.79 1.17 1.72 1.61 0.34 Cassava tuber ¶ 88.84 98.04 1.81 26.60 3.64 66.71 2.57 1.66 1.04 1.62 0.14 0.02 Coffee leaves* 93.60 90.44 12.50 50.82 46.08 21.01 57.03 2.04 1.19 0.62 1.24 Enset leaves* 12.41 84.78 17.50 59.59 30.28 3.93 60.26 1.99 1.14 0.58 1.21 0.20 0.68 Poultry litter 90.75 83.05 17.78 55.91 32.85 7.23 56.58 1.95 1.10 0.54 1.18 2.10 1.80 Sugarcane toppings+ 94.74 86.32 10.13 66.40 39.82 5.44 50.61 1.73 0.89 0.35 1.03 0.44 0.20 Sweet potato tubers* 49.01 96.51 3.88 59.90 6.73 1.35 82.17 3.06 2.08 1.42 1.96 0.22 0.09 Sweet potato vines 90.34 86.83 15.88 43.09 33.78 13.93 90.43 2.93 1.98 1.33 1.87 1.23 0.22 Tella atela* 52.75 98.00 21.40 56.75 25.10 11.00 65.10 2.51 1.62 1.01 1.58 0.63 0.25 1 High quality estimates were calculated by adding 1.5 times standard deviation to CP, IVDMD and energy values and by subtracting 1.5 times standard deviation from bre values For further information: 2 Low quality estimates were calculated by subtracting 1.5 times standard deviation from CP, IVDMD and energy values and by adding 1.5 times standard deviation to bre values CGIAR Systemwide Livestock Programme (http://www.vslp.org/ssafeed) * Source-data taken from literature Dr. Alan Duncan, Livestock Scientist (a.duncan@cgiar.org) ¶ Source-data taken from Ethiopian Institute of Agricultural Research lab analysis + Source-data from East Africa Dairy Development (EADD)/ ILRI baseline survey, 2008−2009 All others are taken from ILRI lab analysis System AR w slp I CG me ide Liv sto Licensed for use under the Creative Commons Attribution-Noncommercial-Share Alike 3.0 Unported License. Produced by ILRI KMIS July 2011. ck Progra m e Texas A&M EIAR MoARD