Descriptive New features of high angular momentum rotational states in some rear-earth nuclei

The results from the variable moment of inertia (VMI) and cubic polynomial (CP) models with the available experimental information on transition energies for the yrast band levels in all studied nuclei. These models has been generalized so as to be applicable to transitional and vibrational nuclei by requiring that the extended models reduce at low angular momentum, to the polynomial dependence which gives excellent fits to the experimental spectra in the spherical, transitional and deformed regions. The level structure indicate a transition from collective to few-particle characteristics at high spin, possibly suggesting a change shape from prolate through triaxial to oblate. The loss of collectivity occurs at much lower angular momentum than predicted by calculations. The calculated Qt-value of the yrast band of the nucleus with N = 90.

Recommandé
Recommandé
Contenu connexe
Tendances
Tendances (18)
En vedette
En vedette (20)
Similaire à Descriptive New features of high angular momentum rotational states in some rear-earth nuclei
Similaire à Descriptive New features of high angular momentum rotational states in some rear-earth nuclei (20)
Plus de IOSR Journals
Dernier
Dernier (20)
Descriptive New features of high angular momentum rotational states in some rear-earth nuclei
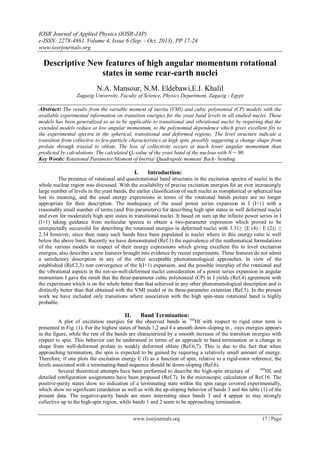
- 1. IOSR Journal of Applied Physics (IOSR-JAP) e-ISSN: 2278-4861. Volume 4, Issue 6 (Sep. - Oct. 2013), PP 17-24 www.iosrjournals.org www.iosrjournals.org 17 | Page Descriptive New features of high angular momentum rotational states in some rear-earth nuclei N.A. Mansour, N.M. Eldebawi,E.I. Khalil Zagazig University, Faculty of Science, Physics Department, Zagazig - Egypt Abstract: The results from the variable moment of inertia (VMI) and cubic polynomial (CP) models with the available experimental information on transition energies for the yrast band levels in all studied nuclei. These models has been generalized so as to be applicable to transitional and vibrational nuclei by requiring that the extended models reduce at low angular momentum, to the polynomial dependence which gives excellent fits to the experimental spectra in the spherical, transitional and deformed regions. The level structure indicate a transition from collective to few-particle characteristics at high spin, possibly suggesting a change shape from prolate through triaxial to oblate. The loss of collectivity occurs at much lower angular momentum than predicted by calculations. The calculated Qt-value of the yrast band of the nucleus with N = 90. Key Words: Rotational Parameter/Moment of Inertia/ Quadrupole moment/ Back- bending. I. Introduction: The presence of rotational and quasirotational band structures in the excitation spectra of nuclei in the whole nuclear region was discussed. With the availability of precise excitation energies for an ever increasingly large number of levels in the yrast bands, the earlier classification of such nuclei as nonspherical or spherical has lost its meaning, and the usual energy expressions in terms of the rotational bands picture are no longer appropriate for their description. The inadequacy of the usual power series expansion in I (I+1) with a reasonably small number of terms (and free parameters) for describing high spin states in well deformed nuclei and even for moderately high spin states in transitional nuclei. It based on sum up the infinite power series in I (I+1) taking guidance from molecular spectra to obtain a two-parameter expression which proved to be unexpectedly successful for describing the rotational energies in deformed nuclei with 3.31≥ {E (4) / E (2)} ≥ 2.34 however, since then many such bands have been populated in nuclei where in this energy ratio is well below the above limit. Recently we have demonstrated (Ref.1) the equivalence of the mathematical formulations of the various models in respect of their energy expressions which giving excellent fits to level excitation energies, also describes a new features brought into evidence by recent experiments. These features do not admit a satisfactory description in any of the other acceptable phenomenological approaches. In view of the established (Ref.2,3) non convergence of the I(I+1) expansion, and the possible interplay of the rotational and the vibrational aspects in the not-so-well-deformed nuclei consideration of a power series expansion in angular momentum I gave the result that the three-parameter cubic polynomial (CP) in I yields (Ref.4) agreement with the experiment which is on the whole better than that achieved in any other phenomenological description and is distinctly better than that obtained with the VMI model or its three-parameter extension (Ref.5). In the present work we have included only transitions where association with the high spin-state rotational band is highly probable. II. Band Termination: A plot of excitation energies for the observed bands in 168 Hf with respect to rigid rotor term is presented in Fig. (1). For the highest states of bands 1,2 and 4 a smooth down-sloping in ᵧ -rays energies appears in the figure, while the rest of the bands are characterized by a smooth increase of the transition energies with respect to spin. This behavior can be understood in terms of an approach to band termination or a change in shape from well-deformed prolate to weakly deformed oblate (Ref.6,7). This is due to the fact that when approaching termination, the spin is expected to be gained by requiring a relatively small amount of energy. Therefore, if one plots the excitation energy E (I) as a function of spin, relative to a rigid-rotor reference, the levels associated with a terminating-band sequence should be down-sloping (Ref.6). Several theoretical attempts have been performed to describe the high-spin structure of 168 Hf, and detailed configuration assignments have been proposed (Ref.7). In the microscopic calculation of Ref.16. The positive-parity states show no indication of a terminating state within the spin range covered experimentally, which show no significant retardation as well as with the up-sloping behavior of bands 3 and 4in table (1) of the present data. The negative-parity bands are more interesting since bands 3 and 4 appear to stay strongly collective up to the high-spin region, while bands 1 and 2 seem to be approaching termination.
- 2. DescriptiveNew featuresof high angular momentum rotational states in some rear-earth nuclei www.iosrjournals.org 18 | Page Table (1): The excitation energies for the observed bands in 168 Hf, 156 Er and 158 Er nuclei with respect to rigid rotor term. 168 Hf Band-1 168 Hf Band-2 168 Hf Band-3 I E E-0.007I (I+1) I E E-0.007I(I+1) I E E-0.007I(I+1) 8- 2154.8 1.65 9 2066.3 1.44 2 123.9 0.12 10- 2465.9 1.70 11 2473.6 1.55 4 385.4 0.39 12- 2827.3 1.74 13 2937.5 1.66 6 756.6 0.46 14- 3268.3 1.80 15 3441.9 1.76 8 1213.2 0.71 16- 3776.6 1.87 17 3989.7 1.85 10 1735.2 0.97 18- 4335.3 1.94 19 4578.3 1.92 12 2305.3 1.21 20- 4933.4 1.99 21 5198.1 1.96 14 2938.3 1.47 22- 5573.6 2.03 23 5854.4 1.99 16 3622.8 1.72 24- 6268.2 2.07 25 6566.9 2.02 18 4321.8 1.93 26- 7028.8 2.12 27 7347.8 2.06 20 5048.8 2.11 28- 7860 2.18 29 8198.6 2.11 22 5814.0 2.27 31 9115.3 2.17 Table (1): Conti. 168 Hf Band-4 156 Er 158 Er I E E-0.007I(I+1) I E E-0.007I(I+1) I E E-0.007I(I+1) 14+ 2856.8 1.39 2 344.2 0.30 2 192 0.15 16+ 3309.7 1.41 4 797 0.66 4 527.1 0.39 18+ 3831.7 1.44 6 1340 1.05 6 970.2 0.68 20+ 4439.4 1.50 8 1959 1.46 8 1493 0.99 22+ 5123.6 1.59 10 2633 1.86 10 2072 1.30 24+ 5674.7 1.68 12 3315 2.22 12 2680 1.59 26+ 6687.3 1.77 14 3838 2.37 14 3190 1.72 28+ 7561.0 1.88 16 4383 2.48 16 3663 1.76 30+ 8500.4 1.99 18 5008 2.61 18 4229 1.84 32+ 9499.6 2.11 20 5718 2.78 20 4887 1.95 22 6490 2.95 22 5625 2.08 24 7317 3.12 24 6428 2.23 26 7271 2.36 28 8126 2.44 Fig. (1): Excitation energies of observed levels in 168 Hf, with a rigid rotor term subtracted as a function of angular momentum.
- 3. DescriptiveNew featuresof high angular momentum rotational states in some rear-earth nuclei www.iosrjournals.org 19 | Page Fig. (2): Spin as a function of transition energy for the strongly and weakly populated bands in 156,158,160,162,164,166 Er. III. Comparison With Experiment: Fig. (2) Show plots of the nuclear spin versus transition energy for 156-166 Er. As can be seen there exists a remarkable similarity between the different isotopes in all cases extremely sharp backbending occur and large alignments can be observed. In the earlier work (see Ref.9-14) it was established that the bands which cross the ground and 13/2 bands are the two-and three-quasineutron (i13/2) aligned bands in the even and odd isotopes, respectively. The 5- and 8- bands semi-decoupled (see Ref.15) and are intersected by the bands in which two additional i13/2 neutrons are aligned. An interpretation of the irregular sequences observed in 156,158 Er and denoted in table (1) is more speculative. The characteristic quasivibrational pattern of these bands suggests that they might be examples of terminating bands. Theoretical evidence for such bands has recently been given for nuclei in different mass region (Ref.17, 18). In the ᵧ - soft nuclei 156,158 Er the terminating bands might be formed by a transition from oblate shape with collective rotation towards the limit of ᵧ = -120 corresponding to anon-collective rotation around a prolate symmetry axis. A plot in Fig. (3) Looks very similar to corresponding plots for terminating bands in other nuclei (e.g.192,194 Hg Ref.17, 18 and 19). IV. Model Of Calculation: We have considerably increased our information on the departures of the observed energies from the I (I+1) rule in the spectra. In the absence of a successful microscopic theory attempts have been, and are being, made in the form of several two parameter and, lately, three parameter models based on semimicroscopic considerations for the description of these levels. Considering only the overall fits to the excitation energies, many of these models appear to offer practically the same degree of acceptability, and these existed no apriority reason to prefer one model to another. Here we show that a cubic polynomial (CP) in angular momentum, in addition to giving excellent fits to level excitation energies, which describe a new features brought into evidence by recent experiments. These features do not admit a satisfactory description in any of the other acceptable phenomenological approaches. We chose the excitation energies E (I) of the ground band levels in terms of a plot between the nuclear moments of inertia θ and the squared rotational frequencies ɷ2 by using the relation 2θ (I) /ћ2 (4I -2) / {E (I) – E (I-2)}and (Ћ ɷ )2 (I2 – I +1) [{E (I) – E (I-2)} / (2I-1)]2 Fig. (3): Experimental energies in 156 Er, 158 Er relative to a rigid rotational energy as a function of spin.
- 4. DescriptiveNew featuresof high angular momentum rotational states in some rear-earth nuclei www.iosrjournals.org 20 | Page Where the expressions on the right correspond on the middle of the spin interval between I and I-2. Such plots have revealed that in some cases θincrease so rapidly with I that ɷ2 actually decreases as higher spin states are reached resulting in the appearance ofbackbending in these plots. In a number of hard rotors the charge radius of the 2+ state is smaller than that of the 0+ state. This shrinkage is just opposite to the centrifugal stretching one expects for a rotating nucleus, since the rotation should cause the distribution to move out. Since the models are not capable of calculating the nuclear radii, we follow the concept that the nuclear moment of inertia θ provides a measure of the nuclear density distribution to the extent that at least the decrease (increase) in the value of θ from one spin state to another corresponds to the decrease (increase) in the distribution radius. Table (2) Comparison of the present work with experimental rotational energies and the predictions of VMI and CP formula. I 2 4 6 8 10 12 14 (2θ / ћ2 )exp. 18 26 34 38 46 82 - ( ћ2 ɷ2 )exp 0.04 0.08 0.12 0.16 0.17 0.11 - (2θ / ћ2 )CP 18 26 34 38 46 55 71 ( ћ2 ɷ2 )CP 0.04 0.08 0.12 0.16 0.175 0.175 0.150 (2θ / ћ2 )VMI 18 26 34 38 44 50 55 ( ћ2 ɷ2 )VMI 0.04 0.08 0.12 0.16 0.19 0.22 0.24 We define softness S as the fractional change in the moment of inertia between these two states:S = [θ(2) – θ(0)] / 2θ(0) Such that negative (positive) values of correspond to shrinkage (stretching). Also we discuss the results of the CP formula for the energy fits, the 2θ (I) /ћ2 - ( Ћɷ )2 plot characteristics, and the softnesspredictions for deducing shrinkage or stretching Fig. (4) and table (2) possible modification of the CP formula is presently being investigated. We obtain the following expression for the softness S = 2(a-b-3c) / (a+4b+12c) The denominator is found to be positive in all cases such that the CP formula predicts S to be negative. i.e. shrinkage for those nuclei for which a (b+3c). The calculations show this equation is satisfied only Fig. (4): The observed moment of inertia as a function as a function of the square of the angular velocity for the nucleus 132 Ce. for hard rotors. Figure (5) clearly shows how stretching (positive S values) evidenced in the case of soft rotors goes over into the shrinkage (negative S values) for hard rotors. The numerical values of S [Table (2)] cannot be compared quantitatively with the experimental results in the absences of an established relationship between moments of inertia and the charge radius, however. Our study is presently of value in pointing out the nuclei for which shrinkage is expected. Our calculations show that θ(I) θ(I-2) in all cases until the point of which the back bending is found.
- 5. DescriptiveNew featuresof high angular momentum rotational states in some rear-earth nuclei www.iosrjournals.org 21 | Page Fig. (5): Softness S parameter as a function of the energy ratio R4 for the nuclides in the isotopic sequence of Hafnium showing the gradual transition of stretching (positive S) into shrinkage (negative S). We have carried out a detailed analysis of the fits to the energy levels for several nuclei. Model parameters have been evaluated by means of a least square fit to the observed level energies. In practically all the cases the rms deviations of the calculated energies from the observed ones are well within the limits of the experimental uncertainties of the data, and the agreement with the experiment is one the whole better than achieved in any other phenomenological description. The quality of fits obtained by the CP formula (Ref.1) is compared with that obtained in the much proclaimed variable moment of inertia. Table (3): Percentage root-mean-square deviations calculated from the observed energies for the Xe, Ce, Dy, Er and Hf isotopes by using the VMI and CP formula. 120,122,124,126 Xe - Isotopes 128,130,132,134 Ce - Isotopes 154,156,158,160,162 Dy - Isotopes (rms- deviation)VMI .08 .09 1.04 .03 .08 .12 .44 .24 1.24 2.3 2.26 1.66 1.2 (rms- deviation)CP 1.2 1.2 1.4 90 .55 .85 .55 .75 .17 1.91 .91 .91 .75 160,162,164,166,168,170 Er- -Isotopes 168,172,174,176 Hf - Isotopes (rms- deviation)VMI 3.36 2.89 1.49 -.084 .09 .0024 .16 1.37 1.54 (rms- deviation)CP 12.5 4.74 2.33 1.54 -.73 11.82 3.44 1.11 1.38 0.8 1.2 1.6 2.0 2.4 2.8 -0.2 0.0 0.2 0.4 0.6 0.8 1.0 1.2 Shrinkage Steretching S R4 Hf - isotopes
- 6. DescriptiveNew featuresof high angular momentum rotational states in some rear-earth nuclei www.iosrjournals.org 22 | Page Fig. (6): Percentage root-mean-square deviations of the calculated from the observed energies for the VMI and Cubic polynomial model plotted for a few illustrative nuclides. Table (4): Relative accuracy of the two formula VMI and CP for the Er- isotopes. DE is the average deviation in energy per energy level tested. Isotopes Z N R4 DE(VMI) MeV DE(CP) MeV 156 Er 68 88 2.337 4.85 4.82 158 Er 90 2.798 9.94 9.75 160 Er 92 3.117 16.36 16.33 162 Er 94 3.237 20.99 20.67 164 Er 96 3.275 23.49 23.40 166 Er 98 3.283 26.52 26.62 168 Er 100 3.310 27.02 27.00 170 Er 102 3.277 26.99 27.02 (VMI) model in Fig. (6) and table (3) for a set of representative nuclei. Although the CP formula has one more free parameter than the VMI model, the improvement in the agreement is better than expected on this count alone, particularly for the not so deformed nuclei. Although the CP formula has one more free parameter than the VMI model, the improvement in the agreement is better than expected on this count alone, particularly for the not so deformed nuclei. In Fig. (4), the theoretical points are also calculated using the predicted transition energies (Ref.19). Thus the points fall in the middle of the spin interval I and (I-2) rather than at specific spin values. Prediction of back bending in Fig. (4) atIc = 12 by the CP formula while the VMI model is seen to be even poorer which showing the expected linear behavior. These general conclusions are illustrated for a set of largely rotational nuclei (Er isotopes) in table (4). For the Er isotopes, the assertions hold, except for the Fig. (7): R10Vs R4 for Er and Hf isotopes. Comparison of experiment with VMI model calculation
- 7. DescriptiveNew featuresof high angular momentum rotational states in some rear-earth nuclei www.iosrjournals.org 23 | Page Table (5): The energy ratio R4,R10 and the softness parameter S for theEr and Hf isotopes. Isotopes R4 R10 S Isotopes R4 R10 S 156 Er 2.34 1.34 .3850 157 Hf 1.17 - 0.98 158 Er 2.80 1.39 .1690 163 Hf 2.71 - -0.14 160 Er 3.12 1.43 .0550 164 Hf 2.780 1.380 - 162 Er 3.24 1.46 .0240 165 Hf 2.14 - -0.15 164 Er 3.28 1.48 .0120 166 Hf 2.946 1.402 - 166 Er 3.28 1.49 .0097 167 Hf 1.98 - -0.13 168 Er 3.31 1.51 .0052 168 Hf 3.106 1.430 - 170 Er 3.31 1.50 .0110 171 Hf 1.69 - -0.03 - 174 Hf 3.306 1.470 - - 175 Hf 1.51 - -0.03 - 176 Hf 3.300 1.480 - - 178 Hf 3.284 1.480 - best rotators, where the VMI seems to be optimal. Here we compare the experimental results (.) and the VMI results in the plot of R10 verses R4, where RJ = E (J) / E (2) Fig. (7) for the known Hf and Er isotopes. Another interesting feature of Fig. (8) Is the loss of collectivity with increasing angular Fig. (8): Quadrupole moment of the stretched E2 transitions between states of the yrast band versus I for 158 Er nuclei. momentum in the ground state band and the s-band, the quadrupole deformation β2 of an axially symmetric nucleus were converted to Qt using the expression Qt = 0.00109ZA2/3 β2 (1 +0.36 β2). No structural change between the states linked by the E2-transition is included in the last equation. V. Conclusions: In this paper we conclude that from the points of view of range of applicability, degree of fits to transition energies, and the high angular momentum behavior, straight forward angular momentum expansion gives better results than expansion in terms of squared angular velocity. For the highest spin states in 168 Hf of bands 1, 2 and 4 a smooth down-sloping in γ-ray energies appears in the nucleus. This behavior can be understood is a band termination (or shape change). The most important of this work is that the I (I=1) dependence in the variable moment of inertia and the cubic polynomial formula which is exactly valid only in the rotational region. The irregularity of the ground state band in terms of a shape change by coexisting minima differing from the ground state band mainly through the occupation of non-aligned h9/2 orbital. The calculated Qt against angular momentum is pointed out. A reliable prediction of critical spin or of shrinkage has not been achieved in any other phenomenological approach so far; these predictions are expected to provide valuable guidelines as well as stimulus for further experimental investigations in this field.
- 8. DescriptiveNew featuresof high angular momentum rotational states in some rear-earth nuclei www.iosrjournals.org 24 | Page REFERENCES: [1]. N.A. Mansour and A.M. Diab Indian J. Phys.77A (4)377(2003). [2]. N.A. Mansour, Arab J. Nucl. Sci. Appl. Vol.39 No.3, 200(2006). [3]. N.A. Mansour, Int.J. Nan electronics and materials 2, No.1, 91(2009). [4]. N.A. Mansour, Bulg. J. Phys. 35(2008)182 – 190. [5]. N.A. Mansour, and A.M. Diab Indian J. Phys. 77A (3)289 – 291(2003). [6]. N.A. Mansour, and A. Farhan Arab J. Nucl. Sci. Appl. Vol.38 part I, 83(2005). [7]. Z. Xing, I Ragnarsson and T. Bengtsson Phys. Letts.B177 (1986)265. [8]. N.A. Mansour, and A. M. Diab Arab J. Nucl. Sci. Appl. Vol.34 part I, 257(2001). [9]. M. Guttormen and H. Hubel, Nucl. Phys. A380 (1982)502. [10]. M. Guttormen, Y.K. Agarwal,C. Gunther,K. Hardt,H. Hubel,A. Kalbus, R.Kroth, G. Mikus, J. Recht and P. Schuler, Nucl. Phys. A383 (1982)541. [11]. M. Guttormen, A.V. Grumbkow, Y.K. Agarwal, K.P. Blume, K. Hardt, H. Hubel, J. Recht, P. Schuler, H. Kluge, K.H. Maier, A. Maj and N. Roy, Nucl. Phys. A398 (1983)119. [12]. H. Helppi, S.K. Saha, P.J. Daly, S.R. Faber and T.L. Khoo, Phys. Rev. C28(1983)1382. [13]. M. Guttormen, K.P. Blume, Y.K. Agarwal, A.V. Grumbkow, K. Hardt, H.Hubel, J. Recht and P. Schuler, Z. Phys. A312(1983)155. [14]. R.V.F. Janssens, P.C. Chowdhury, H. Emling, D. Frekers,T.L. Khoo, W. Kuhn, P.J. Daly, Z.W. Grabowski, M. Kortelahti, S. Frauendorf and J.Y. Zhang, Phys. Lett. 131B (1983)35. [15]. H. Toki, K. Neergard, P. Vogel and A. Faessler, Nucl. Phys. A279 (1977)1. [16]. I. Ragnarsson, T. Bengtsson, W. Nazarewicz, J. Dudek and G.A. Leander, Phys. Rev. Lett. 554(2009)982. [17]. F.S. Stephens, M.A. Deleplanque, R.M. Diamond, A.O. Macchiavelli and J.E. Draper, Phys. Rev. Lett. 54(1985)2584. [18]. H. Hubel, A.P. Byrne, S. Ogaza, A.E. Stuchberg and G.D. Dracoulis, M. Guttormsen, Nucl. Phys. A453 (1986)316 – 348. [19]. N.A. Mansour, Arab J. Nucl. Sci. Appl. Vol.34 part II 337(2001).