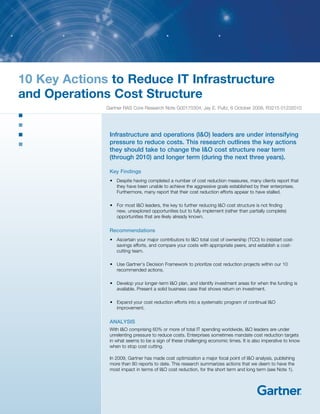
10 Key Action to Reduce IT Infrastructure and Operation Cost Stucture
•
1 j'aime•1,370 vues

With NetApp, we have realized major cost savings in terms of our storage and server infrastructure. This has allowed us to catch up with other colleges and universities that compete with us by freeing up budget to invest in classroom technologies.”

Recommandé
Recommandé
Contenu connexe
Tendances
Tendances (20)
Similaire à 10 Key Action to Reduce IT Infrastructure and Operation Cost Stucture
Similaire à 10 Key Action to Reduce IT Infrastructure and Operation Cost Stucture (20)
Plus de Icomm Technologies
Plus de Icomm Technologies (20)
Dernier
Dernier (20)
10 Key Action to Reduce IT Infrastructure and Operation Cost Stucture
- 1. 10 Key Actions to Reduce IT Infrastructure and Operations Cost Structure Gartner RAS Core Research Note G00170304, Jay E. Pultz, 6 October 2009, R3215 01232010 Infrastructure and operations (I&O) leaders are under intensifying pressure to reduce costs. This research outlines the key actions they should take to change the I&O cost structure near term (through 2010) and longer term (during the next three years). Key Findings • Despite having completed a number of cost reduction measures, many clients report that they have been unable to achieve the aggressive goals established by their enterprises. Furthermore, many report that their cost reduction efforts appear to have stalled. • For most I&O leaders, the key to further reducing I&O cost structure is not finding new, unexplored opportunities but to fully implement (rather than partially complete) opportunities that are likely already known. Recommendations • Ascertain your major contributors to I&O total cost of ownership (TCO) to (re)start costsavings efforts, and compare your costs with appropriate peers, and establish a costcutting team. • Use Gartner’s Decision Framework to prioritize cost reduction projects within our 10 recommended actions. • Develop your longer-term I&O plan, and identify investment areas for when the funding is available. Present a solid business case that shows return on investment. • Expand your cost reduction efforts into a systematic program of continual I&O improvement. ANALYSIS With I&O comprising 60% or more of total IT spending worldwide, I&O leaders are under unrelenting pressure to reduce costs. Enterprises sometimes mandate cost reduction targets in what seems to be a sign of these challenging economic times. It is also imperative to know when to stop cost cutting. In 2009, Gartner has made cost optimization a major focal point of I&O analysis, publishing more than 80 reports to date. This research summarizes actions that we deem to have the most impact in terms of I&O cost reduction, for the short term and long term (see Note 1).
- 2. 2 1.0 Getting Started in I&O Cost Structure Reduction Clients report that they have completed, or have under way, a number of cost reduction projects. However, many view their efforts as insufficient and are concerned that they will exceed their budgets for this year. Others find that their cost-savings efforts have stalled. Having exhausted the achievable targets, they are stymied as to where to find additional cost savings. Figure 1. Typical Distribution of IT Costs Data Center 21% Non-I&O IT Costs 40% Network 16% Before launching (or relaunching) a cost containment initiative, it’s important to undertake some preparatory steps. 1.1 Understand Your I&O Expenses Figure 1 shows the high-level cost structure of a typical enterprise IT department’s budget. I&O comprises about 60% of the total IT annual spending, with the data center comprising the largest percentage of I&O costs. These percentages are based on Gartner IT Key Metrics Database (ITKMD) as of 15 December 2008. Excluded from “network” are data center network costs, which are included in “data center.” ITKMD excludes wireless costs, which add about 20% to the total IT costs. “Non-I&O IT costs” include business application development, procurement and support. Since enterprises sometimes treat application support within applications or I&O, we have taken 50% of application support in the ITKMD and assigned it to the support cost within I&O. All cost elements are defined in the ITKMD. ITKMD does not include indirect costs, such as costs borne by end users. Network costs in particular are likely under-reported in the ITKMD, because ITKMD represents costs that CIOs and their staff identify. Often, business units pay for their own telecom expenses to communications carriers (like AT&T), and the IT organization has little visibility into these costs. Examine costs in greater detail than what is presented in Figure 1. For example, data center costs include servers, storage, networks and related hardware, software and services, along with facility, power and cooling. Server costs can be divided into hardware, software, service (such as maintenance), and personnel, as well as other costs such as allocated facility costs. The idea of breaking down costs is to ascertain additional cost structure reduction opportunities. For each element, ask: “Have we taken actions that will reduce this cost? Are there additional opportunities we have to reduce this cost? Can we lower expenditures in this element to free up spending for another area?” Management 4% Support 8% Client 11% Source: Gartner (October 2009) Gartner pioneered the TCO view of IT expenditures, and TCO remains a significant tool in major cost containment efforts. TCO provides a consistent context and structure for analyzing costs and the likely impact of action taken to impact these costs. About 40% of Gartner clients do not have costs broken down in sufficient detail to identify savings opportunities; however, it is imperative that they drill down to these details. It is not necessary to spend months collecting data here; 20% of the assets usually account for 80% of the costs. Identify these high-profile assets and their associated cost elements. Use Gartner’s ITKMD to fill in cost knowledge gaps, as an interim step. Assess cost opportunities with this first cut, and assign staff to continue more-detailed cost data collection while pursuing cost containment opportunities. Keep to a common reference point for cost-savings projects to understand the impact that a given cost-savings project will have relative to other potential projects. A 20% cost savings has no real meaning unless it is tied to a common reference point. We use the percent of cost structure reduction in I&O costs as that common reference point. 1.2 Compare Your Costs to Those of Peers To assess and analyze costs, compare your costs to your peers. If a particular I&O cost element is higher than that of a peer, then that result does not automatically identify a cost reduction opportunity. There may be business model differences that provide a strong © 2009 Gartner, Inc. and/or its Affiliates. All Rights Reserved. Reproduction and distribution of this publication in any form without prior written permission is forbidden. The information contained herein has been obtained from sources believed to be reliable. Gartner disclaims all warranties as to the accuracy, completeness or adequacy of such information. Although Gartner’s research may discuss legal issues related to the information technology business, Gartner does not provide legal advice or services and its research should not be construed or used as such. Gartner shall have no liability for errors, omissions or inadequacies in the information contained herein or for interpretations thereof. The opinions expressed herein are subject to change without notice.
- 3. 3 at a platform level with peers, make sure to compare results with similar parameter values. This ITKMD platform data can also be used as a proxy for your actual costs until you can ascertain those costs. Figure 2. Macrolevel Cost Example $14,900 Macrolevel Example I&O annual cost per employee $7,800 $2,300 Insurance 1.2.3 Going Beyond ITKMD Industry Average Metals/Natural Resources Source: Gartner (October 2009) Figure 3. Microlevel Cost Example $38,700 View peer comparisons with the ITKMD as a first-level comparison with peers, not a substitute for a comprehensive benchmarking study. An I&O benchmarking engagement can take three months or longer, depending on the size and complexity of the organization. Benchmarking will determine why an IT organization’s cost is above or below industry averages or comparable IT organizations, and it can pinpoint areas of cost optimization. Targets often found at this point concern platform maintenance and software licenses. <50 servers 1.3 Form a Cost-Cutting Team Microlevel Example Wintel servers Annual cost per server $16,700 $12,000 <150 servers >250 servers Source: Gartner (October 2009) rationale for the higher cost. (Often, we find geographic extent is a major reason for differences.) In the absence of such differences, then you have identified a cost reduction target. Cost comparisons with peers should be done at macrolevels and microlevels. 1.2.1 Macrolevel Cost Comparisons The ITKMD enables you to examine metrics such as I&O expense per employee or as a percentage of revenue. Figure 2 displays I&O costs per employee for several industry sectors. (Within the ITKMD, data has been captured for 17 industry sectors.) The variation in cost by sector points out that any macrolevel comparisons you do must be by sector peer group. 1.2.2 Microlevel Cost Comparison The ITKMD also enables you to examine costs for individual platforms (ITKMD captures costs for 13 I&O platforms). Figure 3 displays “Windows/Intel” (“Wintel”) server costs as a function of the number of such servers located on one location. Note the strong economies of scale – as the number of servers increases, the cost per server drops dramatically. (For each platform included in the ITKMD, we show the cost as a function of those parameters that primarily change the cost structure.) When comparing your costs To maintain a focus on cost cutting, address opportunities systematically, ensure proper resources and establish a task force. The task force should be comprised of key staff members, each of whom brings unique talents and perspectives to the project. A best practice is to have a well-respected manager lead the team. You will also need a team member who is adept at financial analysis and steeped in the financial processes of your enterprise. We’ve identified guidelines for the team: • Maintain communications with the business to stay abreast of changing business initiatives. There may be deferrals that lead directly to an I&O project under way. • Define cost-cutting goals and project timelines at the outset. • Establish a rapid approval process. Each month that you delay is 8% lost in savings for a given year. • Meet weekly, maintaining pressure to move forward and identify new cost-cutting opportunities. • Assign leads on specific projects to team members, based on their areas of expertise. 1.4 Evaluate Cost Optimization Ideas Gartner has created a concise decision framework to help prioritize cost optimization techniques. This framework considers not only the potential benefit (in terms of cash savings), but also the impact on customers, time requirements, degree of organizational and technical risk, and investment required (see Figure 4 and “Decision Framework for Prioritizing Cost Optimization Ideas”).
- 4. 4 Figure 4. Gartner Decision Framework for Prioritizing Cost Optimization Initiatives Potential Benefit Customer Impact Payback Period Organizational Risk Technical Risk Investment Requirement % savings % savings % savings Negative None Positive >18 months 6 to 18 months <6 months Staff redundancies Re-engineering of processes and structures Limited changes in roles, structures and processes No staff reduction, nor changes in organization and processes Impacts I&O and applications Moderate impact on few components Little more than "moving boxes" High Moderate Low Source: Gartner (October 2009) 2.0 10 Steps to Reduce I&O Cost Structure We have identified 10 key actions that I&O leaders should take to reduce their I&O cost structure. 2.1 Renegotiate Major Contracts Start with contracts with communications – telecommunications service providers (TSPs), such as AT&T, BT and Verizon. Unless you initiate significant outsourcing, these contracts are likely the largest within I&O and, for that matter, within IT. These contracts are huge, multiyear arrangements, often involving millions of dollars per year. Our ITKMD indicates that the average enterprise spends about $1,000 per employee annually on the wireline voice and data services that carriers provide. a contract that the IT organization administers. Consolidating these expenditures and contracts can often result in substantial savings. • Develop your renegotiation strategy. Often a “rewards and losses” approach works well: offer a reward, such as extending the term of a contract, or use a loss, such as discussing the idea of providing some business to a competitor. • Consolidate TSPs and combine services to achieve greatest volume discounting. Today, one can typically consider combining voice/data, local/intrastate/interstate/international, and wireline/wireless. Caution: Most enterprises are best served by having at least two TSPs. Action Items: • Determine whether the rates in your contracts are in line with current market conditions. Rates have been dropping substantially over the last several years. For example, Multiprotocol Label Switching (MPLS) port rates dropped 40% in a six-month period in 2009. Unless you have renegotiated your contracts within the past six months, it is likely that you are paying more than the market will bear. If you have Gartner inquiry privileges, then we can provide a quick market rate check for you. • Review contracts to determine whether they can be reopened for negotiation. Most TSP contracts can be reopened at anytime for reasonable cause, such as current market conditions. Determine what, if any, significant expenditures and contracts exist within the enterprise that are not part of • Consider Tier 2 TSPs for at least some of your business to achieve more savings. Examples of TSPs are Qwest, Global Crossing and XO Communications. • Work quickly. Since network service expenses are incurred monthly, each month of delay could result in 8% in lost savings for the fiscal year. TSP contracts are not the only major contracts in I&O. For example, there are maintenance contracts for most major hardware platforms (such as servers and telephone systems), software licensing agreements and volume discount purchase plans. Assemble a database of major contracts and review which ones to tackle by analyzing their size, time to termination, the ease with which the contract can be reopened and your negotiating leverage.
- 5. 5 2.2 Defer Noncritical Key Initiatives I&O leaders need to decide which key initiatives to advance, and at what resource level. For each I&O key initiative, we advise: • Virtualization/consolidation should continue, because it has the largest cost-savings potential of all the key initiatives. However, projects within this key initiative are likely to be deferred based on investment and payback constraints. • Modernization upgrades should be deferred that do not directly support application upgrades and business initiatives, or that do not result in immediate cost savings. Some of these projects may be candidates for early restarts, when funding and other resources are available; delaying modernization can result in disproportionately higher support costs for the legacy systems involved. • Microsoft migrations should be reevaluated. At this point, many clients are skipping Windows Vista and waiting until 2010, at the earliest, to upgrade to Microsoft Windows 7. rest of I&O. We suggest that I&O leaders examine the potential for consolidation projects in other I&O systems, which include: • Mainframes. Utilize the mainframe as a “supersized” server consolidation platform. • Storage systems. Move additional storage capacity to network-attached storage/storage area network wherever possible. • E-mail/messaging. Integrate and evolve to unified communications. • Middleware. Standardize and consider an enterprise service bus. • IT operations systems. Move toward a configuration management database (CMDB) and run book automation. • Security systems. Integrate platforms. • Green IT/I&O projects should be deferred that do not lead to resolving power/cooling capacity or short-term cost issues. • For Information Technology Infrastructure Library (ITIL)/process improvement, focus primarily on process improvement projects that are not capital-intensive and purchase only essential tools, such as IT asset management (ITAM) software. • Consider stretching out voice over IP (VoIP) implementation, and only go forward with unified communications aspects that are directly tied to business initiatives or reduced costs. • For remote/mobile workers, consider deferring smartphone upgrades and other productivity enhancements. Only invest where cost savings can be clearly demonstrated, such as in downsizing real-estate holdings. 2.3 Consolidate I&O Typically, to cut costs, I&O leaders focus their consolidation efforts on data centers and servers. If you have not substantially completed (75% or more) implementing your consolidation opportunities in these areas, then you should make it a high priority. Clients often report reducing I&O cost structure more than 20% via consolidation. In these consolidations (data centers and servers), consider related storage and network systems. Although consolidation is difficult and consumes considerable time and resources, it has the biggest impact on improving the I&O cost structure. The reason is that consolidation touches a larger part of the overall I&O costs than any other cost reduction action that we have identified. Gartner surveys indicate that more than 80% of respondents have major projects planned, under way, or completed data center and server consolidation; 60% have done so when it comes to the • Data center networking. Adopt terabit switching and move toward an all-Ethernet solution. • Branch offices. Relocate office functionality to data centers. • Metropolitan-area network/WAN. Converge to an IP network. • Client devices. Adopt a “managed diversity” strategy. Our best practices with regard to I&O consolidation include: • Develop an overall, systematic plan to consolidate infrastructure. Detailed implementation plans are key to success. • Consider all major IT infrastructure systems. Consolidation involves not only hardware, but also software and services. Approaches vary by system. • Do not overconsolidate vendors. • Justify consolidation by business need; recognize that reducing costs is just one of those needs. Set realistic expectations. • Realize consolidation is not a “one-off” project. • Continually improve infrastructure; full virtualization follows consolidation. 2.4 Virtualize I&O Virtualization continues to be the highest-impact I&O change and will remain so at least through 2012. Focus on x86 servers.
- 6. 6 Figure 5. Example Cost Savings From Virtualization Traditional Year 1 Year 2 Year 3 Year 4 Power Costs $1,010,263 $1,080,982 $1,156,650 $1,237,616 Capital Costs $0 $152,880 $316,462 $491,494 Total $1,010,263 $1,233,862 $1,473,112 $1,729,110 Virtualized Year 1 Year 2 Year 3 Year 4 Floor Space Saved -1530 -126 -114 -120 Capital Costs $492,069 $337,976 $361,635 $386,949 Power Costs $181,908 $194,642 $208,267 $222,845 Total $673,977 $532,618 $569,901 $609,794 Savings ($336,287) ($701,244) ($903,211) ($1,119,316) Savings = 64% Source: Gartner (October 2009) Virtualization technology offers the prospect of a several-fold increase in server utilization. This higher utilization results in the need for fewer servers to handle a given workload. And fewer servers mean lower costs in servers and related issues. The example in Figure 5 shows how dramatic this cost savings can be. Several observations and comments are in order: • In this example, about 90% of the cost savings is derived from savings in power. Although power is typically not in the IT budget, it is a major cost savings to the enterprise. • Virtualization will not always save money; therefore, you must carefully consider all the savings and costs involved. • Not all servers can be virtualized, even if you restrict yourself to x86 servers. • Clients report substantial issues with scaling virtualization up and out, as compared with initial, smaller and more-controlled implementations. Most likely, you will need to augment the management tools provided by the major vendors (such as VMware and Microsoft) with other tools. • To gain best advantage from virtualization, your I&O environment needs to be reasonably rationalized and consolidated. 2.5 Reduce Power and Cooling Needs In a conventional data center, as much as 50% of the electrical energy consumed is used for cooling versus 15% in best-practice (“green”) data centers. This enormous waste of energy (literally millions of kilowatt hours) could be conserved by taking steps such as: • Separating the cold supply air and the hot exhaust air • Reducing fan speeds to save electricity • Using the natural cooling provided by the outside atmosphere to the greatest extent allowed by local climatic conditions • Implementing modular cooling designs in new data center construction Gartner has created a large body of research on this subject. A good place to start concerning our detailed recommendations is with “How to Save a Million Kilowatt Hours in Your Data Center” and “Toolkit Best Practice: Practical Steps You Can Take Now for Power and Cooling Issues.” 2.6 Control Storage Data Growth Compute, networking and storage capacity are all growing at annual double-digit rates, with storage growing the fastest by far. We predict that, by 2012, users will install 6.5 times the amount of terabytes that they installed in 2008. With storage costs per terebyte dropping rapidly, I&O leaders recently have “thrown
- 7. 7 capacity at the problem”; however, growth in capacity need is far outstripping cost declines using this conventional approach. No I&O resource needs to be brought under tighter cost control than storage. To accomplish this, I&O organizations should adopt multiple strategies and techniques, including: • Employ storage virtualization and thin-provisioning. This set of technologies can improve storage utilization by 20% or more so that storage becomes a more efficient resource (utilization rates in the 65% to 80% range are possible). • Deduplicate data. Where applicable, data deduplication results in disk capacity reductions from one-third to 1/25 of the original physical disk requirement. • Compress online data where possible. Compression typically reduces needed storage capacity by a ratio of 2-1 or 20-1. • Exploit the Internet Small Computer System Interface (iSCSI) protocol. The potential savings is up to $3,500 per server, compared to Fibre Channel. Most deployment barriers have been removed in today’s iSCSI technology. • Employ professional services. A typical $50,000 to $100,000 investment in a storage professional service engagement can free up wasted storage capacity and improve storage efficiency, potentially avoiding millions of dollars in hardware acquisition. For further information, see “Best Practices for Lowering Your Storage Costs” and “Optimize Costs by Implementing Storage Strategies and Tools.” 2.7 Push Down IT Support Support for end users and the enterprise typically is about 4% of total IT spending (exclusive of application support). Most I&O organizations have at least four tiers of support, each with a different cost point and level of expertise. To reduce costs, drive those support calls down to the lowest (and least expensive) tier that can satisfactorily resolve users’ issues. Issues currently being resolved by Level 3 subject matter experts can be resolved by Level 2 technicians, issues resolved at Level 2 can be resolved by Level 1 analysts, and issues resolved at Level 1 can be moved to Level 0 self-service. The results will be a lower total cost per enduser contact and fewer escalations, which will shorten resolution times and increase end-user satisfaction. Table 1 illustrates the dramatic differences that can be achieved. Gartner’s ITKMD can be of particular help to I&O organizations that are analyzing and assessing IT service desk cost savings opportunities, and can help prevent the organizations moving in directions that actually increase I&O cost structure. For example, many clients report having to reduce Level 1 service desk personnel to meet head count reduction targets. However, such reductions can increase costs since that workload now must be performed by higher tiers, which have a much higher transaction cost. • Back up less data, perform backups less frequently and retain backup data for shorter periods of time. In “Backup and Recovery Optimization and Cost Avoidance,” we offer 15 specific recommendations that can help you achieve these goals. • Ensure that your company’s vital records program is correct and current. Some records must be kept for a long time, but many should be deleted once they are no longer needed. There could be legal liability associated with keeping unnecessary data. • Use storage resource management (SRM) tools more effectively. SRM products can find underutilized capacity and noncritical data that can be moved to less-expensive storage; six-month payback periods can be achieved. 2.8 Streamline IT Operations One of Gartner’s seven I&O key initiatives is ITIL and process improvement. This key initiative entails systematically formalizing day-to-day and tactical processes, and is heavily centered around the ITIL framework. The principal goal of this key initiative is to Table 1. IT Service Support: Higher- and Lower-Cost Scenarios Higher-Cost Scenario Lower-Cost Scenario Cost per Transaction Level 3 Strategic Staff Resource Outage Application Support Outage $100 to $500 Level 2 Technical Staff Resource System Administration Break/Fix Application Support System Administration $35 to $250 Level 1 Service Desk Analyst Resource How-to Password Resets Break/Fix $10 to $37 Level 0 Intranet/Internet Self-Service How-to Password Resets $1 to $410 Source: Gartner (October 2009)
- 8. 8 improve the quality of IT services provided to the IT organization’s customers. However, it can lower costs as well in several ways. These include: • Populate tools with major assets. • Reduction in IT operations staff to perform a given workload via: (1) improved efficiencies and economies of scale, and (2) significantly fewer errors made in day-to-day processes, such as change. One client reported reducing head count in IT operations by more than 10%, and reduced salary grades for certain functions. Coupled with using offshore providers for back-office processes and functions, the company total I&O cost reductions were more than 10%. ITAM provides the data to make key decisions that can reduce costs. We advocate, at a minimum, that you get your major assets in the ITAM system first. You can then: • Staff an IT asset manager position. • Determine the life of certain assets, defer upgrades, and eliminate or combine software licenses. • Replace maintenance contract with time materials approach. • Leverage standardized frameworks and tools, reducing the need to “reinvent the wheel.” • Ability to use a larger number of IT professionals with lower skill set levels, since significant amounts of the process work has been reduced in complexity. • Potential to consolidate and integrate “siloed” operations centers (such as data center and network operations), since the processes in both domains can now be common. • Improved ability to outsource or offshore certain processes (especially those that are offline), since the demarcations and interfaces among processes, as well as the work definition for the external provider, are well-defined. External providers also primarily adhere to de facto standards, such as ITIL. The costs that can be reduced are primarily staff-related. Since the required capital investment is relatively small, compared with other high-payoff I&O cost reduction actions, there is a keen interest here, especially in these capital expenditure (capex)-constrained times. However, several cautions are in order, particularly: • Resist “slash x% of staff” mandates. • If staff has to be cut, then examine costs, necessary skills and service-level impact; avoid head count-based cuts. Service desk personnel are often laid off to meet head count reductions. However, the cost per transaction now actually increases because a higher mix of higher support tier personnel is required – and service quality is noticeably degraded, especially for response times. • Assess ITAM processes to identify gaps in process, policy, tools and staffing affected by virtualization. • Invest in telecom expense management software and/or services. 2.10 Optimize Multisourcing I&O leaders tend to view external sourcing as the enemy. I&O has become so complex and the set of tasks so numerous that even the largest enterprises can no longer take on all of I&O with only internal resources. The key is not to look at sourcing all of I&O externally or internally, but to assess sourcing decisions based on aspects of I&O. For several years, Gartner has advocated a multisourcing approach in which certain functions, processes or platforms are externally sourced to a manageably small set of external service providers. The key decision criteria involves controlling those aspects that are of strategic and critical importance to the business, playing to the strengths of available staff, defining clear lines of demarcation, keeping the number of vendors involved to a small, manageable number, and finally, determining what makes solid financial sense. For our purposes, you want to focus on those aspects of I&O where external sourcing will reduce costs – primarily by having an economies of scale advantage. Clients tell us that these aspects include: • End-user device life cycle management: desktops, laptops, smartphones and the like • I&O maintenance and repair • Streamlining IT operations is a multiyear effort. • Mainframe operations management 2.9 Enhance ITAM • Service desk (Tier 1 support) A recent Gartner survey shows that only about 30% have completed ITAM implementation, while 40% are in the process of implementing ITAM. If you do not as yet have an effective ITAM program, then: • Offline functions and processes: telecom expense management, ITAM and CMDB • Procure basic ITAM tools.
- 9. 9 3.0 Evaluating the 10 Cost-Cutting Actions Note 1 Our analysis of these actions indicates that full implementation will achieve significant savings – about 10% through 2010, and 25% or more during the next three years. Cost Structure Reduction and Cost Reduction Basic demands for compute, storage and network capacity continue to grow at double-digit rates, which vary widely by enterprise; therefore, we need to focus attention on reducing the cost per equivalent CPU, terabytes stored, or megabits per second of bandwidth utilized. The actions we suggest will reduce costs relative to a baseline (workloads kept constant); however, costs may not actually be reduced going forward from that baseline in situations where there is very high growth required in I&O capacity. We will, at times, refer to “cost structure reduction” as “cost containment.” Source: Gartner (October 2009) In Figure 6, we evaluate the 10 actions using the methodology already discussed. We use a simple “stoplight” approach (red, yellow, green) to assess the impact of the 10 actions. This simple impact assessment will help you decide what actions to target first – that is, areas with little or no impact (and investment), and with relatively quick payback. 4.0 Looking Beyond Cost Cutting Reduction of cost structure will always be a goal of I&O leaders; however, with signs that the current economic crisis is easing, it is necessary for I&O leaders to plan for a return to growth. Make no mistake: When more funding becomes available, you must be ready. Take the time now – when there is somewhat of a lull due to lowered activity levels and deferred key initiatives – to develop or refine your I&O strategic plan. Not having a long-term view of where they are heading is one of the major failings of most I&O leaders. In polls we have conducted, only 15% of I&O leaders indicate that they have an effective strategic plan. Yet, such a plan can be the basis for funding key initiatives, and can significantly enhance I&O/ business alignment. For most IT I&O organizations, however, strategizing will include an annual, incremental refinement and updating process to an in-place multiyear plan. Either way, the outcome will be a fully communicated and distributed multiyear I&O plan in sufficient detail that defines annual plans and projects. Lastly, the Gartner I&O Maturity Model (IOMM) can help I&O leaders develop a systematic, prioritized road map for continual I&O improvement. The IOMM is built on the four key I&O dimensions of process, people, technology and business management. The tool enables users to assess maturity in all or any of the four dimensions – and by key attributes of those dimensions (for example, “skills” is one of the attributes of the people management dimension) and develop a customized road map. Contributors to this research: Patricia Adams, David Cappuccio, David Coyle, Valdis Filks, Ed Holub, Kurt Potter and Phil Redman Figure 6. Evaluating the 10 Cost-Cutting Actions e t a i t o g e n e R Cost Savings s t c a r t n o C ST 3% LT 5% y e K r e f e D 5% 0% s e v i t ia t i n I O & I e t a d il o s n o C O & I e z li a u t ir V 2% 10% 3% 10% e c u d e R 2% 5% g n il o o C & r e w o P e g a r o t S l o r t n o C 2% 5% h t w o r G n w o D h s u P 0% 2% t r o p p u S e s in n l io mt a a r e r e t p S O 2% 10% M A T I e c n a h n E 1% 3% e c e r z u i o ms it ilt p u OM 0% 5% Customer Impact Payback Org. Risk Technical Risk Invest Source: Gartner (October 2009)