How Illegal Immigration Is Sending Schools Into The Red
•
1 j'aime•504 vues

All of our children—native-born and immigrants alike—are receiving a poorer education as a result of the federal government passing its immigration law enforcement failures on to the states. The implications for the coming generations of workers, our future economy, and our long-term competitiveness in the world cannot be ignored.

Recommandé
Contenu connexe
Dernier
Dernier (20)
En vedette
En vedette (20)
How Illegal Immigration Is Sending Schools Into The Red
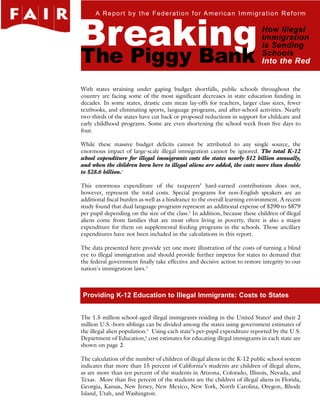
- 1. Breaking A Report by the Federation for American Immigration Reform How Illegal The Piggy Bank Immigration Is Sending Schools Into the Red With states straining under gaping budget shortfalls, public schools throughout the country are facing some of the most significant decreases in state education funding in decades. In some states, drastic cuts mean lay-offs for teachers, larger class sizes, fewer textbooks, and eliminating sports, language programs, and after-school activities. Nearly two-thirds of the states have cut back or proposed reductions in support for childcare and early childhood programs. Some are even shortening the school week from five days to four. While these massive budget deficits cannot be attributed to any single source, the enormous impact of large-scale illegal immigration cannot be ignored. The total K-12 school expenditure for illegal immigrants costs the states nearly $12 billion annually, and when the children born here to illegal aliens are added, the costs more than double to $28.6 billion.1 This enormous expenditure of the taxpayers’ hard-earned contributions does not, however, represent the total costs. Special programs for non-English speakers are an additional fiscal burden as well as a hindrance to the overall learning environment. A recent study found that dual language programs represent an additional expense of $290 to $879 per pupil depending on the size of the class.2 In addition, because these children of illegal aliens come from families that are most often living in poverty, there is also a major expenditure for them on supplemental feeding programs in the schools. Those ancillary expenditures have not been included in the calculations in this report. The data presented here provide yet one more illustration of the costs of turning a blind eye to illegal immigration and should provide further impetus for states to demand that the federal government finally take effective and decisive action to restore integrity to our nation's immigration laws.3 Providing K-12 Education to Illegal Immigrants: Costs to States The 1.5 million school-aged illegal immigrants residing in the United States4 and their 2 million U.S.-born siblings can be divided among the states using government estimates of the illegal alien population.5 Using each state’s per-pupil expenditure reported by the U.S. Department of Education,6 cost estimates for educating illegal immigrants in each state are shown on page 2. The calculation of the number of children of illegal aliens in the K-12 public school system indicates that more than 15 percent of California’s students are children of illegal aliens, as are more than ten percent of the students in Arizona, Colorado, Illinois, Nevada, and Texas. More than five percent of the students are the children of illegal aliens in Florida, Georgia, Kansas, New Jersey, New Mexico, New York, North Carolina, Oregon, Rhode Island, Utah, and Washington.
- 2. Page 2 Estimated Costs of Educating Federation for American Immigration Reform Illegal Alien Students and U.S.-Born Children of Illegal Aliens in 2004 (in $ millions) Illegal Alien U.S.-Born Children State Total Defenders of illegal aliens assert that the cost of Students of Illegal Aliens educating illegal alien students is offset by the taxes California 3,220.2 4,508.3 7,728.5 paid by their parents, but study after study shows Texas 1,645.4 2,303.6 3,949.0 that immigrants cost taxpayers much more in public New York 1,306.3 1,828.9 3,135.2 services used than they pay into the system via Illinois 834.0 1,167.6 2,001.7 taxes.7 This is particularly true of illegal immigrants, New Jersey 620.2 868.2 1,488.4 who are disproportionately low-skilled and thus Florida 518.1 725.3 1,243.4 low-earning and are much more likely to be Georgia 396.7 555.3 952.0 working in the underground economy or providing North Carolina 321.3 449.8 771.1 contractual services and not withholding taxes. Arizona 311.8 436.5 748.3 Colorado 235.0 329.1 564.1 A look at the top ten highest state expenditures Washington 228.9 320.5 549.4 provides a stark illustration of the trade-offs for Massachusetts 206.0 288.5 494.5 accommodating large-scale illegal immigration:8 Virginia 188.7 264.2 452.9 In California, the $7.7 billion spent annually educating Oregon 167.4 234.4 401.8 the children of illegal immigrants—nearly 13% of the Michigan 135.4 189.5 324.9 overall 2004–5 education budget—could: Nevada 133.8 187.3 321.1 • Cover the education budget shortfall for the Maryland 117.0 163.8 280.8 2004-05 school year, estimated by the Minnesota 115.2 161.3 276.6 Legislative Analyst Office at $6 billion and Pennsylvania 99.9 139.9 239.9 nearly cover the $2 billion reduction this Connecticut 95.2 133.3 228.5 year from the Proposition 98 formula. Indiana 85.9 120.3 206.2 Wisconsin 83.9 117.5 201.4 • Or, the remaining $1.7 billion could pay the Kansas 80.2 112.3 192.5 salaries of about 31,000 teachers and reduce Utah 76.8 107.6 184.4 per student ratios, or it could furnish 2.8 Ohio 76.3 106.9 183.2 million new computers—enough computers Oklahoma 67.1 94.0 161.1 for about half of the state’s students. Tennessee 65.0 91.0 156.0 New Mexico 63.8 89.3 153.2 • Prevent educational shortfalls estimated at South Carolina 59.8 83.7 143.5 $9.8 billion over the past four years that Nebraska 43.4 60.7 104.1 have impacted on “…class size, teacher Iowa 41.3 57.8 99.1 layoffs, shorter library hours and fewer Arkansas 37.3 52.2 89.5 groundskeepers.” (See Los Angeles Times, counselors, nurses, custodians and Missouri 36.8 51.5 88.3 Rhode Island 36.4 51.0 87.4 March 11, 2005) Alabama 34.4 48.1 82.5 In Texas, the $3.9 billion spent annually educating the Idaho 27.3 38.2 65.5 children of illegal immigrants could: Delaware 22.4 31.4 53.8 Kentucky 21.5 30.1 51.7 • Cover more than the $2.3 billion shortfall identified by the Texas Federation for DC 19.6 27.5 47.1 Teachers for such things as textbooks and Other States* 12.4 17.4 29.8 pension contributions. Alaska 11.3 15.8 27.0 Mississippi 9.9 13.8 23.7 • Make Texas’ salaries for teachers more Louisiana 7.3 10.2 17.5 competitive by national standards, thereby Hawaii 3.0 4.2 7.2 reducing costly attrition, and recruit the $11,919.9 $16,687.9 $28,607.8 5,000 new teachers needed each year. *(Maine, Montana, New Hampshire, North Dakota, South Dakota, Vermont, West virginia, and Wyoming)
- 3. Page 3 Breaking the Piggy Bank: How Illegal Immigration Is Sending Schools Into the Red In New York, the $3.1 billion spent annually educating the children of illegal immigrants could: • Nearly cover the estimated $3.3 billion required by the state’s Supreme Court under the decision in the Campaign for Fiscal Equity case to establish equitable state funding for New York City’s public school system. • Help to reduce the $1.8 billion revenue shortfall for fiscal year 2005 in New York City. • Provide enough additional funding to nearly meet the $3 billion in health care cuts in the current proposed budget for payments to hospitals and nursing homes. In Illinois, the $2 billion spent annually educating the children of illegal immigrants could: • Balance the current state budget—estimated to be $2 billion in the red—and make unnecessary adoption of the new taxes in the Education Funding Reform Act of 2005. • Help close the potential gap resulting from decreased federal 2006 funding to the state of between $1.07–$1.35 billion.9 In New Jersey, the $1.5 billion spent annually educating the children of illegal immigrants could: • Go a long way toward solving the dilemma Gov. Codey noted on March 1, 2005, when he said, “I wish I could be here discussing a major investment in higher education or an expansion of health care because those are investments New Jersey needs to make, but I can't have those discussions, not with this [fiscal] mess in front of us.” • Help close the potential gap resulting from decreased federal 2006 funding to the state of between $682–$845 million. In Florida, the $1.2 billion spent annually educating the children of illegal immigrants could: • Fund the services eliminated as a result of a cut in federal funding to Florida public schools estimated by the Center on Budget and Policy Priorities to be $565 million over the next five years beginning in 2006. Over the same period, the Center estimated an additional $321 million has been lost to the state for adult and vocational education as well as $3.2 billion in grants to the state and local governments and $392 million in “Strengthening America’s Communities” block grants. • Help close the potential gap resulting from decreased federal 2006 funding to the state of between $1.52–$1.89 billion.
- 4. Page 4 Federation for American Immigration Reform In Georgia, the $952 million spent annually educating the children of illegal immigrants could: • Raise the performance of the state’s schools described by Gov. Perdue in his 2003 State of the State Address in these terms, “Georgia’s education system is not what it should be. The National Assessment of Education Progress is the nation’s education report card. It shows Georgia is behind the national average on reading, writing, math, and science. For each of those subjects more than 50% of Georgia children are below the proficient level. Georgia also has one of the lowest high school graduation rates in the nation. And, to our shame, we rank 50th in SAT scores. We can sum up our report card in two words: “Needs improvement.” • Help close the potential gap resulting from decreased federal 2006 funding to the state of between $847–$1,071 million. In North Carolina, the $771 million spent annually educating illegal immigrant children could: • Redress part of a $1.2 billion state budget shortfall and obviate the need for new taxes proposed by Gov. Mike Easley for the 2006 budget. • Help close the potential gap resulting from decreased federal 2006 funding to the state of between $888–$1,129 million. In Arizona, the $748 million spent annually educating illegal immigrant children could: • Improve state funding for education, which in this year’s Quality Counts 2005 state-by-state education report ranked Arizona 50th in per-pupil spending. To close the gap with the national average in spending per student would cost the state an additional $1.6 billion. • Help close the potential gap resulting from decreased federal 2006 funding to the state of between $587–$763 million. In Colorado, the $564 million spent annually educating illegal immigrant children could: • Reduce the state budget deficit estimated at $900 million in the 2003–’04 budget, and more recently by the Independence Institute at around $158 million for 2006. • Help close the potential gap resulting from decreased federal 2006 funding to the state of between $270–$337 million. Implications for the Move to Give In-State Tuition Rates to Illegal Aliens Efforts are underway in several states and in Congress to allow illegal aliens to pay steeply discounted in-state tuition at public colleges and universities—
- 5. Page 5 Breaking the Piggy Bank: How Illegal Immigration Is Sending Schools Into the Red rates not available to American citizens from other states. As state universities across the country increasingly limit enrollment, increasing the intake of illegal aliens into these schools will mean fewer opportunities and less aid for U.S. citizens and legal immigrants. It will also mean a higher cost to the state taxpayers; out-of-state tuition is typically two to 3.5 times higher than in- state tuition.10 In 2000, about 126,000 illegal immigrants under 21 were enrolled in college, according to research from the Congressional Research Service.11 Using 2000 data, we calculated that at non-resident tuition rates, they would be paying between $503 million and $655 million annually. If they were made eligible for in-state tuition discounts, they would be paying less than one-third of that amount, i.e., $155 million to $201 million—leaving taxpayers to make up the difference of $348 million to $454 million.12 We estimate that both the number of illegal alien students and the tuition costs will have increased since 2000. In 2004 the estimated outlays would be about $839 million to $1.092 billion, and the discount for in-state tuition would reduce that to about $258 million to $336 million—leaving the taxpayers to make up the difference of $581 million to $756 million. Potential Costs of Providing In-State Tuition to Illegal Alien The cost estimates in the table at the right, distributed to each state Students in Public Colleges and according to their proportion of the illegal immigrant population, 13 Universities in the Top 15 States are for the 15 states with the highest estimated expenditures:14 (in millions) Several of these states are already incurring these costs. In-state tuition provisions for illegal aliens are currently in effect in California 222.6 – 289.3 California, Texas, New York, Illinois, Washington and—through Texas 80.2 – 104.4 ‘don’t-ask, don’t tell’ provisions—in Georgia and Arizona. Proposed federal legislation to give illegal aliens in-state tuition Florida 37.5 – 48.7 New York 28.8 – 37.5 rates would carry additional substantial costs. According to the Arizona 24.2 – 31.3 Congressional Budget Office, making illegal alien students eligible for federal tuition assistance through Pell grants would have cost $195 million in 2003 and $362 million over the 2003-2006 Illinois 23.3 – 30.5 period.15, 16 North Carolina 21.7 – 28.2 Georgia 17.0 – 22.0 Washington 13.2 – 17.2 The estimate by the Congressional Budget Office of costs for providing tuition assistance to illegal alien students and the state cost estimates of providing access to in-state tuition at taxpayer Colorado 11.7 – 15.2 New Jersey 10.3 – 13.3 expense above do not include the U.S.-born children of illegal Nevada 9.3 – 12.2 aliens because they are already eligible to attend college as in-state residents. However, it should be noted that these expenses, like their education at the primary and secondary level, result from the Virginia 9.3 – 12.0 Massachusetts 7.7 – 10.0 illegal immigration of their parent(s) and could be avoided if the Oregon 7.2 – 9.2 immigration authorities more effectively deterred illegal immigration and identified and removed those illegally residing in the country.
- 6. Page 6 Federation for American Immigration Reform Conclusion All of our children—native-born and immigrants alike—are receiving a poorer education as a result of the federal government passing its immigration law enforcement failures on to the states. The implications for the coming generations of workers, our future economy, and our long-term competitiveness in the world cannot be ignored. If the federal government remains unwilling to undertake serious enforcement of the United States’ immigration laws, it will eventually be forced to provide massive federal education funds to the states. A far more logical and cost-effective alternative—and one with considerable pay-offs in other areas as well—would be to substantially reduce illegal immigration. Without a serious commitment to doing just that, the open borders and lax enforcement that allow millions of illegal aliens to enter the U.S. each year— and to obtain driver’s licenses and other official identification documents with virtually no fear of the law—will continue to undermine the will of the American people, overburden our communities’ financial resources, and imperil our children’s future. Notes on Methodology Breaking the Piggy Bank was originally published by FAIR in 2003 using illegal alien population estimates tied to the 2000 Census and limited to the costs of educating students who were, themselves, illegally in the country. This update adjusts the illegal alien population upwards for the continuing rise in that population, the continuing increases in the cost of education, and to include the cost of educating the U.S.-born children of illegal aliens. The cost estimate in the original version was $7.4 billion. Increases in the estimated per pupil educational cost in the ‘03-’04 school year were based on the rate of increase between ’00-’01 and ’01-’02. These increases generally were between 10%-25%. There were three states with increases of less than 10% and eight with increases greater than 25%. The estimate of the increase in the illegal alien student population was based on an estimate of the overall increase in the illegal alien population, i.e., from 7 million in 2000 to at least 10 million in 2004. The estimate of the illegal alien K-12 school population is assumed to have similarly increased by about 43% (from slightly less than 1.1 million to slightly less than 1.6 million students).
- 7. Page 7 Breaking the Piggy Bank: How Illegal Immigration Is Sending Schools Into the Red Endnotes 1 The population estimate is for children enrolled in grades K-12. However the per student expenditures used to calculate the total costs were for primary and secondary schools (grades 1-12). 2 Lara-Alecio, Rafael et al., “Texas Dual Language Program Cost Analysis,” January 2005. 3 Education is only one of the significant costs to states resulting from mass illegal immigration. There are countless others—health care, housing assistance, nutrition programs, incarceration of criminal aliens, to name just a few. 4 Michael Fix and Jeffrey Passel, "U.S. Immigration—Trends and Implications for Schools," Immigration Studies Program, The Urban Institute, 2003. 5 "Estimates of the Unauthorized Immigrant Population Residing in the United States: 1990-2000," Office of Policy Planning, U.S. Immigration and Naturalization Service, January 2003. 6 "Table 169, Current Expenditure Per Pupil in Fall Enrollment in Public Elementary and Secondary Schools, by State: 1969-70 to 1999-00," Digest of Education Statistics 2002, National Center for Education Statistics, U.S. Department of Education. 7 See, for example, The Net National Costs of Immigration, Donald Huddle, Rice University, 1997. 8 These calculations are based on cost reports from news accounts and state departments of education. 9 The estimates of potential federal funding reductions here and for the following states come from the website of the Every Child Matters organization. 10 Maine, Montana, New Hampshire, North Dakota, South Dakota, Vermont, West Virginia, and Wyoming were calculated together because the INS estimates their data as a group. In order to estimate their cost, the average expenditure per student was calculated. 11 Andorra Bruno and Jeffrey J. Kuenzi, "Unauthorized Alien Students: Issues and Legislation," Report for Congress, Congressional Research Service, May 16, 2003. 12 Ibid. 13 To estimate the resident versus non-resident tuition costs, the 2002-2003 tuition for each state (except for Alaska, Delaware, Hawaii, and Wyoming, for which national averages were used) was multiplied by the range of 50,000-65,000 illegal immigrants who would qualify for in-state tuition, as estimated by the Urban Institute. Sources: "National Comparison of Tuition and Required Fees 1998-99 through 2002-03," Washington Higher Education Coordinating Board, December 2002; "Student Charges and Financial Aid 2002-2003," American Association of State Colleges and Universities and the National Association of State Universities and Land-Grant Colleges, February 2003; Andorra Bruno and Jeffrey J. Kuenzi, "Unauthorized Alien Students: Issues and Legislation," Report for Congress, Congressional Research Service, May 16, 2003. 14 The number of illegal immigrant students was distributed to each state based on the estimate of illegal immigrants per state: "Estimates of the Unauthorized Immigrant Population Residing in the United States: 1990-2000," Office of Policy Planning, U.S. Immigration and Naturalization Service, January 2003. 15 Because the cost difference between in-state and out-of-state tuition varies by state, the states with the top cost burdens here vary somewhat from the top most burdened This report was prepared states for K-12 education. by Jack Martin, Director 16 "Cost Estimate for S.1291 Development, Relief, and Education for Alien Minors Act," of Special Projects. The Congressional Budget Office, July 26, 2002. principal researcher for the original report was Claire Shook-Finucane.
- 8. About FAIR The Federation for American Immigration Reform (FAIR) is a national, non-profit, public interest organization of concerned citizens working to reform our nation’s immigration policy. FAIR seeks to improve border security, to stop illegal immigration, and to promote immigration levels consistent with the national interest. FAIR is the largest and most effective organization in the United States dedicated exclusively to immigration issues. It is financially supported by 70,000 members and over 40 foundations nationwide. FAIR is a tax-exempt organization under §501(c)3 of the Internal Revenue Code. Federation for American Immigration Reform 1666 Connecticut Avenue, NW | Suite 400 | Washington, DC 20009 202.328.7004 | 202.347.3887 (fax) | info@fairus.org | www.fairus.org TM © June 2005 FAIR Horizon PressTM | All rights reserved Printed in the United States of America ISBN 0-9746733-1-5