Intel - stock valuation and analysis model - imran almaleh
•
0 j'aime•203 vues

A stock valuation and analysis financial model for selecting stocks based on a value investment strategy. Diving into many criteria such as profitability, leverage, free cash flow and DCF analysis.

Recommandé
Recommandé
Contenu connexe
Tendances
Tendances (20)
Similaire à Intel - stock valuation and analysis model - imran almaleh
Similaire à Intel - stock valuation and analysis model - imran almaleh (20)
Plus de Imran Almaleh
Plus de Imran Almaleh (11)
Dernier
Dernier (20)
Intel - stock valuation and analysis model - imran almaleh
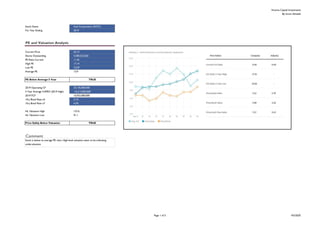
- 1. Victoria Capital Investments By Imran Almaleh Stock Name Intel Corporation (INTC) For Year Ending 2019 Current Price 54.13 Shares Outstanding 4,280,523,560 PE Ratio Current 11.45 High PE 17.14 Low PE 10.59 Average PE 13.9 PE Below Average 5 Year TRUE 2019 Operating CF 33,145,000,000 4 Year Average CAPEX (2019 High) -16,213,000,000 2019 FCF 16,932,000,000 10-y Bond Rate x5 3.1% 10-y Bond Rate x7 4.3% HL Valuation High 127.6 HL Valuation Low 91.1 Price Safely Below Valuation TRUE Comment PE and Valuation Analysis Stock is below its average PE ratio. High-level valuation seem to be indicating undervaluation Page 1 of 5 4/5/2020
- 2. Victoria Capital Investments By Imran Almaleh Stock Name Intel Corporation (INTC) For Year Ending 2019 2019 ROE 27.6% 5 y Average 23.1% Industry 5y Average 16.3% ROE Above 5Y Average TRUE ROE Above Industry Average TRUE 2019 ROA 15.9% 5 y Average 13.5% Industry 5y Average 9.3% ROA Above 5Y Average TRUE ROA Above Industry Average TRUE Net Profit margin TTM 29.3% Net Profit margin 5YA 24.5% Industry margin TTM 17.9% NP Margin Above 5Y Average TRUE NP Margin Above Industry Average TRUE Comment ROE, ROA, Profitability Analysis Margins seem to be stronger than industry with a slight improvement in 2019 0.0% 5.0% 10.0% 15.0% 20.0% 25.0% 30.0% 35.0% Net Profit margin TTM Net Profit margin 5YA Industry margin TTM Page 2 of 5 4/5/2020
- 3. Victoria Capital Investments By Imran Almaleh Stock Name Intel Corporation (INTC) For Year Ending 2019 2016 2017 2018 2019 Average CFO 26,623.8 Net Profit 10,316 9,601 21,053 21,048 Average CAPEX (13,199.3) Operating Cash Flow 21,808 22,110 29,432 33,145 Average FCF 13,424.5 CAPEX -9,625 -11,778 -15,181 -16,213 FCF 12,183 10,332 14,251 16,932 4Y Net Income CAGR 19.5% 4Y CFO CAGR 11.0% FCF Growth -15% 38% 19% 4Y FCF CAGR 8.6% FCF % of Net Income 118% 108% 68% 80% Average FCF %of Net Income 93% Average FCF %of Net Income >80% TRUE Comment Consistent CFO and CAPEX leading to consistent Free Cash Flows and high quality earnings FCF Analysis -18,000 -16,000 -14,000 -12,000 -10,000 -8,000 -6,000 -4,000 -2,000 00 5,000 10,000 15,000 20,000 25,000 30,000 35,000 2016 2017 2018 2019 Net Profit FCF Operating Cash Flow CAPEX Page 3 of 5 4/5/2020
- 4. Victoria Capital Investments By Imran Almaleh Stock Name Intel Corporation (INTC) For Year Ending 2019 a e e e e e 2019 2020 2021 2022 2023 2024 FCF Growth Assumption High 5.0% FCF (High) 16,932.0 17,778.6 18,667.5 19,600.9 20,581.0 21,610.0 FCF Growth Assumption Low 3.0% Terminal Value 1,059,313.7 Perpetual Growth (Economy GDP Growth) 2.3% ###### ###### ###### ###### ######## Discount Rate 4.3% FCF (Low) 16,932.0 17,440.0 17,963.2 18,502.1 19,057.1 19,628.8 Valuation High 220 Terminal Value 962,197.5 Valuation Low 201 ###### ###### ###### ###### 981,826.3 Price Safely Below Valuation TRUE Total Debt/Equity Ratio 37.3% LT Debt to Equity MRQ 32.6% LT Debt to Equity Industry 39.5% Debt/Equity <50% TRUE Debt/Equity < Industry Average TRUE Comment Financial health of the company seem to be strong. DCF Analysis Leverage Analysis Page 4 of 5 4/5/2020
- 5. Victoria Capital Investments By Imran Almaleh Stock Name Intel Corporation (INTC) For Year Ending 2019 Indicator True/False W% Low High Point low Point hi PE Below Average 5 Year TRUE 5% Estimate 150 200 150.00 50.00 Price Safely Below Valuation TRUE 10% ROE Above 5Y Average TRUE 4% DCF Analysis 200.80 220.27 200.80 19.47 ROE Above Industry Average TRUE 6% HL Valuation 91.14 127.60 91.14 36.46 ROA Above 5Y Average TRUE 4% 52 weeks High - Low 42.86 69.29 42.86 26.43 ROA Above Industry Average TRUE 6% NP Margin Above 5Y Average TRUE 10% NP Margin Above Industry Average TRUE 10% Average FCF %of Net Income >80% TRUE 10% Price Safely Below Valuation TRUE 15% Debt/Equity <50% TRUE 10% Debt/Equity < Industry Average TRUE 10% Max Score 12 100% Total Score 100% Comment Margins seem to be stronger than industry with a slight improvement in 2019 Consistent CFO and CAPEX leading to consistent Free Cash Flows and high quality earnings Financial health of the company seem to be strong. Stock is below its average PE ratio. High-level valuation seem to be indicating undervaluation Disclaimer: The Content is for informational purposes only, you should not construe any such information or other material as legal, tax, investment, financial, or other advice. Nothing contained on our Report constitutes a solicitation, recommendation, endorsement, or offer by us or any third party service provider to buy or sell any securities or other financial instruments in this or in in any other jurisdiction in which such solicitation or offer would be unlawful under the securities Summary PE and Valuation Analysis ROE, ROA, Profitability Analysis FCF Analysis DCF Analysis & Leverage Analysis The stock is attractive for a value oriented strategy Valuation Summary 0.00 50.00 100.00 150.00 200.00 250.00 Estimate DCF Analysis HL Valuation 52 weeks High - Low Page 5 of 5 4/5/2020