Medium to Long Term Investment Idea: Capital Trust
•
1 j'aime•333 vues

Capital Trust's Q4FY15 net profits up 354.41% y/y, Firstcall recommends 'buy'

Recommandé
Recommandé
Contenu connexe
Tendances
Tendances (20)
Similaire à Medium to Long Term Investment Idea: Capital Trust
Similaire à Medium to Long Term Investment Idea: Capital Trust (20)
Plus de IndiaNotes.com
Plus de IndiaNotes.com (20)
Dernier
Dernier (20)
Medium to Long Term Investment Idea: Capital Trust
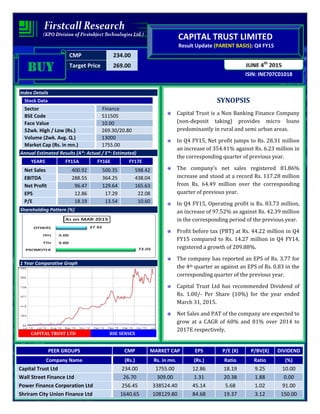
- 1. CMP 234.00 Target Price 269.00 ISIN: INE707C01018 JUNE 4th 2015 CAPITAL TRUST LIMITED Result Update (PARENT BASIS): Q4 FY15 BUYBUYBUYBUY Index Details Stock Data Sector Finance BSE Code 511505 Face Value 10.00 52wk. High / Low (Rs.) 269.30/20.80 Volume (2wk. Avg. Q.) 13000 Market Cap (Rs. in mn.) 1755.00 Annual Estimated Results (A*: Actual / E*: Estimated) YEARS FY15A FY16E FY17E Net Sales 400.92 500.35 598.42 EBITDA 288.55 364.25 438.04 Net Profit 96.47 129.64 165.63 EPS 12.86 17.29 22.08 P/E 18.19 13.54 10.60 Shareholding Pattern (%) 1 Year Comparative Graph CAPITAL TRUST LTD BSE SENSEX SYNOPSIS Capital Trust is a Non Banking Finance Company (non-deposit taking) provides micro loans predominantly in rural and semi urban areas. In Q4 FY15, Net profit jumps to Rs. 28.31 million an increase of 354.41% against Rs. 6.23 million in the corresponding quarter of previous year. The company’s net sales registered 81.86% increase and stood at a record Rs. 117.28 million from Rs. 64.49 million over the corresponding quarter of previous year. In Q4 FY15, Operating profit is Rs. 83.73 million, an increase of 97.52% as against Rs. 42.39 million in the corresponding period of the previous year. Profit before tax (PBT) at Rs. 44.22 million in Q4 FY15 compared to Rs. 14.27 million in Q4 FY14, registered a growth of 209.88%. The company has reported an EPS of Rs. 3.77 for the 4th quarter as against an EPS of Rs. 0.83 in the corresponding quarter of the previous year. Capital Trust Ltd has recommended Dividend of Rs. 1.00/- Per Share (10%) for the year ended March 31, 2015. Net Sales and PAT of the company are expected to grow at a CAGR of 60% and 81% over 2014 to 2017E respectively. PEER GROUPS CMP MARKET CAP EPS P/E (X) P/BV(X) DIVIDEND Company Name (Rs.) Rs. in mn. (Rs.) Ratio Ratio (%) Capital Trust Ltd 234.00 1755.00 12.86 18.19 9.25 10.00 Wall Street Finance Ltd 26.70 309.00 1.31 20.38 1.88 0.00 Power Finance Corporation Ltd 256.45 338524.40 45.14 5.68 1.02 91.00 Shriram City Union Finance Ltd 1640.65 108129.80 84.68 19.37 3.12 150.00
- 2. QUARTERLY HIGHLIGHTS (PARENT BASIS) Results updates- Q4 FY15, Capital Trust is a Non Banking Finance Company (non- deposit taking) provides micro loans predominantly in rural and semi urban areas has reported its financial results for the quarter ended 31st March, 2015. The company has achieved a turnover of Rs. 117.28 million for the 4th quarter of the financial year 2015 as against Rs. 64.49 million in the corresponding quarter of the previous year. EBITDA of Rs. 83.73 million in Q4 FY15, an increase of 97.52% against the corresponding period of last year. In Q4 FY15, net profit of Rs. 28.31 million against Rs. 6.23 million in the corresponding quarter of the previous year. The company has reported an EPS of Rs. 3.77 for the 4th quarter as against an EPS of Rs. 0.83 in the corresponding quarter of the previous year. Break up of Expenditure Rs. In million Mar-15 Mar-14 % Change Net Sales 117.28 64.49 81.86 PAT 28.31 6.23 354.41 EPS 3.77 0.83 354.41 EBITDA 83.73 42.39 97.52 Particulars Rs. Million Q4 FY15 Q4 FY14 % Chng Employee Cost 22.48 11.30 99% Premises Cost 3.33 1.72 94% Travelling & Conveyance 5.73 1.92 198% Loan Loss W/Off 0.74 1.10 -33% Other expenditure 6.18 4.86 27% Depreciation -0.30 0.20 -250%
- 3. COMPANY PROFILE Capital Trust is a Non-Banking Finance Company (non-deposit taking) listed on the Bombay Stock Exchange. The company has 30 years of operating history, promoted by prominent ex-bankers, which included the then recently retired Governor RBI, Mr K.R. Puri. Other promoters also included the then retired Chief Justice of India. The company provides micro and small loans predominantly in rural and semi urban areas. Most loans are to those which are not financially included in the banking sector. Maximum loan size is Rs. 5 Lakhs. The company provides Enterprise loans for Agriculture, Dairy and Livestock, Trading, Retail activities, Services, Food related business, etc. Capital Trust also provide home improvement loans and loans against property. The company is also a business correspondent of YES Bank and provides loans under microfinance and Self Help Group schemes. The company is currently operating in 4 States in north India covering 27 Districts through 83 branches. Capital Trust has also applied to the Reserve Bank of India for small finance bank licence. Products • Microfinance • Enterprise loan • Home loans
- 4. FINANCIAL HIGHLIGHT (PARENT BASIS) (A*- Actual, E* -Estimations & Rs. In Millions) Balance Sheet as at March 31, 2014 -2017E FY14A FY15A FY16E FY17E I. EQUITY AND LIABILITIES: A. Shareholders’ Funds a) Share Capital 105.00 105.00 105.00 105.00 b) Reserves and Surplus 33.95 114.70 216.09 356.56 Sub-Total-Net worth 138.95 219.70 321.09 461.56 B. Non-Current Liabilities: a) Long-term borrowings 1.69 58.19 52.37 48.18 b) Other Non-Current Liabilities 2.70 3.44 3.96 4.43 Sub-Total-Long term liabilities 4.39 61.63 56.33 52.61 C. Current Liabilities: a) Short-term borrowings 519.51 712.50 876.38 1007.83 b) Trade Payables 8.41 15.08 19.60 22.54 c) Other Current Liabilities 10.48 183.17 272.92 349.34 d) Long Term Provisions 13.68 46.72 64.01 78.73 Sub-Total-Current Liabilities 552.08 957.47 1232.91 1458.45 TOTAL-EQUITY AND LIABILITIES (A+B+C) 695.42 1238.80 1610.33 1972.61 II. ASSETS: D. Non-Current Assets: a) Tangible Assets 6.10 8.67 10.84 12.79 b) Deferred tax assets 2.34 2.96 3.61 4.33 c) Long-term loans and advances 0.00 224.08 302.51 375.11 Sub-Total-Non-Current Assets 8.44 235.71 316.96 392.23 E. Current Assets: a) Trade Receivables 7.82 28.68 43.59 59.29 b) Cash and Bank Balances 23.79 269.31 495.32 721.37 c) Short Term Loans and Advances 655.37 705.10 754.46 799.72 Sub-Total-Current Assets 686.98 1003.09 1293.37 1580.38 TOTAL-ASSETS (D+E) 695.42 1238.80 1610.33 1972.61
- 5. Annual Profit & Loss Statement for the period of 2014 to 2017E Value(Rs.in.mn) FY14A FY15A FY16E FY17E Description 12m 12m 12m 12m Net Sales 179.61 400.92 500.35 598.42 Other Income 0.00 0.00 0.00 0.00 Total Income 179.61 400.92 500.35 598.42 Expenditure -81.52 -112.37 -136.09 -160.38 Operating Profit 98.09 288.55 364.25 438.04 Interest -67.88 -141.47 -165.52 -185.38 Gross profit 30.21 147.08 198.73 252.66 Depreciation -0.74 -1.15 -1.41 -1.70 Profit Before Tax 29.47 145.93 197.32 250.96 Tax -11.23 -49.46 -67.68 -85.33 Net Profit 18.24 96.47 129.64 165.63 Equity capital 75.00 75.00 75.00 75.00 Reserves 33.95 114.70 216.09 356.56 Face value 10.00 10.00 10.00 10.00 EPS 2.43 12.86 17.29 22.08 Quarterly Profit & Loss Statement for the period of 30th Sep, 2014 to 30th Jun, 2015E Value(Rs.in.mn) 30-Sep-14 31-Dec-14 31-Mar-15 30-Jun-15E Description 3m 3m 3m 3m Net sales 99.47 103.19 117.28 144.25 Other income 0.00 0.00 0.00 0.00 Total Income 99.47 103.19 117.28 144.25 Expenditure -26.23 -28.19 -33.55 -37.79 Operating profit 73.24 75.00 83.73 106.46 Interest -33.92 -35.00 -39.81 -46.34 Gross profit 39.32 40.00 43.92 62.20 Depreciation -0.68 -0.48 0.30 -0.10 Profit Before Tax 38.64 39.52 44.22 60.02 Tax -13.81 -12.13 -15.91 -20.99 Net Profit 24.83 27.39 28.31 39.74 Equity capital 75.00 75.00 75.00 75.00 Face value 10.00 10.00 10.00 10.00 EPS 3.31 3.65 3.77 5.30
- 6. Ratio Analysis Particulars FY14A FY15A FY16E FY17E EPS (Rs.) 2.43 12.86 17.29 22.08 EBITDA Margin (%) 54.61 71.97 72.80 73.20 PBT Margin (%) 16.41 36.40 39.44 41.94 PAT Margin (%) 10.16 24.06 25.91 27.68 P/E Ratio (x) 96.22 18.19 13.54 10.60 ROE (%) 16.74 50.85 44.53 38.38 ROCE (%) 15.68 30.16 29.98 29.56 Debt Equity Ratio 4.78 4.06 3.19 2.45 EV/EBITDA (x) 22.96 7.82 6.01 4.77 Book Value (Rs.) 14.53 25.29 38.81 57.54 P/BV 16.11 9.25 6.03 4.07 Charts
- 7. OUTLOOK AND CONCLUSION At the current market price of Rs. 234.00, the stock P/E ratio is at 13.54 x FY16E and 10.60 x FY17E respectively. Earning per share (EPS) of the company for the earnings for FY16E and FY17E is seen at Rs.17.29 and Rs.22.08 respectively. Net Sales and PAT of the company are expected to grow at a CAGR of 60% and 81% over 2014 to 2017E respectively. On the basis of EV/EBITDA, the stock trades at 6.01 x for FY16E and 4.77 x for FY17E. Price to Book Value of the stock is expected to be at 6.03 x and 4.07 x respectively for FY16E and FY17E. We expect that the company surplus scenario is likely to continue for the next three years, will keep its growth story in the coming quarters also. We recommend ‘BUY’ in this particular scrip with a target price of Rs.269.00 for Medium to Long term investment. INDUSTRY OVERVIEW India has a diversified financial sector, which is undergoing rapid expansion. The sector comprises commercial banks, insurance companies, non-banking financial companies, co-operatives, pension funds, mutual funds and other smaller financial entities. The financial sector in India is predominantly a banking sector with commercial banks accounting for more than 60 per cent of the total assets held by the financial system. India's services sector has always served the country’s economy well, accounting for about 57 per cent of the gross domestic product (GDP). In this regard, the financial services sector has been an important contributor.
- 8. The Government of India has introduced reforms to liberalise, regulate and enhance this industry. At present, India is undoubtedly one of the world's most vibrant capital markets. Challenges remain, but the future of the sector looks good. The advent of technology has also aided the growth of the industry. About 75 per cent of the insurance policies sold by 2020 would, in one way or another, be influenced by digital channels during the pre- purchase, purchase or renewal stages, as per a report by Boston Consulting Group (BCG) and Google India. The size of banking assets in India reached US$ 1.8 trillion in FY14 and is expected to touch US$ 28.5 trillion by FY25. Outlook India is today one of the most vibrant global economies, on the back of robust banking and insurance sectors. The country is projected to become the fifth largest banking sector globally by 2020, as per a joint report by KPMG- CII. The report also expects bank credit to grow at a compound annual growth rate (CAGR) of 17 per cent in the medium term leading to better credit penetration. Life Insurance Council, the industry body of life insurers in the country also projects a CAGR of 12–15 per cent over the next few years for the financial services segment. Also, the relaxation of foreign investment rules has received a positive response from the insurance sector, with many companies announcing plans to increase their stakes in joint ventures with Indian companies. Over the coming quarters there could be a series of joint venture deals between global insurance giants and local players. Disclaimer: This document is prepared by our research analysts and it does not constitute an offer or solicitation for the purchase or sale of any financial instrument or as an official confirmation of any transaction. The information contained herein is from publicly available data or other sources believed to be reliable but we do not represent that it is accurate or complete and it should not be relied on as such. Firstcall Research or any of its affiliates shall not be in any way responsible for any loss or damage that may arise to any person from any inadvertent error in the information contained in this report. Firstcall Research and/ or its affiliates and/or employees will not be liable for the recipients’ investment decision based on this document.
- 9. Firstcall India Equity Research: Email – info@firstobjectindia.com C.V.S.L.Kameswari Pharma & Diversified U. Janaki Rao Capital Goods B. Anil Kumar Auto, IT & FMCG M. Vinayak Rao Diversified G. Amarender Diversified Firstcall Research Provides Industry Research on all the Sectors and Equity Research on Major Companies forming part of Listed and Unlisted Segments For Further Details Contact: Tel.: 022-2527 2510/2527 6077 / 25276089 Telefax: 022-25276089 040-20000235 /20000233 E-mail: info@firstobjectindia.com www.firstcallresearch.com