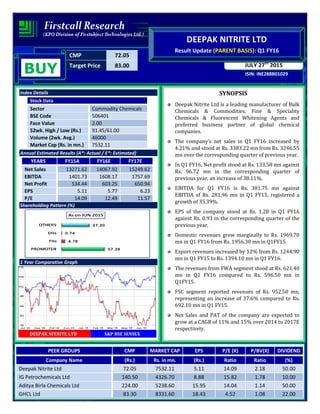
1. CMP 72.05
Target Price 83.00
ISIN: INE288B01029
JULY 27th
2015
DEEPAK NITRITE LTD
Result Update (PARENT BASIS): Q1 FY16
BUY
Index Details
Stock Data
Sector Commodity Chemicals
BSE Code 506401
Face Value 2.00
52wk. High / Low (Rs.) 91.45/61.00
Volume (2wk. Avg.) 46000
Market Cap (Rs. in mn.) 7532.11
Annual Estimated Results (A*: Actual / E*: Estimated)
YEARS FY15A FY16E FY17E
Net Sales 13271.62 14067.92 15249.62
EBITDA 1401.73 1608.17 1757.69
Net Profit 534.44 603.25 650.94
EPS 5.11 5.77 6.23
P/E 14.09 12.49 11.57
Shareholding Pattern (%)
1 Year Comparative Graph
DEEPAK NITRITE LTD S&P BSE SENSEX
SYNOPSIS
Deepak Nitrite Ltd is a leading manufacturer of Bulk
Chemicals & Commodities, Fine & Speciality
Chemicals & Fluorescent Whitening Agents and
preferred business partner of global chemical
companies.
The company’s net sales in Q1 FY16 increased by
4.21% and stood at Rs. 3383.22 mn from Rs. 3246.55
mn over the corresponding quarter of previous year.
In Q1 FY16, Net profit stood at Rs. 133.58 mn against
Rs. 96.72 mn in the corresponding quarter of
previous year, an increase of 38.11%.
EBITDA for Q1 FY16 is Rs. 381.75 mn against
EBITDA of Rs. 281.96 mn in Q1 FY15, registered a
growth of 35.39%.
EPS of the company stood at Rs. 1.28 in Q1 FY16
against Rs. 0.93 in the corresponding quarter of the
previous year.
Domestic revenues grew marginally to Rs. 1969.70
mn in Q1 FY16 from Rs. 1956.30 mn in Q1FY15.
Export revenues increased by 12% from Rs. 1244.90
mn in Q1 FY15 to Rs. 1394.10 mn in Q1 FY16.
The revenues from FWA segment stood at Rs. 621.40
mn in Q1 FY16 compared to Rs. 596.50 mn in
Q1FY15.
FSC segment reported revenues of Rs. 952.50 mn,
representing an increase of 37.6% compared to Rs.
692.10 mn in Q1 FY15.
Net Sales and PAT of the company are expected to
grow at a CAGR of 11% and 15% over 2014 to 2017E
respectively.
PEER GROUPS CMP MARKET CAP EPS P/E (X) P/BV(X) DIVIDEND
Company Name (Rs.) Rs. in mn. (Rs.) Ratio Ratio (%)
Deepak Nitrite Ltd 72.05 7532.11 5.11 14.09 2.18 50.00
IG Petrochemicals Ltd 140.50 4326.70 8.88 15.82 1.78 10.00
Aditya Birla Chemicals Ltd 224.00 5238.60 15.95 14.04 1.14 50.00
GHCL Ltd 83.30 8331.60 18.43 4.52 1.08 22.00
2. QUARTERLY HIGHLIGHTS (PARENT BASIS)
Results Updates- Q1 FY16
Deepak Nitrite is a multi-division and multi-product
company engaged in manufacturing and sales of organic
intermediates, inorganic intermediates, fine and specialty
chemicals, has reported its financial results for the
quarter ended 30th June, 2015.
The company’s net profit stood at Rs. 133.58 million against Rs. 96.72 million in the corresponding quarter
ending of previous year, an increase of 38.11%. Revenue for the quarter increased by 4.21% and stood at Rs.
3383.22 million from Rs. 3246.55 million, when compared with the prior year period. Reported earnings per
share of the company stood at Rs. 1.28 a share during the quarter as against Rs. 0.93 over previous year period.
Profit before interest, depreciation and tax is Rs. 381.75 million as against Rs. 281.96 million in the
corresponding period of the previous year.
Break up of Expenditure
Months June-15 June-14 % Change
Net Sales 3383.22 3246.55 4.21
PAT 133.58 96.72 38.11
EPS 1.28 0.93 38.11
EBITDA 381.75 281.96 35.39
Break up of Expenditure
(Rs in millions)
Q1 FY16 Q1 FY15
%
CHNG
Material and related cost 2172.69 2073.05 5%
Employee Benefit Expenses 278.06 244.48 14%
Dep & Amortization Exp 94.87 85.74 11%
Power & Fuel 311.87 287.07 9%
Other Expenses 353.06 271.86 30%
3. Revenue Segment
Operating Highlights
• Domestic revenues grew marginally to Rs. 1969.70 mn in Q1FY16 from Rs. 1956.30 mn in Q1FY15.
• Export revenues increased by 12% from Rs. 1244.90 mn in Q1FY15 to Rs. 1394.10 mn in Q1FY16. Single digit
growth in exports of the existing business was elevated by strong traction in FWA exports.
• The revenues from FWA segment stood at Rs. 621.40 mn in Q1FY16 compared to Rs. 596.50 mn in Q1FY15.
The Company continues to witness healthy demand for its OBA products in the US market.
• FSC segment reported revenues of Rs. 952.50 mn, representing an increase of 37.6% compared to Rs. 692.10
mn in Q1FY15. Strong volume growth and an improved product mix resulted in the improved contribution in
Q1FY16.
Update on Project for Manufacture of Phenol and Acetone
The Company approved setting up new capacities for manufacturing Phenol and Acetone. A wholly owned
subsidiary, viz. Deepak Phenolics Limited has been set up for this project. The proposed Phenol Plant will be
located at Dahej in the State of Gujarat. The capacity of the Phenol Plant will be 200,000 MTPA and that of co-
product Acetone will be 120,000 MTPA.
4. COMPANY PROFILE
Deepak Nitrite Ltd. (DNL), having a product portfolio of Bulk Chemicals & Commodities (BCC), Fine & Speciality
Chemicals (FSC) & Fluorescent Whitening Agents (FWA), enjoys a leading market position in most of its products
in the domestic as well as global markets and is the partner of choice for several global chemical majors.
Headquartered at Vadodara, Gujarat, DNL is a multi-division and multi-product company with manufacturing
facilities at Nandesari & Dahej in Gujarat, Roha and Taloja in Maharashtra, and at Hyderabad in Andhra Pradesh.
The BCC segment consists of commodity chemicals which DNL supplies in high volumes. These products are
made to standard specifications and are subject to low-to-moderate margins. In this segment, the profit focus is
centred on cost leadership.
The FSC segment consists of niche products which are manufactured in low volumes. These products enjoy
higher value as they are customised to specific customer requirements. Due to the differentiation from
standardised products, the focus of the B2B supply model is based on quality of product, long-term relationships,
stable and sustainable operations and global best practices for suppliers and customers. DNL is one of the top 3
producers of fine intermediates that produce broad and innovative range of Effect Chemicals meeting the needs
of Speciality Producers.
The FWA segment consists of supply of OBA and its intermediate DASDA. DNL is the world’s only fully integrated
manufacturer of FWA (Toluene – PNT – DASDA – FWA). There is strong demand for FWAs across industries like
Paper, Detergents and Textiles. FWAs extend into Application Chemistry and DNL’s strategy is to create a unique
market positioning leading to a sizeable market share globally.
The end user industries for DNL range from agro-chemicals, dyestuffs, pigments, inks, whiteners,
pharmaceuticals to fuel additives, textiles, paper, detergent and solar industry. DNL prioritises R&D activities and
invests around 1% of its annual revenues in this area. It has a government approved central R&D facility which
has a sophisticated analytical laboratory, state-of-the-art equipment and advanced facilities.
5. FINANCIAL HIGHLIGHT (PARENT BASIS) (A*- Actual, E* -Estimations & Rs. In Millions)
Balance Sheet as at March 31, 2014 -2017E
FY14A FY15A FY16E FY17E
SOURCES OF FUNDS
Shareholder's Funds
Share Capital 104.54 209.08 209.08 209.08
Reserves and Surplus 2970.68 3259.20 3854.66 4505.60
1. Sub Total - Net worth 3075.22 3468.28 4063.74 4714.68
Non Current Liabilities
Long term Borrowings 2712.53 2386.00 2171.26 2040.98
Deferred Tax Liabilities 347.71 463.24 532.73 591.33
Other Long term Liabilities 24.44 26.71 28.31 29.73
Long term Provisions 41.86 52.60 62.07 70.76
2. Sub Total - Non Current Liabilities 3126.54 2928.55 2794.37 2732.80
Current Liabilities
Short term Borrowings 1907.16 2310.11 2645.08 2921.64
Trade Payables 1411.90 1093.83 1017.26 966.40
Other Current Liabilities 912.35 1291.50 1565.60 1784.78
Short Term Provisions 132.40 143.23 153.26 165.52
3. Sub Total - Current Liabilities 4363.81 4838.67 5381.19 5838.34
Total Liabilities (1+2+3) 10565.56 11235.50 12239.30 13285.81
APPLICATION OF FUNDS
Non-Current Assets
Fixed Assets
i. Tangible Assets 4560.15 5428.15 6188.09 6868.78
ii. Intangible Assets 52.65 59.10 65.01 70.86
iii. Capital work-in-progress 700.35 369.21 413.52 446.60
iv. Intangible Asset under Development 10.62 10.62 11.26 11.82
a) Sub Total Fixed Assets 5323.77 5867.08 6677.87 7398.06
b) Non-current investments 31.22 171.72 197.48 221.18
c) Long Term loans and advances 251.24 413.15 470.99 522.80
1. Sub Total - Non Current Assets 5606.23 6451.95 7346.34 8142.03
Current Assets
Inventories 1299.51 1050.41 987.39 1036.75
Trade receivables 2922.41 3109.92 3234.32 3396.03
Cash and Bank Balances 64.41 27.41 34.26 39.40
Short-terms loans & advances 659.79 519.85 545.84 567.68
Other current assets 13.20 75.96 91.15 103.91
2. Sub Total - Current Assets 4959.33 4783.55 4892.96 5143.78
Total Assets (1+2) 10565.56 11235.50 12239.30 13285.81
6. Annual Profit & Loss Statement for the period of 2014 to 2017E
Value(Rs.in.mn) FY14A FY15A FY16E FY17E
Description 12m 12m 12m 12m
Net Sales 12696.29 13271.62 14067.92 15249.62
Other Income 17.67 20.55 18.50 19.23
Total Income 12713.96 13292.17 14086.41 15268.86
Expenditure -11578.51 -11890.44 -12478.24 -13511.17
Operating Profit 1135.45 1401.73 1608.17 1757.69
Interest -257.49 -364.06 -418.67 -468.91
Gross profit 877.96 1037.67 1189.50 1288.78
Depreciation -296.44 -360.24 -407.07 -447.78
Profit Before Tax 581.52 677.43 782.43 841.00
Tax -198.24 -142.99 -179.18 -190.07
Net Profit 383.28 534.44 603.25 650.94
Equity capital 104.54 209.08 209.08 209.08
Reserves 2957.34 3251.41 3854.66 4505.60
Face value 10.00 2.00 2.00 2.00
EPS 36.66 5.11 5.77 6.23
Quarterly Profit & Loss Statement for the period of 31st Dec, 2014 to 30th Sep, 2015E
Value(Rs.in.mn) 31-Dec-14 31-Mar-15 30-Jun-15 30-Sep-15E
Description 3m 3m 3m 3m
Net sales 3063.38 3324.83 3383.22 3721.54
Other income 2.63 2.02 2.00 2.12
Total Income 3066.01 3326.85 3385.22 3723.66
Expenditure -2713.17 -2951.39 -3003.47 -3301.01
Operating profit 352.84 375.46 381.75 422.65
Interest -110.90 -80.82 -100.20 -116.23
Gross profit 241.94 294.64 281.55 306.42
Depreciation -92.22 -92.14 -94.87 -98.66
Profit Before Tax 149.72 202.50 186.68 207.76
Tax -22.37 -50.20 -53.10 -47.16
Net Profit 127.35 152.30 133.58 160.60
Equity capital 209.08 209.08 209.08 209.08
Face value 2.00 2.00 2.00 2.00
EPS 1.22 1.46 1.28 1.54
8. OUTLOOK AND CONCLUSION
At the current market price of Rs. 72.05, the stock P/E ratio is at 12.49 x FY16E and 11.57 x FY17E
respectively.
Earnings per share (EPS) of the company for the earnings for FY16E and FY17E are seen at Rs. 5.77 and Rs.
6.23 respectively.
Net Sales and PAT of the company are expected to grow at a CAGR of 11% and 15% over 2014 to 2017E
respectively.
On the basis of EV/EBITDA, the stock trades at 7.66 x for FY16E and 7.09 x for FY17E.
Price to Book Value of the stock is expected to be at 1.85 x and 1.60 x for FY16E and FY17E respectively.
The company to continue gains from value added product portfolio and steady growth from the FWA
segment. Growth opportunities in export as well domestic market remain encouraging and DNL’s diversified
product portfolio would help offset the vagaries in the global markets. Hence, we recommend ‘BUY’ in this
particular scrip with a target price of Rs. 83.00 for Medium to Long term investment.
INDUSTRY OVERVIEW
The chemical industry is dependent on the progress of its key customers, i.e. the manufacturing sector for
growth. FY 2014-15 was a soft year for chemical companies as the global manufacturing sector was affected by
slowdown in China and other emerging economies. Recovery in the United States along with growing demand for
higher value and innovative products were the key driving factors for growth in FY 2014-15. In FY 2015-16,
there are indications of an upturn in the global industrial cycle with the United States continuing to witness
growth momentum. In fact, due to the competitive advantage of shell gas extraction, North America will continue
9. to witness sustained growth. However, the most promising prospects were found in emerging economies of Asia,
Africa and Middle East. Sustained recovery in the manufacturing sector and shift in competitiveness will result in
driving the global economic growth. As a result, the size of the global chemical industry will become $4.7 trillion
by 2018 and $5.8 trillion by 2021 from about $3.9 trillion in 2013.
Bulk chemicals which comprise of organic and inorganic chemicals are projected to grow by 7.3% CAGR over the
next five years taking it to $25.7 billion by 2018 from $18 billion in 2013. Organic chemicals, which form 34% of
the bulk chemicals market are expected to grow at 9%, driven by strong demand in the end-user market. As a
result, plants manufacturing organic chemicals are expected to achieve full capacity utilization by 2018.
Inorganic chemicals are expected to grow by about 6-7% CAGR over the next five years driven by strong demand
from the end user industries like alumina, textiles, paper and detergents. Utilization rate will touch92% by 2018
from 81% in 2013.
The Indian specialty chemicals are the fastest growing segment. This segment witnessed 10% growth rate since
2009 and was valued at about $23 billion in 2013. This growth has come about as a result of strong demand from
end user industries. The specialty chemical market has gathered enough momentum and is expected to do about
$42 billion by 2018 owing to strong domestic demand. Exports are estimated to drive specialty chemicals growth
owing to its competitive scale and low cost of production compared to other economies.
Outlook
Looking forward, the Indian chemical industry is expected to deliver healthy gain from strong production
volumes that will be consumed domestically as well as exported. Capacity utilization is also expected to improve
further. India is also at the starting point of a new capital spending cycle as the ‘Make in India’ initiative kicks off.
This will not only expand production but also generate significant employment once the projects go online. The
Indian chemical sector has the potential to become a global manufacturing hub similar to the Indian
pharmaceutical industry. As the global economy recovers and external demand becomes more robust, chemical
exports will further accelerate. By 2018, the Indian chemical industry will post record CAGR of 8%.
Disclaimer:
This document is prepared by our research analysts and it does not constitute an offer or solicitation for the
purchase or sale of any financial instrument or as an official confirmation of any transaction. The information
contained herein is from publicly available data or other sources believed to be reliable but we do not represent that
it is accurate or complete and it should not be relied on as such. Firstcall Research or any of its affiliates shall not be
in any way responsible for any loss or damage that may arise to any person from any inadvertent error in the
information contained in this report. Firstcall Research and/ or its affiliates and/or employees will not be liable for
the recipients’ investment decision based on this document.
10. Firstcall India Equity Research: Email – info@firstobjectindia.com
C.V.S.L.Kameswari Pharma & Diversified
U. Janaki Rao Capital Goods
B. Anil Kumar Auto, IT & FMCG
M. Vinayak Rao Diversified
G. Amarender Diversified
Firstcall Research Provides
Industry Research on all the Sectors and Equity Research on Major Companies
forming part of Listed and Unlisted Segments
For Further Details Contact:
Tel.: 022-2527 2510/2527 6077 / 25276089 Telefax: 022-25276089
040-20000235 /20000233
E-mail: info@firstobjectindia.com
www.firstcallresearch.com