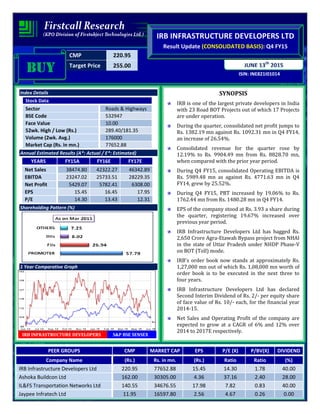
1. CMP 220.95
Target Price 255.00
ISIN: INE821I01014
JUNE 13th
2015
IRB INFRASTRUCTURE DEVELOPERS LTD
Result Update (CONSOLIDATED BASIS): Q4 FY15
BUYBUYBUYBUY
Index Details
Stock Data
Sector Roads & Highways
BSE Code 532947
Face Value 10.00
52wk. High / Low (Rs.) 289.40/181.35
Volume (2wk. Avg.) 176000
Market Cap (Rs. in mn.) 77652.88
Annual Estimated Results (A*: Actual / E*: Estimated)
YEARS FY15A FY16E FY17E
Net Sales 38474.80 42322.27 46342.89
EBITDA 23247.02 25733.51 28229.35
Net Profit 5429.07 5782.41 6308.00
EPS 15.45 16.45 17.95
P/E 14.30 13.43 12.31
Shareholding Pattern (%)
1 Year Comparative Graph
IRB INFRASTRUCTURE DEVELOPERS S&P BSE SENSEX
SYNOPSIS
IRB is one of the largest private developers in India
with 23 Road BOT Projects out of which 17 Projects
are under operation.
During the quarter, consolidated net profit jumps to
Rs. 1382.19 mn against Rs. 1092.31 mn in Q4 FY14,
an increase of 26.54%.
Consolidated revenue for the quarter rose by
12.19% to Rs. 9904.49 mn from Rs. 8828.70 mn,
when compared with the prior year period.
During Q4 FY15, consolidated Operating EBITDA is
Rs. 5989.48 mn as against Rs. 4771.63 mn in Q4
FY14, grew by 25.52%.
During Q4 FY15, PBT increased by 19.06% to Rs.
1762.44 mn from Rs. 1480.28 mn in Q4 FY14.
EPS of the company stood at Rs. 3.93 a share during
the quarter, registering 19.67% increased over
previous year period.
IRB Infrastructure Developers Ltd has bagged Rs.
2,650 Crore Agra-Etawah Bypass project from NHAI
in the state of Uttar Pradesh under NHDP Phase-V
on BOT (Toll) mode.
IRB's order book now stands at approximately Rs.
1,27,000 mn out of which Rs. 1,08,000 mn worth of
order book is to be executed in the next three to
four years.
IRB Infrastructure Developers Ltd has declared
Second Interim Dividend of Rs. 2/- per equity share
of face value of Rs. 10/- each, for the financial year
2014-15.
Net Sales and Operating Profit of the company are
expected to grow at a CAGR of 6% and 12% over
2014 to 2017E respectively.
PEER GROUPS CMP MARKET CAP EPS P/E (X) P/BV(X) DIVIDEND
Company Name (Rs.) Rs. in mn. (Rs.) Ratio Ratio (%)
IRB Infrastructure Developers Ltd 220.95 77652.88 15.45 14.30 1.78 40.00
Ashoka Buildcon Ltd 162.00 30305.00 4.36 37.16 2.40 28.00
IL&FS Transportation Networks Ltd 140.55 34676.55 17.98 7.82 0.83 40.00
Jaypee Infratech Ltd 11.95 16597.80 2.56 4.67 0.26 0.00
2. QUARTERLY HIGHLIGHTS (CONSOLIDATED)
Results updates- Q4 FY15,
IRB Infrastructure Developers Ltd undertakes
development of various infrastructure projects in
the road sector through several special purpose
vehicles in India, reported its financial results for the
quarter ended 31st Mar, 2015.
Months Mar-15 Mar-14 % Change
Net Sales 9904.49 8828.70 12.19
Net Profit 1382.19 1092.31 26.54
EPS 3.93 3.29 19.67
EBITDA 5989.48 4771.63 25.52
Consolidated net profit jumps to Rs. 1382.19 million against Rs. 1092.31 million in the corresponding quarter
ending of previous year, an increase of 26.54%. Revenue for the quarter rose by 12.19% to Rs. 9904.49 million
from Rs. 8828.70 million, when compared with the prior year period. Reported earnings per share of the
company stood at Rs. 3.93 a share during the quarter, registering 19.67% increased over previous year period.
Profit before interest, depreciation and tax is Rs. 5989.48 million as against Rs. 4771.63 million in the
corresponding period of the previous year.
Break up of Expenditure
Break up of
Expenditure
(Rs. in Mn)
Q4 FY15 Q4 FY14
%
Change
Contract & site
expenses
2387.88 1863.02 28%
Other Expenditure 251.58 432.68 -42%
Cost of Material
Consumed
1026.68 1561.94 -34%
Employee Benefit
Expenses
532.27 551.15 -3%
Depreciation &
Amortization Expense
1719.73 1192.80 44%
Total Expenditure 5918.14 5601.59 6%
3. Segment Revenue
Latest Updates
• IRB Infrastructure Developers Ltd has declared Second Interim Dividend of Rs. 2/- per equity share of face
value of Rs. 10/- each, for the financial year 2014-15.
• IRB Infrastructure Developers Ltd has bagged Rs. 2,650 Crore Agra-Etawah Bypass project from NHAI in the
state of Uttar Pradesh under NHDP Phase-V on BOT (Toll) mode.
• IRB's order book now stands at approximately Rs. 1,27,000 mn out of which Rs. 1,08,000 mn worth of order
book is to be executed in the next three to four years.
• During the quarter ended March 31, 2015 pursuant to the Qualified Institutions Placement (QIP), the
Company has allotted 19,085,390 equity shares of Rs. 10 each fully paid up at a premium of Rs. 220.54 per
share, to Qualified Institutional Buyers.
COMPANY PROFILE
IRB Infrastructure Developers Ltd. was incorporated to fund the capital requirements of the IRB Group initiatives
in the infrastructure sector. The company undertakes development of various infrastructure projects in the road
sector through several Special Purpose Vehicles. (Businesses of holding co. and its subsidiaries will be
implemented under superintendence, direction and control of the board of holding company, with the objective
of maximizing value for all stakeholders.)
IRB is an integrated infrastructure development and construction company in India with significant experience
in the toll roads and highways sector. IRB is one of the largest private developers in India with 23 Road BOT
Projects out of which 17 Projects are under operation.
4. FINANCIAL HIGHLIGHT (CONSOLIDATED) (A*- Actual, E* -Estimations & Rs. In Millions)
Balance sheet as at March 31, 2014A-2017E
FY14A FY15A FY16E FY17E
EQUITY AND LIABILITIES:
Shareholders’ Funds:
a) Share Capital 3323.64 3514.50 3514.50 3514.50
b) Reserves and Surplus 32283.35 40094.14 45876.55 52184.55
1) Sub Total Net worth 35606.99 43608.64 49391.05 55699.05
2) Minority Interest 356.06 350.51 364.53 375.47
Non-Current Liabilities:
a) Long-term borrowings 93979.52 108044.27 121009.58 133110.54
b) Deferred Tax Liabilities [Net] 224.46 193.91 178.40 165.91
c) Other Long Term Liabilities 657.41 215500.80 232740.86 246705.32
d) Long Term Provisions 2510.10 900.20 783.17 838.00
3) Sub Total Non-Current Liabilities 97371.49 324639.18 354712.02 380819.76
Current Liabilities:
a) Short-term borrowings 8965.14 6314.59 5177.96 4453.05
b) Trade Payables 4078.16 2338.91 2011.46 2212.61
c) Other Current Liabilities 10363.35 15389.03 18466.84 21052.19
d) Short Term Provisions 377.59 1288.87 1572.42 1776.84
4) Sub Total Current Liabilities 23784.24 25331.40 27228.68 29494.69
Total Liabilities (1+2+3+4) 157118.78 393929.73 431696.28 466388.96
ASSETS:
Non-Current Assets:
Fixed Assets
Tangible assets 3008.98 2834.76 3004.84 3155.08
Intangible assets 81419.51 313687.25 345777.06 374948.72
Capital Work in Progress 482.88 804.02 948.74 1081.57
Intangible assets under development 44384.42 47549.25 50402.21 52922.32
a) Sub Total - Fixed Assets 129295.79 364875.28 400132.85 432107.69
b) Goodwill on consolidation 1115.54 1115.57 1171.34 1218.20
c) Non Current Investments 13.56 7.77 8.39 8.90
d) Deferred Tax Asset 81.13 24.37 21.20 23.05
e) Long Term Loans and Advances 3029.04 3866.95 4640.34 5336.39
f) Other non-current assets 188.18 254.95 300.84 339.94
5) Sub Total Non-Current Assets 133723.23 370144.88 406274.96 439034.16
Current Assets:
a) Current Investment 131.65 80.03 97.64 112.28
b) Inventories 2683.40 2598.50 2832.36 3058.95
c) Trade Receivables 55.21 49.14 54.05 58.91
d) Cash and Bank Balances 14823.47 15798.33 16904.21 18256.55
e) Short Term Loans and Advances 5490.10 4977.66 5226.54 5540.13
f) Other Current Assets 211.72 281.21 306.52 327.98
6) Sub Total Current Assets 23395.55 23784.86 25421.32 27354.80
Total Assets (5+6) 157118.78 393929.73 431696.28 466388.96
5. Annual Profit & Loss Statement for the period of 2014 to 2017E
Value(Rs.in.mn) FY14A FY15A FY16E FY17E
Description 12m 12m 12m 12m
Net Sales 37318.87 38474.80 42322.27 46342.89
Other Income 1214.26 1130.09 1186.59 1257.79
Total Income 38533.13 39604.89 43508.87 47600.68
Expenditure -19782.14 -16357.87 -17775.36 -19371.33
Operating Profit 18750.99 23247.02 25733.51 28229.35
Interest -7561.66 -9312.04 -10429.48 -11472.43
Gross profit 11189.33 13934.98 15304.03 16756.93
Depreciation -4770.55 -7070.62 -7919.09 -8711.00
Profit Before Tax 6418.78 6864.36 7384.94 8045.92
Tax -1822.51 -1440.83 -1602.53 -1737.92
Profit After Tax 4596.27 5423.53 5782.41 6308.00
Minority Interest -4.98 5.54 0.00 0.00
Net Profit 4591.29 5429.07 5782.41 6308.00
Equity capital 3323.64 3514.50 3514.50 3514.50
Reserves 32283.35 40094.14 45876.55 52184.55
Face value 10.00 10.00 10.00 10.00
EPS 13.81 15.45 16.45 17.95
Quarterly Profit & Loss Statement for the period of 30th Sep, 2014 to 30th June, 2015E
Value(Rs.in.mn) 30-Sep-14 31-Dec-14 31-Mar-15 30-Jun-15E
Description 3m 3m 3m 3m
Net sales 8831.70 9638.27 9904.49 10993.98
Other income 288.09 291.84 283.40 294.73
Total Income 9119.79 9930.11 10187.89 11288.71
Expenditure -3602.06 -4084.57 -4198.41 -4666.95
Operating profit 5517.73 5845.54 5989.48 6621.77
Interest -2265.99 -2371.64 -2507.32 -2657.75
Gross profit 3251.74 3473.90 3482.17 3964.01
Depreciation -1797.29 -1788.50 -1719.73 -1960.49
Profit Before Tax 1454.45 1685.40 1762.44 2003.53
Tax -234.56 -352.21 -398.22 -434.77
Profit After Tax 1219.89 1333.19 1364.22 1568.76
Minority Interest -2.51 -7.63 17.97 0.00
Net Profit 1217.38 1325.56 1382.19 1568.76
Equity capital 3323.64 3323.64 3514.50 3514.50
Face value 10.00 10.00 10.00 10.00
EPS 3.66 3.99 3.93 4.46
7. OUTLOOK AND CONCLUSION
At the current market price of Rs. 220.95, the stock P/E ratio is at 13.43 x FY16E and 12.31 x FY17E
respectively.
Earning per share (EPS) of the company for the earnings for FY16E and FY17E is seen at Rs.16.45 and
Rs.17.95 respectively.
Net Sales and Operating Profit of the company are expected to grow at a CAGR of 6% and 12% over 2014 to
2017E respectively.
On the basis of EV/EBITDA, the stock trades at 7.26 x for FY16E and 6.97 x for FY17E.
Price to Book Value of the stock is expected to be at 1.57 x and 1.39 x for FY16E and FY17E respectively.
We recommend ‘BUY’ in this particular scrip with a target price of Rs.255.00 for Medium to Long term
investment.
INDUSTRY OVERVIEW
India has the second largest road network in the world at 4.7 million km. This network transports more than 60
per cent of all goods in the country and 85 per cent of India’s total passenger traffic. Road activity has gradually
increased over the years with the improvement in connectivity between cities, towns and villages in the country.
With automobiles and freight movement also growing at a rapid rate, the necessity for a road network good
enough to carry the traffic is paramount. Understanding this need, the Government of India has set aside 20 per
cent of the investment of US$ 1 trillion reserved for infrastructure during the 12th Five-Year Plan (2012–17) to
develop the country's roads.
8. Market size
The value of roads and bridges infrastructure in India is projected to grow at a compound annual growth rate
(CAGR) of 17.4 per cent over FY12–17. The country's roads and bridges infrastructure, which was valued at US$
6.9 billion in 2009 is expected to touch US$ 19.2 billion by 2017. The financial outlay for road transport and
highways grew at a CAGR of 19.4 per cent in the period FY09-14. For FY14, India’s Planning Commission
provided an outlay of US$ 6.9 billion for the roads segment.
Road construction projects awarded to build-operate-transfer (BOT) companies achieved a CAGR of 17.1 per
cent over FY06-13.
Key Investments/Developments
Some of the key investments and developments in the Indian roads sector are as follows:
• The cabinet committee on economic affairs (CCEA) has approved six highway projects totalling 712 km
with an investment of Rs 12,646 crore (US$ 2 billion).
• The Delhi-Panipat stretch of NH-1 would be expanded to an eight-laned dedicated highway in the next
three years.
• Chhattisgarh is planning to invest Rs 9,500 crore (US$ 1.5 billion) to upgrade 44 roads in the state.
• The government is set to offer the final batch of road projects for this financial year. A total of nine, with a
cumulative length of 895 km and project cost of Rs 17,815 crore (US$ 2.82 billion), are to be offered soon.
The Indian government plans to set up a finance corporation with an amount of Rs 1 trillion (US$ 15.83 billion),
in collaboration with Japanese investors, to fund projects in the roads segment. The Japanese partners are
expected to have a 26 per cent stake with assured returns of nine per cent, according to an official source.
Road Ahead
India's growing population requires a robust infrastructure. The government, through a series of initiatives, is
working on policies to attract significant investor interest. .
The Indian government plans to develop a total of 66,117 km of roads under different programmes such as
National Highways Development Project (NHDP), Special Accelerated Road Development Programme in North
East (SARDP-NE) and Left Wing Extremism (LWE), and has set an objective of building 30 km of road a day from
2016.
9. Disclaimer:
This document is prepared by our research analysts and it does not constitute an offer or solicitation for the
purchase or sale of any financial instrument or as an official confirmation of any transaction. The information
contained herein is from publicly available data or other sources believed to be reliable but we do not represent that
it is accurate or complete and it should not be relied on as such. Firstcall Research or any of its affiliates shall not be
in any way responsible for any loss or damage that may arise to any person from any inadvertent error in the
information contained in this report. Firstcall Research and/ or its affiliates and/or employees will not be liable for
the recipients’ investment decision based on this document.
10. Firstcall India Equity Research: Email – info@firstobjectindia.com
C.V.S.L.Kameswari Pharma & Diversified
U. Janaki Rao Capital Goods
B. Anil Kumar Auto, IT & FMCG
M. Vinayak Rao Diversified
G. Amarender Diversified
Firstcall Research Provides
Industry Research on all the Sectors and Equity Research on Major Companies
forming part of Listed and Unlisted Segments
For Further Details Contact:
Tel.: 022-2527 2510/2527 6077 / 25276089 Telefax: 022-25276089
040-20000235 /20000233
E-mail: info@firstobjectindia.com
www.firstcallresearch.com