Firstcall recommend GHCL on 31.45% y/y rise in Q4FY15 net profit
•
0 j'aime•151 vues

GHCL Q4FY15: Net profits up 31.45% y/y, Firstcall recommend 'buy'

Recommandé
Recommandé
Contenu connexe
Tendances
Tendances (19)
Similaire à Firstcall recommend GHCL on 31.45% y/y rise in Q4FY15 net profit
Similaire à Firstcall recommend GHCL on 31.45% y/y rise in Q4FY15 net profit (20)
Plus de IndiaNotes.com
Plus de IndiaNotes.com (20)
Dernier
Dernier (20)
Firstcall recommend GHCL on 31.45% y/y rise in Q4FY15 net profit
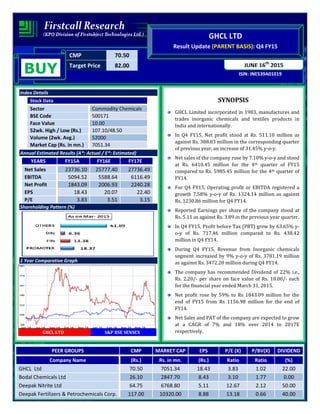
- 1. CMP 70.50 Target Price 82.00 ISIN: INE539A01019 JUNE 16th 2015 GHCL LTD Result Update (PARENT BASIS): Q4 FY15 BUY Index Details Stock Data Sector Commodity Chemicals BSE Code 500171 Face Value 10.00 52wk. High / Low (Rs.) 107.10/48.50 Volume (2wk. Avg.) 52000 Market Cap (Rs. in mn.) 7051.34 Annual Estimated Results (A*: Actual / E*: Estimated) YEARS FY15A FY16E FY17E Net Sales 23736.10 25777.40 27736.49 EBITDA 5094.52 5588.64 6116.49 Net Profit 1843.09 2006.93 2240.28 EPS 18.43 20.07 22.40 P/E 3.83 3.51 3.15 Shareholding Pattern (%) 1 Year Comparative Graph GHCL LTD S&P BSE SENSEX SYNOPSIS GHCL Limited incorporated in 1983, manufactures and trades inorganic chemicals and textiles products in India and internationally. In Q4 FY15, Net profit stood at Rs. 511.10 million as against Rs. 388.83 million in the corresponding quarter of previous year, an increase of 31.45% y-o-y. Net sales of the company rose by 7.10% y-o-y and stood at Rs. 6410.45 million for the 4th quarter of FY15 compared to Rs. 5985.45 million for the 4th quarter of FY14. For Q4 FY15, Operating profit or EBITDA registered a growth 7.58% y-o-y of Rs. 1324.14 million as against Rs. 1230.86 million for Q4 FY14. Reported Earnings per share of the company stood at Rs. 5.11 as against Rs. 3.89 in the previous year quarter. In Q4 FY15, Profit before Tax (PBT) grew by 63.65% y- o-y of Rs. 717.46 million compared to Rs. 438.42 million in Q4 FY14. During Q4 FY15, Revenue from Inorganic chemicals segment increased by 9% y-o-y of Rs. 3781.19 million as against Rs. 3472.20 million during Q4 FY14. The company has recommended Dividend of 22% i.e., Rs. 2.20/- per share on face value of Rs. 10.00/- each for the financial year ended March 31, 2015. Net profit rose by 59% to Rs 1843.09 million for the end of FY15 from Rs 1156.98 million for the end of FY14. Net Sales and PAT of the company are expected to grow at a CAGR of 7% and 18% over 2014 to 2017E respectively. PEER GROUPS CMP MARKET CAP EPS P/E (X) P/BV(X) DIVIDEND Company Name (Rs.) Rs. in mn. (Rs.) Ratio Ratio (%) GHCL Ltd 70.50 7051.34 18.43 3.83 1.02 22.00 Bodal Chemicals Ltd 26.10 2847.70 8.43 3.10 1.77 0.00 Deepak Nitrite Ltd 64.75 6768.80 5.11 12.67 2.12 50.00 Deepak Fertilizers & Petrochemicals Corp. 117.00 10320.00 8.88 13.18 0.66 40.00
- 2. QUARTERLY HIGHLIGHTS (PARENT BASIS) Results Updates- Q4 FY15 GHCL Limited was incorporated in 1983. It manufactures and trades inorganic chemicals and textiles products in India and internationally has reported its financial results for the quarter ended 31st March, 2015. The company’s net profit jumps to Rs. 511.10 million an increase of 31.45% in 4th quarter of FY15 as against Rs. 388.83 million in the corresponding period of previous year. Revenue for the quarter rose by 7.10% to Rs. 6410.45 million from Rs. 5985.45 million, when compared with the prior year period. EPS of the company stood at Rs. 5.11 a share during the quarter as against Rs. 3.89 over previous year period. EBITDA was at Rs. 1324.14 million in Q4 FY15 as against Rs. 1230.86 million in the corresponding period of the previous year. Break up of Expenditure Segment Revenue Months Mar-15 Mar-14 % Change Net Sales 6410.45 5985.45 7.10 PAT 511.10 388.83 31.45 EPS 5.11 3.89 31.45 EBITDA 1324.14 1230.86 7.58 Break up of Expenditure (Rs in millions) Q4 FY15 Q4 FY14 Chg % Cost of material Consumed 2202.93 2249.77 -2% Employee Benefit Exp 293.88 329.86 -11% Dep & Amortization Exp 272.24 198.46 37% Other Expenses 1048.16 915.30 15% Purchase of stock in Trade 154.48 103.63 49% Power Fuel & Water 978.16 1074.88 -9%
- 3. COMPANY PROFILE GHCL Limited was incorporated in 1983. Together with its subsidiaries, it manufactures and trades inorganic chemicals and textiles products in India and internationally. The company operates through Inorganic Chemicals, Textiles, and Others segments. The Inorganic Chemicals segment provides soda ash used in textiles, paper, metallurgical industries, and desalination plants. This segment also offers organic and inorganic chemicals, including sodium tripolyphosphate, liner alkyl benzene LAB, borax, sodium sulphate, zeolite, optical brightener, and hydrogen peroxide used in detergent, glass manufacturing, and other related industries. GHCL Limited, being one of the leading manufacturers of Soda Ash in India, has an annual production capacity of 8,50,000 metric tons, which contributes to almost 29% of the annual domestic requirement. Soda Ash is an essential ingredient in the manufacture of detergent, soap, glass, sodium salts and dyes. It is widely used in textiles, paper, metallurgical industries and desalination plants. As a Chemical Manufacturer, the company produces premium quality Soda Ash enabling our customers to produce high-quality detergent, soap, glass, sodium salts and dyes. The company has a strong Marketing and Distribution network that enables it to effectively cater to both Domestic and Overseas Market. GHCL Soda Ash is used by almost all major manufacturers of Glass, Soap and Detergent, Silicates and Other Chemicals. The Textiles segment manufactures yarn, griege fabric, and home textile products comprising bed linen, curtains, made ups, and cotton yarn. This segment also provides flat sheets, fitted sheets, pillow cases, shams, valences, curtains, duvet covers, and other bed items in cotton and blends under the Grace brand name. The other segment is involved in the provision of information technology enabled services; and the generation of wind power. The two Spinning units are located within the state of Tamil Nadu; India has an Installed capacity of 125,000 spindles manufacturing 100% Cotton and Polyester Cotton yarns. The manufacturing units at the Textile Company have state-of-the-art textile machinery from Reiter, Switzerland and Schlafhorst, Germany, among others to lend that cutting edge to Quality. The production facilities are ISO 9001-2000 certified and also have been awarded the OKO-TEX certification from CITIVE. As a Textile company the R&D and advanced technological processes ensure Home Textile products are appropriately designed for cross-industry usage from Homes, Hotels to Healthcare. GHCL takes pride in manufacturing various grades of Edible as well as Industrial grade salt. The company’s salt works expands to around 3,200 acres of leased land for salt production, which has a capacity to produce 150,000 metric tonns per annum of raw salt. The refinery at Tiruporur has state-of-the-art infrastructure with an installed capacity to produce 70,000 metric tons of refined iodized salt per annum.
- 4. FINANCIAL HIGHLIGHT (PARENT BASIS) (A*- Actual, E* -Estimations & Rs. In Millions) Balance Sheet as at March 31, 2014 -2017E FY14A FY15A FY16E FY17E SOURCES OF FUNDS Shareholder's Funds a) Share Capital 1000.19 1000.19 1000.19 1000.19 b) Reserves and Surplus 7597.77 6697.14 6831.08 7145.31 1. Sub Total - Net worth 8597.96 7697.33 7831.27 8145.50 Non Current Liabilities a) Long term Borrowings 7233.27 7837.46 8307.71 8640.02 b) Deferred Tax Liabilities 1620.20 1727.27 1830.91 1922.45 c) Other Long term Liabilities 57.72 46.77 39.75 43.73 d) Long term Provisions 16.81 37.84 56.12 75.76 2. Sub Total - Non Current Liabilities 8928.00 9649.34 10234.49 10681.95 Current Liabilities a) Short term Borrowings 4947.77 4541.65 4269.15 4098.38 b) Trade Payables 4170.48 3918.64 4114.57 4402.59 c) Other Current Liabilities 1752.00 1688.32 1637.67 1676.97 d) Short Term Provisions 383.70 412.78 437.55 459.42 3. Sub Total - Current Liabilities 11253.95 10561.39 10458.94 10637.38 Total Liabilities (1+2+3) 28779.91 27908.06 28524.70 29464.83 APPLICATION OF FUNDS Non-Current Assets a) Fixed Assets 18800.06 19393.66 19975.47 20694.59 b) Non-current investments 55.83 15.80 17.13 17.98 c) Long Term loans and advances 237.55 130.87 86.37 91.56 d)Other non-current assets 5.47 4.69 4.78 6.12 1. Sub Total - Non Current Assets 19098.91 19545.02 20083.75 20810.25 Current Assets a) Current investments 20.00 0.00 0.00 0.00 b) Inventories 4041.81 4173.31 4273.47 4316.20 c) Trade receivables 2978.69 2675.13 2883.72 3172.09 d) Cash and Bank Balances 390.59 319.91 351.90 404.69 e) Short-terms loans & advances 2249.91 1194.69 931.86 761.60 2. Sub Total - Current Assets 9681.00 8363.04 8440.95 8654.59 Total Assets (1+2) 28779.91 27908.06 28524.70 29464.83
- 5. Annual Profit & Loss Statement for the period of 2014 to 2017E Value(Rs.in.mn) FY14A FY15A FY16E FY17E Description 12m 12m 12m 12m Net Sales 22242.09 23736.10 25777.40 27736.49 Other Income 49.99 112.57 123.83 133.73 Total Income 22292.08 23848.67 25901.23 27870.22 Expenditure -17680.01 -18754.15 -20312.59 -21753.73 Operating Profit 4612.07 5094.52 5588.64 6116.49 Interest -1705.30 -1638.36 -1680.96 -1765.01 Gross profit 2906.77 3456.16 3907.68 4351.49 Depreciation -815.68 -844.53 -920.54 -1012.59 Exceptional Items -588.55 -32.19 -44.42 -29.76 Profit Before Tax 1502.54 2579.44 2942.72 3309.13 Tax -339.60 -749.19 -935.78 -1068.85 Profit After Tax 1162.94 1830.25 2006.93 2240.28 Extraordinary Items -5.96 12.84 0.00 0.00 Net Profit 1156.98 1843.09 2006.93 2240.28 Equity capital 1000.19 1000.19 1000.19 1000.19 Reserves 4378.43 5945.51 7634.03 9618.88 Face value 10.00 10.00 10.00 10.00 EPS 11.57 18.43 20.07 22.40 Quarterly Profit & Loss Statement for the period of 30th Sept 2014 to 30th June, 2015E Value(Rs.in.mn) 30-Sep-14 31-Dec-14 31-Mar-15 30-June-15E Description 3m 3m 3m 3m Net sales 5922.49 5816.12 6410.45 6186.08 Other income 12.00 31.33 32.79 38.82 Total Income 5934.49 5847.45 6443.24 6224.91 Expenditure -4760.10 -4594.66 -5119.10 -4750.91 Operating profit 1174.39 1252.79 1324.14 1473.99 Interest -416.95 -440.09 -360.05 -378.05 Gross profit 757.44 812.70 964.09 1095.94 Depreciation -189.97 -194.14 -272.24 -249.37 Exceptional Items -56.82 -11.17 25.61 -9.49 Profit Before Tax 510.66 607.39 717.46 837.08 Tax -203.90 -188.60 -219.20 -248.61 Profit After Tax 306.76 418.79 498.26 588.46 Extraordinary Items 0.00 0.00 12.84 0.00 Net Profit 306.76 418.79 511.10 588.46 Equity capital 1000.19 1000.19 1000.19 1000.19 Face value 10.00 10.00 10.00 10.00 EPS 3.07 4.19 5.11 5.88
- 6. Ratio Analysis Particulars FY14A FY15A FY16E FY17E EPS (Rs.) 11.57 18.43 20.07 22.40 EBITDA Margin (%) 20.74% 21.46% 21.68% 22.05% PBT Margin (%) 6.76% 10.87% 11.42% 11.93% PAT Margin (%) 5.23% 7.71% 7.79% 8.08% P/E Ratio (x) 6.09 3.83 3.51 3.15 ROE (%) 21.62% 26.35% 23.24% 21.10% ROCE (%) 30.91% 30.73% 30.69% 30.52% Debt Equity Ratio 2.26 1.78 1.46 1.20 EV/EBITDA (x) 4.08 3.75 3.45 3.17 Book Value (Rs.) 53.78 69.44 86.33 106.17 P/BV 1.31 1.02 0.82 0.66 Charts
- 7. OUTLOOK AND CONCLUSION At the current market price of Rs. 70.50 the stock P/E ratio is at 3.51 x FY16E and 3.15 x FY17E respectively. Earnings per share (EPS) of the company for the earnings for FY16E and FY17E are seen at Rs. 20.07 and Rs. 22.40 respectively. Net Sales and PAT of the company are expected to grow at a CAGR of 7% and 18% over 2014 to 2017E respectively. On the basis of EV/EBITDA, the stock trades at 3.45 x for FY16E and 3.17 x for FY17E. Price to Book Value of the stock is expected to be at 0.82 x and 0.66 x respectively for FY16E and FY17E. We recommend ‘BUY’ in this particular scrip with a target price of Rs. 82.00 for Medium to Long term investment.
- 8. INDUSTRY OVERVIEW Global demand for soda ash is growing. At the same time there is an extremely sharp increase in input costs for soda ash manufacturers in all regions. World’s total soda ash demand which at present is at 54.00 Million MT is expected to grow by at least 4 % with more than 50% of it is expected to come from Latin America, India, China and Middle East countries due to a higher expected GDP growth. Consumption of soda ash per person is expected to register healthy rise in the next few years with China leading the rankings with consumption from 10.85 kilograms in 2007 to an expected 12.00 kilograms in 2013. China is likely to add at least 2 Million MT capacities every year on the back of huge infrastructure investments. The manufacturing and processing costs for producing soda ash from trona are more cost competitive than other manufacturing techniques partly because of the cost associated with procuring the material needed for synthetic production. In addition, trona- based production consumes less energy. The average cost of production per ton of soda ash (before freight and logistics costs) from trona is approximately one-third to one-half the cost per ton of soda ash from synthetic production. The future depends up on soda ash prices. Soda ash prices fluctuate according to the demand supply situation in the global market, China in particular. Textiles – Outlook & Growth Global trade in textile is currently at 550 Billion USD, growing at CAGR of 4%. Indian Textile industry is about 60 Billion USD. The Textile industry in India traditionally, after agriculture, is the only industry that has generated huge employment for both skilled and unskilled labor in textiles. The textile industry continues to be the second largest employment generating sector in India with employment to more than 35 million people. Besides, another 55 million people are engaged in its allied activities. The Indian Textiles Industry is the 2nd largest only after China. The Industry plays a major role in the economy of the country and contributes about 11% to Industrial Production, 14% to the manufacturing sector and around 4% to GDP of the country. Further, it also contributes about 12% of the country’s total export earnings. There are 2500 weaving factories and 4125 textile finishing factories across the country. Textile industry has been growing at 10% over last several years. Government of India has provided a number of export promotion policies for the Textile sector. In addition, States of Gujarat, Maharashtra, Madhya Pradesh have special incentive for textile industry. With Indian Textile industry looking to grow to 140 billion mark by 2025, there are going to be huge opportunities in future for growth in this industry. Overall the outlook of the Indian Textile Industry looks positive. The Government had set an export target of US$ 65 billion and creation of 25 million additional jobs has been proposed with a CAGR of 15% during the 12th Five Year Plan (2012-17). Inherent strengths & cost competitiveness of Indian textiles industry is catalyzing major retailers & brands of the world such as Wal-Mart, Target Gap, Marks & Spencer & Tesco to set up their sourcing hubs which augurs well for the sector.
- 9. Disclaimer: This document is prepared by our research analysts and it does not constitute an offer or solicitation for the purchase or sale of any financial instrument or as an official confirmation of any transaction. The information contained herein is from publicly available data or other sources believed to be reliable but we do not represent that it is accurate or complete and it should not be relied on as such. Firstcall Research or any of its affiliates shall not be in any way responsible for any loss or damage that may arise to any person from any inadvertent error in the information contained in this report. Firstcall Research and/ or its affiliates and/or employees will not be liable for the recipients’ investment decision based on this document.
- 10. Firstcall India Equity Research: Email – info@firstobjectindia.com C.V.S.L.Kameswari Pharma & Diversified U. Janaki Rao Capital Goods B. Anil Kumar Auto, IT & FMCG M. Vinayak Rao Diversified G. Amarender Diversified Firstcall Research Provides Industry Research on all the Sectors and Equity Research on Major Companies forming part of Listed and Unlisted Segments For Further Details Contact: Tel.: 022-2527 2510/2527 6077 / 25276089 Telefax: 022-25276089 040-20000235 /20000233 E-mail: info@firstobjectindia.com www.firstcallresearch.com